Risk Management Is Not Protection... It’s Your Edge!!!Most traders treat risk management like a seatbelt.
Something you use just in case.
🧳Professionals treat risk management as their main edge.
Because in trading, you don’t get paid for being right...
you get paid for staying in the game long enough for probabilities to work.
1️⃣ Risk Is Defined Before the Trade Exists
Before you think about entries or targets, one question must already be answered:
Where am I wrong?
If you don’t know where your idea fails,
you’re not managing risk... you’re hoping.
Professionals define risk first.
The trade only exists after invalidation is clear.
2️⃣ Small Risk Creates Big Freedom
When risk is small and predefined:
- hesitation disappears
- emotions calm down
- execution improves
Why?
Because no single trade matters anymore.
You stop needing trades to work, and that’s when trading becomes objective.
3️⃣ Risk Management Turns Losses Into Data
Losses are unavoidable.
Damage is optional.
A controlled loss is not a failure; it’s information.
Every loss tells you:
- the market condition wasn’t right
- the timing was early
- or the structure changed
When risk is managed, losses educate instead of punish.
4️⃣ Consistency Is Built on Risk, Not Wins
Winning streaks feel good.
They don’t build careers.
Surviving losing streaks does.
Proper risk management ensures:
- drawdowns stay shallow
- confidence stays intact
- discipline stays repeatable
That’s how traders last long enough to improve.
💡The Real Truth
You don’t need a better strategy.
You need better control over downside.
Risk management is what allows:
- imperfect strategies to work
- average win rates to grow accounts
- traders to evolve instead of quit
⚠️ Disclaimer: This is not financial advice. Always do your own research and manage risk properly.
📚 Stick to your trading plan regarding entries, risk, and management.
Good luck! 🍀
All Strategies Are Good; If Managed Properly!
~Richard Nasr
Traders

Gold Is Holding Firm Into Year-End — A Santa Rally Is Setting UpGold on H4 continues to trade in a strong bullish structure, consolidating just below the key resistance zone around the previous high. Price is holding comfortably above the rising EMA base, with higher lows intact, confirming that buyers remain in control despite short-term pullbacks. This sideways-to-higher behavior beneath resistance signals absorption rather than distribution, as selling pressure fails to force acceptance below the support zone. Structurally, this is a classic bullish consolidation, where the market pauses to build liquidity before the next directional move.
From a macro perspective, the setup is supported by typical year-end dynamics. As liquidity thins into the Christmas period, markets often shift into range compression followed by sharp directional expansions. At the same time, expectations around U.S. monetary policy remain tilted toward easing in 2025, keeping real yields capped and limiting sustained USD strength. Combined with ongoing geopolitical and macro uncertainty, this environment continues to favor Gold as a defensive asset.
As long as price holds above the support zone and maintains acceptance below resistance, the bullish bias remains intact. A clean breakout and hold above resistance would likely open the path toward a new ATH, while failure to break simply extends consolidation rather than signaling a top. For now, this is a patience phase OANDA:XAUUSD is not stalling, it is positioning.

Gold Is Trapped Between Control ZonesGold on H1 remains locked inside a clearly defined range, with price oscillating between a well-defended support zone around 4,260 and a heavy resistance band near 4,350–4,360. The broader structure is still constructive, as higher lows continue to form above the rising EMA base, confirming that buyers have not lost control. Repeated failures to accept above resistance show that sellers are active at the highs, compressing price rather than reversing the trend a classic balance phase where liquidity is building on both sides. From a macro perspective, this consolidation aligns with a cautious market stance ahead of key U.S. data and ongoing uncertainty around Fed policy, where neither USD strength nor risk-off flows are decisive enough to force a breakout. As long as real yields remain capped and expectations around rate cuts stay supportive, downside moves in Gold are more likely corrective than trend-breaking. A clean acceptance above the resistance zone would signal macro and technical alignment for expansion toward new highs, while rejection simply prolongs consolidation and reinforces patience. In this environment, chasing moves inside the range offers low edge the opportunity emerges only when price exits the box with clear intent.

Gold Is Compressing Under ATH — Macro Is Still on Its SideHello Guys
Gold on H1 remains in a bullish consolidation just below the previous high around 4,380, with price rotating cleanly inside a well-defined range. This structure reflects strength, not exhaustion: pullbacks are shallow, higher lows continue to form, and sellers have failed to generate acceptance below the support zone. Price behavior suggests absorption, where supply is being gradually consumed while the market builds energy for expansion rather than reversing.
From a macro perspective, this consolidation aligns with a supportive backdrop for Gold. Expectations around U.S. monetary policy remain tilted toward easing rather than renewed tightening, keeping real yields capped and limiting USD upside. At the same time, persistent geopolitical and macro uncertainty continues to underpin demand for safe-haven assets. These conditions reduce the probability of a deep corrective sell-off and favor sideways-to-higher price action instead.
As long as Gold holds above the support zone and continues to accept value below ATH, the broader bias remains bullish. A clean acceptance above 4,380 would signal alignment between technical structure and macro conditions, opening the door for a push toward a new ATH. Until that breakout occurs, this remains a patience phase consolidation is the setup, not the signal.
What do you think about OANDA:XAUUSD ?

ETH Finishes Wave 5 — Is an ABC Reversal Starting?ETH/USD – H4 MARKET ANALYSIS
1. Market Structure
- Ethereum has completed a full 5-wave bearish Elliott structure (1–2–3–4–5).
The strongest selling pressure appeared during Wave (3), followed by a final capitulation move at Wave (5).
- After reaching the Wave (5) low, price failed to make a new low and instead began forming a small accumulation base, signaling seller exhaustion.
This confirms that the bearish impulse has ended, and the market is transitioning into a corrective recovery phase.
2. Elliott Wave Context
Wave (5) completion → end of the bearish cycle
Price reaction from the low aligns with Wave A
Current structure suggests a corrective ABC move, not a trend reversal
Expected path:
Wave A: Initial technical rebound
Wave B: Shallow pullback to absorb supply
Wave C: Continuation higher toward resistance
3. Key Technical Zones
Demand Zone: Wave (5) low (critical invalidation level)
Resistance 1: Previous Wave (4) structure
Resistance 2: Higher structural + MA confluence (Wave C target)
As long as price holds above the Wave (5) low, the corrective scenario remains valid.
4. Scenario Outlook
✅ Primary Scenario (High Probability)
Price holds above Wave (5) low
ABC correction continues to unfold
Wave C pushes price higher into resistance
This is a technical rebound, not a macro trend reversal
⚠️ Alternative Scenario
Strong breakdown below Wave (5) low
→ Elliott structure invalidated
→ Bearish trend resumes
5. Trading Bias
Short-term: Buy the dips within the ABC structure
Avoid chasing impulsive moves
Focus on pullbacks during Wave B
Strict risk management is required — this is a corrective phase
Summary
Ethereum has completed a bearish Elliott cycle and is now entering a corrective ABC recovery.
As long as the Wave (5) low holds, short-term upside remains favored.

Gold Is Quiet — And That’s Exactly When Breakouts Are BuiltGold is not breaking out yet — it is building pressure.
After the impulsive move, price is now compressing inside a clear accumulation zone, showing repeated defenses from buyers while sellers fail to push price meaningfully lower. This sideways structure signals absorption rather than weakness. As long as Gold holds above the 4,260–4,270 key zone, the broader bullish structure remains intact and the market is preparing for expansion. A clean break and hold above this range would open the path toward breaking the old ATH. Until that happens, this is a patience phase not a chase phase.

Ethereum May Have Finished the Sell-Off — Now Comes the TestOn the H4 timeframe, Ethereum’s price action aligns well with a completed 5-wave Elliott impulse to the downside. Wave (1) initiated the breakdown from the prior distribution range, followed by a weak corrective Wave (2) that failed to regain structure. Wave (3) unfolded as the strongest and most extended leg lower, confirming dominant bearish momentum a textbook characteristic of a third wave. This was followed by a shallow, overlapping Wave (4), before ETH printed a final Wave (5) sell-off into the 2,880–2,950 region, where downside momentum visibly slowed, suggesting selling exhaustion.
With Wave (5) likely completed, ETH now appears to be transitioning into a corrective ABC structure to the upside. The initial rebound from the lows can be interpreted as Wave A, followed by a potential pullback to form Wave B, before a broader Wave C advance toward the upper resistance zone around 3,400–3,450. This type of move would represent a technical recovery, not a confirmed trend reversal, consistent with post impulse Elliott behavior.
From a macro perspective, this Elliott setup fits the current environment. Broader crypto markets are stabilizing as risk sentiment improves modestly and no new liquidity shock is present. Expectations around U.S. monetary policy remain relatively steady, with yields no longer accelerating higher a condition that reduces pressure on risk assets like ETH. However, the absence of aggressive liquidity expansion also implies that any upside is more likely corrective and structured, rather than impulsive and trend-defining.
In summary, as long as the Wave (5) low holds, the Elliott framework supports a recovery via an ABC correction. A decisive break below that low would invalidate the count and reopen bearish continuation risk. Until confirmation is clear, patience remains critical the edge lies in letting both structure and macro conditions align before committing.

Gold Is Tricking Everyone Right Now-The Real Move Hasn’t StartedGOLD MARKET ANALYSIS – XAUUSD (H1)
1. Market Structure Overview
- Gold is currently in a short-term corrective phase after failing to immediately break above the 4350 Resistance Zone.
- The market has transitioned from impulsive bullish expansion into a controlled pullback, forming a range-bound structure between resistance and support.
- Despite the pullback, the overall structure remains bullish, as price is still holding above the last major breakout base.
This move is corrective, not distributive.
2. Key Support & Resistance Zones
Major Resistance Zone:
🔴 4350 – 4355
→ Previous rejection zone + supply absorption area.
Highest High / Target:
⚫ 4381
→ Liquidity magnet above range highs.
Major Support Zone:
🟢 4255 – 4260
→ Strong demand zone and reaction base.
This range defines the current battlefield between buyers and sellers.
3. Market Scenarios
Primary Scenario – Support Hold → Bullish Continuation (High Probability)
Price continues to pull back into the 4255 support zone.
Sellers lose momentum inside support.
Buyers step in, forming a higher low.
Gold rotates back toward resistance.
🎯 Targets: 4350 – 4355
Extension toward 4381 (Highest High / Liquidity Target)
This matches the classic sequence:
Pullback → Support reaction → Trend continuation
Alternative Scenario – Range Expansion Failure (Low Probability)
Only valid if 4255 breaks with strong momentum.
This would trigger a deeper correction toward 4200 – 4220.
No structural evidence currently supports this scenario.
4. Market Psychology & Liquidity Behavior
- Late buyers are getting shaken out during the pullback.
- Smart money is not selling aggressively volume is decreasing into support.
- Price behavior shows liquidity recycling, not panic selling.
- This is a textbook cooling phase before continuation.
The market is pausing to reset momentum, not reversing.
5. Trading Bias & Execution Insight
Bias: Bullish after correction
No chasing price in the middle of the range.
Best opportunities:
✔ Buy reaction from 4255 – 4260
✔ Buy breakout & hold above 4355
Patience is required the expansion comes after compression.
Gold is respecting its structure perfectly:
Correct → Hold support → Reload → Break higher.

Bitcoin Faces a Major Decision Zone - Relief Rally 🔹 MARKET BRIEFING – BTC/USD (1H)
Market State:
– Bitcoin has completed a sharp corrective move and is now attempting a rebound from the local demand area.
– The current price action shows a technical relief bounce, not a confirmed trend reversal, with price moving back toward a well-defined supply zone.
Key Levels:
– Support / Demand Zone: 88,000 – 88,500
– Current Reaction Area: 89,300 – 89,600
– Strong Resistance Zone: 91,500 – 92,700
This resistance aligns with previous breakdown structure, making it a high-probability reaction area.
🌍 Macro Context – Why This Is Likely a Range-to-Reject Setup
– Fed Policy: The market remains in a data-dependent holding pattern. With no immediate dovish catalyst, liquidity expansion expectations are limited.
– Risk Assets: Equities and crypto are both showing mean-reversion behavior, not impulsive risk on flows.
– Liquidity Conditions: Recent downside move flushed short-term longs, enabling a bounce but macro liquidity does not yet support sustained upside continuation.
Next Move:
– A continued push toward 91,500–92,700 is possible as part of a corrective retracement.
– However, unless price reclaims and holds above the resistance zone, the higher-probability outcome remains rejection and continuation of range-bound or corrective structure.
– Acceptance above 92,700 would invalidate the bearish bias and shift focus to higher liquidity targets.
Bottom Line:
– This move is best viewed as a technical rebound into resistance, not a trend shift.
– Bitcoin is reacting to liquidity mechanics while waiting for a clear macro catalyst to define the next directional leg.

Gold Is at a Decision Point — Hold the Pullback or Reject Again?MARKET BRIEFING – XAU/USD (4H)
Market State:
Gold remains in a broader bullish structure, but short-term momentum has cooled after repeated rejection from the major resistance zone. Price is currently reacting around the EMA cluster, a critical decision area.
Key Levels:
– Resistance Zone: 4,330 – 4,360
– Dynamic Support (EMA area): ~4,260 – 4,270
– Major Demand Zone: 4,170 – 4,190
Price Action:
– The impulsive rally stalled under resistance, followed by a controlled pullback no panic selling, suggesting profit-taking rather than trend failure.
– Current candles show hesitation near the fast EMA, indicating buyers are testing commitment.
– As long as price holds above the EMA structure, the trend remains constructively bullish.
Scenario Outlook
Primary Scenario – Bullish Continuation:
– Price holds above 4,260 – 4,270
– Higher low forms
– Rotation back toward 4,330 – 4,360 resistance
– A clean acceptance above this zone opens the path toward new ATH
Alternative Scenario – Deeper Reset:
– Failure to hold EMA support
– Pullback extends into 4,170 – 4,190 demand
– This would be a structural retest, not a trend reversal
Macro Alignment (Why This Setup Makes Sense)
– Fed still restrictive, but rate-cut expectations remain alive, keeping Gold structurally supported
– US yields capped, limiting downside pressure
– Ongoing geopolitical uncertainty continues to provide underlying bid
Gold is not breaking down — it’s deciding.
This pullback is either the last reload before expansion, or a healthy reset into demand.
What do you think about GOLD at this level?

Gold Breaks the Triangle - Liquidity Targets Now in Sight📌 MACRO ANALYSIS REPORT — GOLD BREAKS THE TRIANGLE, BULLISH MOMENTUM ACCELERATES
1. Global Macro Environment
- Gold is navigating a highly supportive macro landscape as global financial conditions continue shifting toward lower yields, softer inflation, and rising risk-hedging flows. The U.S. economy has shown signs of gradual cooling most recently reflected in moderating labor data and softer inflation prints reducing pressure on the Federal Reserve to maintain restrictive policy. These developments keep real yields capped, which historically strengthens gold’s demand profile.
- In addition, rising geopolitical uncertainty and fragile sovereign debt dynamics in multiple regions (Europe, Middle East, parts of Asia) are reinforcing the global bid for safe-haven assets. Central banks especially in emerging markets have continued accumulating physical gold as part of long-term reserve diversification strategies. These macro forces combine to create a structural floor beneath gold prices.
2. U.S. Dollar & Treasury Dynamics
- The dollar has struggled to maintain upside momentum as markets increasingly price in the likelihood of policy normalization in 2025. Although the USD remains broadly resilient, the loss of bullish follow-through has weakened its pressure on commodities, especially gold.
- U.S. Treasury yields also remain near key cycle lows after a sharper than expected deceleration in inflation indicators. Lower yields reduce the opportunity cost of holding non yielding assets like gold, generating a more favorable environment for sustained upside movement. Combined with slowing global growth expectations, gold benefits from these yield/dollar dynamics aligning simultaneously.
3. Liquidity Conditions & Risk Sentiment
- Global liquidity conditions have improved subtly as several major central banks shift from tightening to neutral stances. China continues to inject targeted liquidity to stabilize domestic financial markets and support manufacturing. The Bank of Japan maintains accommodative conditions, while the ECB signals caution amid slowing Eurozone demand.
- Improved liquidity typically increases investors’ willingness to allocate capital toward alternative stores of value and inflation hedges—gold remains a primary beneficiary. Risk sentiment across global equities is stable but not euphoric, leaving investors open to diversifying into metals as a defensive balance.
4. Gold’s Structural Demand
Beyond short-term macro drivers, the long-term structural demand for gold continues to intensify.
- Central bank purchases remain near multi-year highs.
- Retail demand is being reinforced by inflation concerns, currency instability in several emerging markets, and elevated geopolitical risk.
- Institutional allocation into commodity baskets is increasing after years of underweight positioning.
This sustained structural demand provides a strong macro foundation supporting gold’s technical breakout.
5. Technical Confirmation Backed by Macro
- The chart shows a clear symmetrical triangle consolidation, a pattern typically appearing during periods of macro uncertainty. The strong breakout confirms that institutional flows are aligned with the broader macro narrative of falling yields and rising demand for safe haven exposure.
The current ascending leg reflects:
- Strong trend continuation
- Aggressive dip buying
- Absence of major supply zones until 4365–4370 liquidity
This aligns perfectly with the global macro backdrop favoring further upside movement.
6. Forward-Looking Macro Risks
While the outlook is constructive, a few key risks warrant monitoring:
- A surprise rebound in U.S. inflation could revive dollar strength
- Any aggressive Fed communication could temporarily suppress gold’s momentum
- Rapid easing in geopolitical tensions could reduce haven flows
However, none of these risks have materialized convincingly, allowing gold to maintain its bullish structure.
📈 Final Outlook
Gold’s breakout is supported not only by technical strength but also by a robust macro foundation: softening yields, a stalling dollar, central bank buying, improving liquidity, and persistent geopolitical risk.
As long as price maintains its higher-low structure and remains above channel support, the path toward the next major liquidity cluster at 4365–4370 remains firmly intact.

ETH Just Flushed — Now the Market Is Being ResetMARKET BRIEFING – ETH/USD (1H)
Market State:
– Ethereum just completed a sharp impulsive sell-off, breaking previous structure and entering a range-building phase.
– The drop was aggressive, but follow-through selling has stalled price is now compressing inside a sideways box, signaling digestion, not trend continuation.
Key Levels:
– Demand / Base Zone: 2,900 – 2,920
– Range High: ~2,970 – 2,980
– Reclaim Level: ~3,040 – 3,050
– Major Resistance: ~3,100 – 3,120
Price Action Read:
– The sell-off swept liquidity below prior lows, then immediately slowed — a sell-side exhaustion move.
– Current candles show failed downside expansion and repeated rejections from the range low, typical of sideways accumulation after impulse.
Next Move:
– Expect continued sideways rotation between 2,900 – 2,980 while the market rebalances.
– A clean reclaim and acceptance above 3,040 opens room for a recovery push toward 3,100+.
– A decisive break below 2,900 would invalidate the base and reopen downside risk.
Bottom Line:
ETH is not trending it’s resetting after the flush.
Until price escapes the range with acceptance, patience and range logic dominate.
What do you think about ETH at this level?

Gold Is Compressing for a Break, Macro Forces Are Lining UpMARKET BRIEFING – XAU/USD (4H)
Market State:
– Gold is consolidating bullishly below the previous ATH at 4,380, maintaining higher lows. This price behavior aligns with a market that is absorbing supply, not distributing.
MACRO CONTEXT – WHY THE UPSIDE CASE IS STRONG
1. Fed Policy: Tightening Is No Longer the Driver
– The Fed has shifted from aggressive tightening to a data-dependent, hold-biased stance.
– Rate expectations are capped → real yields struggle to push higher, removing downside pressure on gold.
– Markets are already pricing future easing cycles, which structurally favors precious metals.
2. USD Weakness Is Structural, Not Temporary
– The U.S. Dollar has failed to extend upside despite elevated rates a classic late-cycle signal.
– Any USD bounce remains corrective while macro flows rotate toward hard assets and inflation hedges.
3. Global Risk & Geopolitics Remain Unresolved
– Ongoing geopolitical instability and fiscal uncertainty continue to support safe-haven demand.
– Central banks remain net buyers of gold, reinforcing long-term accumulation beneath price.
4. Liquidity Environment Favors Asset Inflation
– Global liquidity conditions are stabilizing after prolonged tightening.
– Gold historically performs best during liquidity inflection phases, especially when rates peak.
TECHNICALS + MACRO ALIGNMENT
Key Levels:
– Resistance / Decision Zone: 4,360 – 4,380
– Support Holding Structure: 4,300 – 4,320
– Structural Base: ~4,250
– Macro Expansion Target: 4,450 → 4,500
Price Action:
– Bullish consolidation under ATH = smart money absorption.
– Macro backdrop removes the conditions required for a sustained breakdown.
– Technical compression + macro tailwinds = high-probability expansion setup.
Next Move (High-Confidence Scenario):
– Acceptance above 4,380 triggers range expansion toward 4,450–4,500.
– As long as price holds above 4,300, pullbacks are continuation opportunities, not reversal signals.
Gold is not just technically strong — macro conditions are validating the breakout thesis.
This is not speculation; it is structure + policy + liquidity moving in the same direction.

Bitcoin Repeats a Familiar Pattern - NEXTZone Is Already Defined🔹 MARKET BRIEFING – BTC/USD (1H)
Market State:
– Bitcoin is once again trading inside a repeating range structure, similar to the previous consolidation phases marked (1 → 3).
– Price has just rebounded from the lower demand area and is now holding above short-term support, while still trading below the key moving averages, keeping the broader structure neutral-to-corrective.
Key Technical Levels:
– Demand / Base Zone: 87,800 – 88,600
– Mid-Range Reaction Level: 90,000 – 90,300
– Major Resistance / Supply Zone: 93,000 – 93,500
– The projected move toward zone (4) aligns with prior range highs and unfilled liquidity.
🌍 Macro Context – Why This Remains a Range, Not a Breakout
– Federal Reserve: Policy expectations remain stable with no immediate liquidity expansion signal. This limits impulsive upside in risk assets.
– Liquidity Conditions: The recent downside move cleared leveraged longs, enabling a technical rebound, but macro liquidity is not supportive of trend continuation yet.
– Risk Sentiment: Broader markets continue to show consolidation behavior, reinforcing mean-reversion rather than directional conviction.
Next Move:
– A controlled push toward 90,000–90,300 is likely as part of a corrective recovery.
– Extension toward the 93,000–93,500 resistance zone is possible, but this area is expected to act as a decision point, not an automatic breakout.
– Only acceptance above 93,500 would invalidate the range-based thesis and shift the bias toward trend continuation.
Bottom Line:
– Bitcoin is following a structured, repeating range pattern, not randomness.
– Until macro conditions shift, rallies should be viewed as range extensions into resistance, not confirmed trend reversals.

Bitcoin Is Trapped — But Not WeakMarket State:
– Bitcoin is trading inside a defined sideways structure, bounded by a strong support zone near 87,500–88,000 and a heavy resistance band around 90,500–91,000.
– The sharp sell-off into support was immediately absorbed, followed by a rebound — confirming buyers are defending the range, not abandoning it.
Key Levels:
– Strong Support: 87,500 – 88,000
– Range Mid / Balance: ~89,000
– Strong Resistance: 90,500 – 91,000
– Breakout Trigger: Acceptance above 91,000
Price Action Read:
– Repeated rejections at resistance and higher lows from support signal range compression.
– This is not trend continuation yet — it is market indecision resolved through time, not price.
NEXT MOVE SCENARIOS
➡️ Primary Scenario – Range Continuation
– Price oscillates between support and resistance.
– Buy reactions near 87,500–88,000, fade moves into 90,500–91,000.
➡️ Breakout Scenario (Macro-Driven)
– A decisive break and acceptance above 91,000 requires:
• Dovish Fed repricing
• USD weakness
• Broader risk-on rotation
– Only then does upside expansion become sustainable.
❌ Invalidation:
– A clean breakdown below 87,500 would shift bias to deeper corrective price discovery.

Gold Is Quiet — Because It’s About to ExplodeGOLD (XAUUSD) — 4H MARKET ANALYSIS
ATH Preparation | Accumulation → Breakout Model
1. Market Structure Overview
Gold remains in a strong bullish macro structure on the 4H timeframe. The market has repeatedly shown a clear behavioral pattern:
Impulse → Accumulation → Expansion.
At the current stage, price is consolidating just below the All-Time High (ATH), which is a classic sign of strength, not weakness. There is no aggressive rejection instead, price is being absorbed.
This confirms the market is preparing for a continuation breakout, not a reversal.
2. Accumulation & Liquidity Behavior
Multiple Accumulation Zones are visible throughout the trend:
- Each accumulation previously led to a strong impulsive leg higher.
- The current accumulation zone is forming directly below ATH, which is the most bullish location possible.
- Liquidity has already been collected on minor pullbacks, leaving little resistance overhead once ATH is breached.
This behavior signals institutional positioning, not retail speculation.
3. Key Levels to Watch
- Major Resistance:
ATH zone (~4,380 – 4,400)
- Key Support (Structure Hold):
Upper accumulation range (~4,280 – 4,300)
As long as price holds above the accumulation base, the bullish structure remains fully intact.
4. Forward Scenarios
Primary Scenario – Breakout Continuation (High Probability):
- Price holds above the accumulation zone
- Breaks and accepts above ATH
- Enters price discovery, targeting a new ATH expansion leg
Projected path:
➡ Break ATH → shallow pullback → continuation
➡ Momentum builds toward new historical highs
Alternative Scenario – Extended Accumulation (Low Risk):
- Price continues ranging just below ATH
- Further compression before the breakout
This only adds fuel to the next impulsive move.
No structural evidence currently supports a bearish reversal.
5. Market Psychology & Conclusion
- The market is not rejecting ATH — it is absorbing orders beneath it.
- Volatility compression near highs is a bullish continuation signal.
- Gold is behaving exactly as it has before every major upside expansion in this trend.
Conclusion:
Gold is not topping it is loading liquidity.
Once ATH breaks with acceptance, new all-time highs become the base case, not the exception.
The biggest moves come after patience — not prediction. Stay aligned with structure, and let the breakout pay you.

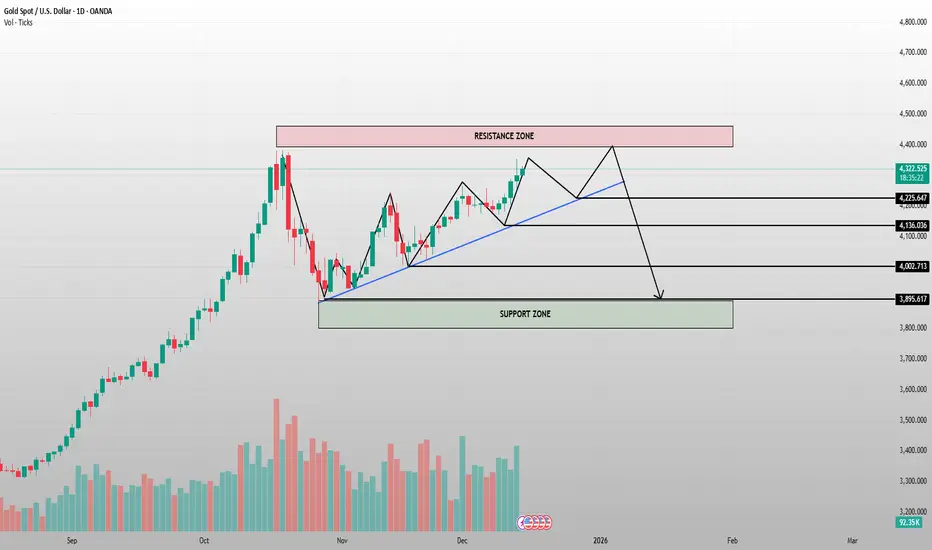
Gold at a Critical Crossroad — One Last Push Before the Trap?MARKET BRIEFING – GOLD (XAU/USD) | 1D
Market Structure:
Gold remains in a rising structure, respecting the ascending trendline. However, price is now approaching a major resistance zone, where selling pressure has previously stepped in aggressively.
Key Levels to Watch:
– Resistance Zone: 4,380 – 4,420
– Intermediate Support: 4,225 / 4,136
– Major Support Zone: 3,900 – 3,950
Price Action Read:
– As long as price holds above the rising trendline, bulls still have control.
– A final push into resistance is possible, but momentum is weakening near the highs.
– Failure to break and hold above resistance could trigger a sharp pullback toward the 4,000 handle and deeper into the support zone.
Bias:
➡️ Short-term: Cautious bullish into resistance
➡️ Medium-term: Watch for rejection → corrective move likely
Trader Focus:
This is decision time — either a clean breakout with acceptance above resistance, or a liquidity sweep followed by a downside rotation. Patience > prediction
Is Ethereum Ready to Bounce Back or Will It Fall Deeper?Ethereum (ETH/USD) – 1-Hour Chart
Current Market Structure:
- Ethereum has recently seen a sharp drop, followed by a consolidation phase.
- Price is now positioned near a key support zone, as indicated by the horizontal blue line.
- The trendline above suggests a descending resistance that could play a significant role in price action going forward.
Key Levels:
- Support Zone: $3,051.89 - The price is currently near this level, and it will be critical in determining whether Ethereum will reverse or continue lower.
- Target Zone: $3,159.56 - If Ethereum successfully bounces from the support zone, the next target is near this level, marked by the blue arrow.
- Resistance Trendline: The price is approaching a downward sloping resistance. A break above this trendline would signify a potential bullish breakout.
Probable Scenarios:
- Bounce from Support Zone: The current level looks like a potential buy zone, with a bounce toward $3,159.56 as the first target.
- Continued Rejection at Resistance: If price fails to break the resistance trendline, expect further downside action toward lower support zones.
- Breakdown of Support: If price breaks below the support zone, a move lower toward the next support level is likely, potentially extending the decline.
Market Impact:
- Short-Term Volatility: There is likely to be volatility due to the support and resistance interaction, so keeping an eye on price action near these levels is crucial.
- Upcoming Events: Be aware of external factors like economic announcements that could disrupt price movement.
Trading Strategy:
Buy at Support: Look for a confirmation of the bounce from the support zone, aiming for the target near $3,159.56.
Sell at Resistance: If price fails to break above the resistance trendline, consider shorting with a target near the next support zone.
For now, patience is recommended until the price shows clear behavior near these key levels.
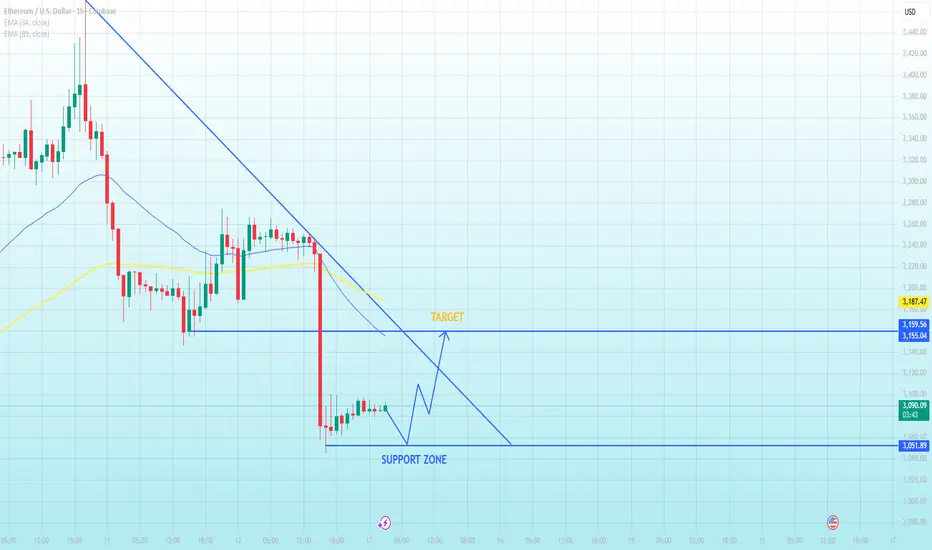
ETH/USD Just Found Key Support - Is the Next Breakout Coming?🔹 MARKET BRIEFING – ETH/USD (1H)
Market State:
– Ethereum is holding strong above the key support level around 3,050, showing bullish momentum after bouncing from this level. A retest of the support zone seems to have set up the potential for another leg higher.
Key Levels:
– Support Zone: 3,050
– Target 1: 3,100
– Target 2: 3,150
– Resistance Zone: 3,200
Next Move:
– With price respecting support at 3,050, ETH/USD is poised for another rally toward 3,100 and 3,150, aiming for a test of the 3,200 resistance.

GOLD CYCLE ANALYSIS - WAVE 5 PATTERN EMERGING1️⃣ MACRO CONTEXT — GLOBAL CONDITIONS ARE RELOADING GOLD’S NEXT MEGA WAVE
Gold is entering a multi-year super-cycle powered by a rare combination of global instability and monetary shifts:
- Ongoing geopolitical conflicts (Ukraine, Middle East) continue to elevate safe-haven demand.
- U.S. economic momentum is slowing → rising recession probability.
- The market is pricing in aggressive Fed rate cuts in the coming year → real yields cooling, a direct catalyst for gold upside.
- Central banks (China, India, Turkey) are buying gold at the fastest pace in 50 years, diversifying away from the USD.
These macro foundations perfectly align with the repetitive growth cycle pattern displayed in chart.
2️⃣ STRUCTURAL ANALYSIS — GOLD IS REPEATING ITS 5-WAVE GROWTH CYCLE
On the 1D chart, gold is moving exactly within a classic 5-wave impulsive cycle:
Wave 1: A long accumulation zone → first breakout.
Wave 2: Shallow correction, maintaining higher lows.
Wave 3:The strongest expansion phase — identical to the 2024–2025 rally.
Wave 4: A consolidation wedge + sideway pullback inside the green zone you marked.
Wave 5 (Forming Now): The next explosive leg upward, projected by the white path on your chart.
Price is currently sitting inside Accumulation Zone 4, building energy before launching the final impulsive wave.
3️⃣TRADE SCENARIO — BASED ON STRUCTURE + MACRO ALIGNMENT
🔵 Primary Scenario: Bullish Super-Cycle Continues
If price holds the ascending yellow trendline and the Zone 4 support:
- Gold completes its corrective zigzag → then accelerates into Wave 5, aiming for new all-time highs.
Macro factors reinforce this bullish scenario:
- Fed rate cuts expected → lower real yields.
- USD entering a weakening cycle.
- Geopolitical tensions remain elevated.
- Central banks increasing gold reserves aggressively.
→ This is the dominant, high-probability scenario.
🔴 Secondary Scenario: Macro Repricing Pullback
Only triggered if:
- The Fed unexpectedly turns hawkish again (low probability),
- Geopolitical tensions ease significantly (low probability).
In that case, gold may retest lower zones:
3125 → 2523, exactly as marked on your chart.
4️⃣ RISK MANAGEMENT — WHEN THE MODEL FAILS
The super-cycle view becomes invalid if:
- Daily close breaks below the green Wave 4 accumulation zone.
- U.S. bond yields spike sharply higher again.
- DXY rallies above 115.
These conditions contradict the current global macro trajectory, so the probability remains low.
5️⃣ GOLD’S 5-WAVE PATTERN IS NOT RANDOM
Each accumulation zone (1–2–3–4) shares identical behavior:
- 6–12 weeks of tight consolidation
- Breakout triggered by macro news
- Each impulsive wave larger than the previous one
This is the footprint of a long-term impulsive super-cycle, currently unfolding from 2023–2026.
Given the macro backdrop and repeated structural pattern, Wave 5 is positioned to become the strongest and most extended wave of this entire cycle.
I

Gold Is Preparing for a Deep Liquidity SweepMost traders chase the final push of wave (B) and get trapped right before the market reverses. When you understand wave structure + liquidity zones, you stop trading emotions and start trading precision.
📌 1. Market Structure
Gold has just completed a 5-wave impulsive structure (1 → 5) into the resistance zone.
Immediately after wave (5), price shifted into a corrective phase, forming leg (A) downward.
This is classic Elliott behavior: Impulsive (5 waves) → Corrective (ABC).
Current structure is entering wave (B) retracement before dropping into wave (C).
📌 2. Key Zones
Resistance Zone:
Price reacted strongly at the previous swing-high cluster where wave (5) completed — confirming heavy sell orders.
Support Zone:
The zone around wave (2) & (4) provided multiple rejections, but a break below (A) suggests this support is weakening.
Liquidity Zone (Target): 4128 – 4136
This is the major liquidity pocket where the market likely aims for a sweep during wave (C).
📌 3. Price Action
- Wave (A) formed with clear momentum down.
- Current upward leg into (B) shows weaker volume, typical of a corrective pullback.
- The projected path shows price retesting resistance before a deeper drop.
- Structure is no longer bullish — it’s transitioning into a corrective sequence.
- The dashed path is perfectly aligned with typical ABC behavior.
📌 4. Technical Confirmation
- Wave Theory: 5-wave impulse completed → ABC retracement is expected.
- Liquidity Map: Price has unfinished business at the 4128–4136 zone.
- Support Break: Wave (A) broke below the previous minor support, shifting short-term bias bearish.
- Resistance Rejection: Wave (B) is likely to fail at the previous top structure.
Everything aligns with a bearish continuation into wave (C).
📌 5. Trading Plan
🎯 SELL Setup (High probability)
Entry: 4,230 – 4,255 (top of wave B retracement)
Stop-Loss: 4,290 (above previous swing & invalidation of B)
Take Profit 1: 4,165
Take Profit 2: 4,140
Final Target: Liquidity 4128 – 4136 (wave C completion)
Why this setup is strong:
You are shorting into the end of wave B, which typically traps breakout buyers before wave C dumps sharply.

EURUSD: This Move Wasn’t Accidental…EURUSD MARKET ANALYSIS – 1H
1. Current Price Structure
- EURUSD has completed a full parabolic rounded bottom formation, pushing price back into the upper boundary of the ascending channel.
- After touching the resistance zone (1.16800), price sharply rejected and transitioned into a descending channel, signaling a shift from bullish continuation to correction.
- The recent rally lost momentum, and price is now moving inside a bearish correction channel, confirming that buyers are weakening.
- The circled area shows a failed breakout attempt, followed by strong re-entry inside the bearish channel → classic distribution signal.
2. Liquidity Zones
Resistance Liquidity (1.16800):
Price tapped this level multiple times and got rejected aggressively → liquidity above remains intact, suggesting the market is not ready for a breakout.
Support Liquidity (1.15900):
The support zone below holds significant liquidity — multiple previous wicks show repeated absorption by buyers.
Current structure indicates
Smart money is distributing near resistance and collecting liquidity for a deeper move toward support.
3. Today’s Market Scenario
🔻 Main Scenario – Bearish Correction Toward Support
The price is expected to continue moving inside the descending channel:
Multiple lower highs forming at the top of the channel.
Price likely oscillates sideways with bearish bias, forming repeated LH–LL structures.
Final target of this correction: 1.15900 (support zone).
This aligns perfectly with the red path drawn on your chart:
- Zig-zag correction
- Progressive decline
- Reaching support zone for liquidity sweep.
Unless the resistance zone is broken convincingly, bearish continuation remains the highest-probability scenario.
4. Market Psychology
The chart reflects a classic sentiment shift:
- Before reaching resistance, traders were optimistic due to the strong bullish rally (rounded bottom).
But the sharp rejection at resistance created psychological distribution, where:
-Early buyers take profits
-Late buyers get trapped
- Smart money sells into retail optimism
The descending channel represents controlled selling pressure, not panic — this is strategic distribution.
Price will typically move slowly downward, trapping breakout traders until deeper liquidity at support is reached.
This is textbook smart-money behavior:
Euphoria → Distribution → Controlled Decline → Liquidity Sweep.
5. Intraday Strategy
🔻 Short Bias (High Probability)
Trade with the correction channel.
Entry: Short at the upper boundary of the descending channel (1.16500 – 1.16600).
SL: Above mini-swing high or above channel top (≈ 1.16750).
TP1: 1.16250
TP2: 1.16050
TP3: 1.15900 (major support zone)
🔹 Conservative Strategy
Wait for price to retest 1.16500 and show rejection before shorting.
🔸 Long Setup (Low Probability)
Only consider long if:
Price breaks the descending channel
AND Retests above 1.16650 with strong bullish confirmation.
Target if breakout occurs: 1.16800 – 1.17000.

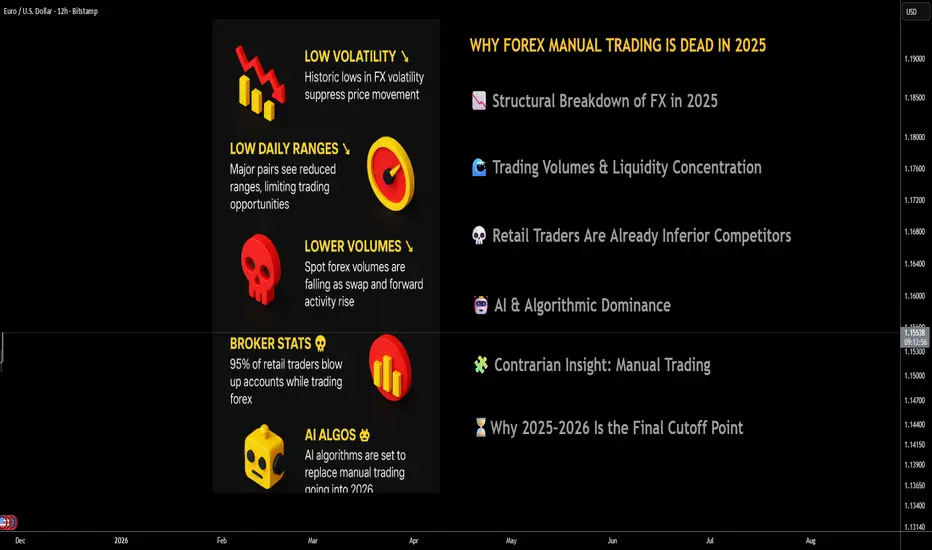
Why Manual Forex Trading Is Officially Dead 📘 Why Manual Forex Trading Is Officially Dead — And AI Will Bury It in 2026
________________________________________
1. 🚨 Executive Summary
Manual FX trading is not merely declining—it is entering its terminal phase. As of 2025, the confluence of record-low volatility, crushed daily ranges, shrinking spot volumes, and hyper-efficient AI execution frameworks has dismantled the edge discretionary traders once possessed.
Regulators report that 74–89% of retail CFD/FX traders lose money, with internal broker statistics showing even higher failure rates—often pushing the informal industry estimate of 90–95% account blow-up rates. The structural market environment now exacerbates those figures: less movement, tighter spreads, and faster AI-driven price formation leave no oxygen for manual decision-making.
The verdict is clear: manual FX trading is no longer a competitive activity—it's an anachronism.
________________________________________
2. 📉 Structural Breakdown of FX in 2025: A Market That No Longer Moves
The fundamental requirement for profitable manual FX trading—price movement—has been suppressed. According to multiple 2023–2024 analyses (Reuters, BIS), FX markets entered a multi-year period of historically subdued volatility, with the CVIX (Currency Volatility Index) sitting near multi-cycle lows.
Major pairs like EUR/USD and USD/JPY are posting 1/3 to 1/2 of their historical daily ranges, compressing intraday opportunity. What used to be 80–120 pip swings are now 30–50 pip oscillations dominated by micro-structure noise rather than directional moves.
In this environment, manual traders have insufficient statistical runway to generate returns, while AI systems can still monetize tiny dislocations at millisecond speed.
________________________________________
3. 🌊 Trading Volumes & Liquidity Concentration: The Game Has Moved On
The 2022 BIS Triennial Survey already documented a shift: spot FX volumes stagnated while swap and forward activity increased, driven by hedging and treasury optimization rather than speculative flows.
By 2025, institutional venues show continued softness in spot volumes, and even the leading eFX platforms reported lower activity during prolonged volatility droughts. This matters because:
• Lower volume = fewer sustained directional trends
• More volume concentrated among algos = fewer exploitable inefficiencies
• Liquidity providers internalize flow before it ever becomes visible to retail charts
Manual trading can’t survive structural liquidity centralization reinforced by machine execution.
________________________________________
4. 💀 Retail Traders Are Already Inferior Competitors and the Data Shows It
Manual traders are not just competing against the market—they are competing against:
• Prime brokers running internal AI risk engines
• HFT firms reading order books at microsecond resolution
• Banks using reinforcement-learning execution algos
ESMA’s regulatory disclosures show 74–89% of retail FX/CFD accounts lose money, but internal broker studies often cite 90–95% destruction rates, especially when volatility is muted.
The brutal truth: manual traders blow up because the game is no longer designed for human reaction speed or intuition.
________________________________________
5. 🤖 AI & Algorithmic Dominance: The 2026 Regime Shift
By 2026, FX will be AI-first, not human-first. Institutional adoption of AI execution is growing double digits annually (per GMI, GrandView), and retail brokers are already rolling out AI-assisted trade generation, AI signal clusters, and AI risk models.
AI advantages include:
• Predictive ability using LSTM/transformers trained on terabytes of tick data
• Zero-latency execution across fragmented liquidity pools
• Ability to profit in low-volatility regimes via microstructure edge
• Adaptive models that rewrite themselves every 24 hours
• No fatigue, no bias, no emotional degradation
In contrast, manual traders operate on slow cognition, subjective pattern recognition, and outdated chart heuristics. This is not a fair fight. Manual trading is no longer a skill—it's an obsolete hobby.
________________________________________
6. 🧩 Contrarian Insight: Manual Trading Isn't Just Dying—It’s Being Engineered Out
Here are non-obvious, high-conviction insights that institutional investors should consider:
(1) Market makers WANT low volatility
Low volatility increases internalization efficiency and reduces hedging costs. Human traders thrive on chaos; AI thrives on order. Who does the system favor?
(2) AI reduces liquidity available to humans
Liquidity is increasingly “dark” inside internal matching engines, meaning price discovery happens before retail traders ever see the candle.
(3) Manual trading can’t survive the “fractionalization” of edge
AI doesn’t need large moves—it monetizes micro-micro-inefficiencies in ways humans never could.
(4) Spread compression kills human R:R ratios
With 0.1–0.3 pip spreads on majors, AI can scalp micro-spreads—humans cannot.
(5) Behavioral inefficiencies have been minimized
Classic manual strategies—breakouts, fib levels, candlestick patterns—worked because humans created predictable behavioral cycles.
Now? AI models detect and arbitrage those behaviors instantly.
The most contrarian conclusion?
Manual trading didn’t die naturally—the market evolved to eliminate it.
________________________________________
7. ⏳Why 2025–2026 Is the Final Cutoff Point
Three forces collide in this window:
1. Volatility compression (structure-driven, not temporary)
2. AI adoption exceeding human adaptability
3. Retail traders facing the worst statistical environment in 15 years
This is the first time in FX history where:
• Human intuition has zero measurable edge
• AI dominance is irreversible
• Market conditions structurally reject manual trading
The past cycles always argued “vol will return.”
In 2025–2026, that is no longer a credible investment thesis.
________________________________________
8. 📈 Implications for Investors & Brokers
Investors should allocate to:
• AI-driven FX funds
• ML-enhanced macro strategies
• Data infrastructure feeding predictive FX models
Brokers should:
• Pivot to AI-based trading tools
• Monetize analytics subscriptions
• Shift away from promoting discretionary trading education
The firms that expect a retail manual trading revival will be structurally misaligned with market evolution.
________________________________________
________________________________________
🔥 Final Conclusion: Manual Traders Will Be Left Behind in 2026
The logic is now overwhelming:
low volatility + low ranges + reduced volumes + AI dominance = endgame for manual FX trading.
Human discretionary trading cannot survive in a marketplace designed for—and increasingly ruled by—data-driven, sub-millisecond, self-learning AI engines.
Manual traders in 2026 will not fight the bots.
They will simply be trading inside a system architected by the bots, reacting slowly to patterns that no longer exist.
The era is over.
The market has moved on.