GBPAUD Expected Growth! BUY!
My dear friends,
My technical analysis for GBPAUD is below:
The market is trading on 2.0072 pivot level.
Bias - Bullish
Technical Indicators: Both Super Trend & Pivot HL indicate a highly probable Bullish continuation.
Target - 2.0141
About Used Indicators:
A pivot point is a technical analysis indicator, or calculations, used to determine the overall trend of the market over different time frames.
Disclosure: I am part of Trade Nation's Influencer program and receive a monthly fee for using their TradingView charts in my analysis.
———————————
WISH YOU ALL LUCK
Trading

The mistake that kept me broke for 2 years!Hey @TradingView Community, I want to tell you something personal...
For two years, I was stuck.
I kept losing trades and I couldn’t figure out why.
It wasn’t because I didn’t work hard.
It wasn’t because I didn’t study the charts.
It was because I was following a trading style that looked smart on paper but failed in real life.
Every week, I waited for that ONE “perfect” setup.
I told myself, “This is how real traders do it.”
But most weeks, nothing came.
And when I finally saw something, I was either late or scared to take it.
Then came the worst part.
After waiting for days and missing good trades, I got frustrated.
So I started forcing trades just to feel like I was doing something.
And of course, I lost even more.
It became a loop:
Waiting → Missing → FOMO → Losing.
Even more? I traded based on emotions and started to add to losing positions! And of course, more losses.
It was too complicated, too slow, and not made for real traders like us.
And of course, everything was built on a foundation of simple to advanced chart patterns and Smart Money Concepts (SMC), candlestick patterns, Elliott waves... I’ve experimented with nearly every well-known form of technical analysis you can think of.
After thousands of hours of studying and backtesting the charts, we discovered a powerful and consistent edge rooted in Wave Analysis.
From our research and findings, we developed our own unique system, the We Trade Waves Wave Analysis Concept. You can see the proven results on our website.
But we also realized that analysis is only one part of the equation, the most important part is building the right mindset and finding your own balance, all while following a proven trading system like the one we’ve built and refined today.
We created a trading system you can follow in a simple and calm way.
You need a working trading system that takes about 15 to 30 minutes a day, and it actually works.
The system that helped me get my time, focus, and money back.
It's the same We Trade Waves system we are teaching to We Trade Waves members now.
And don't forget WTW 4 Golden rules!
1) Do not jump in
2) Do not over risk/trade
3) Do not trade without Stop Loss
4) Never ever add to a losing position!
Take with care,
Alain M(Coach)
WTW Team
TVC:GOLD NYSE:DOW SP:SPX NASDAQ:NDX

#AN028: London Challenges European Union, Halts Defense Funds
The news that the United Kingdom has decided not to pay the €6.75 billion earmarked for the new European Defense Fund sends a clear political and economic signal to Brussels. Hello, I'm Andrea Russo, an independent Forex trader and prop trader with $200,000 in capital under management. Thank you in advance for your time.
Behind this decision is not just a question of money, but a precise strategy of industrial and military independence aimed at reaffirming British sovereignty post-Brexit.
💼 Economic and geopolitical implications
The European fund was designed to finance joint defense and technological projects, reducing dependence on the United States and strengthening the EU's autonomous military capacity.
By refusing to participate, London is sending a two-pronged message:
Economic: Priority is given to its own budgets and its national defense industry, which has seen a strong revival in the last two years with orders from Ukraine, the Middle East, and NATO countries.
Strategic: The United Kingdom does not intend to bind itself to European defense plans that could compete with NATO, of which it remains a key member.
📉 Market Impact
In currency markets, the news tends to temporarily strengthen the pound sterling (GBP), as it is perceived as a gesture of autonomy and fiscal stability—less public spending in a context of tensions over EU budgets.
However, the effect could be short-lived: the decision deepens the rift with Brussels, fueling political risks and potential trade frictions, especially if the EU reacts with restrictive measures on joint military contracts or exports.
On the equity front, British defense stocks (BAE Systems, Rolls-Royce Defence) could benefit from "patriotic" sentiment and increased domestic orders.
On the bond market, however, the effect is neutral: the move does not change the sovereign rating but reinforces the idea of the pound as a regional safe haven currency in a Europe torn between austerity and defense spending.
🌍 Risks for the EU
For Brussels, London's lack of input complicates the construction of a common defense policy:
less funding for shared industrial programs,
greater dependence on Germany and France,
and a perception of European institutional instability, a factor that tends to weaken the euro (EUR).

LiamTrading – XAUUSD H2 | USD strengthens again, gold ...LiamTrading – XAUUSD H2 | USD strengthens again, gold consolidates in an upward channel; waiting for a correction to 4090/4041 – breaking 4145 confirms further rise
Quick Context: USD recovery causes gold to move sideways during the Asian session. Prices are moving within an upward channel, touching the upper trendline and reacting around 4100, without forming a lower low. To confirm the continuation of the upward momentum, 4145 needs to be broken; otherwise, prioritize the technical correction scenario to liquidity zones.
Technical Analysis (Volume Profile • Trendline • S/R • Fibonacci)
Channel & Trendline: Channel top coincides with 4135–4145 → likely to see profit-taking pressure. Maintaining the lower edge of the channel ~4085–4090 keeps the upward structure valid.
Liquidity & FVG:
Liquidity 4090: price pull/volume attraction zone before choosing a direction.
Fibonacci Retracement + old resistance ~4041–4043: strong confluence for a bounce if a deep correction occurs.
Main Resistance: 4130–4135 (retest channel top), 4145 (pivot confirming rise), 4200 (sell scalp area if clear rejection appears).
Main Support: 4084–4086 (channel edge/liq), 4041–4043 (Fib + S/R), deeper 4020 is a defensive level for buyers.
Trading Scenarios (optimized for mobile reading)
Scenario 1 – Buy shallow pullback (trend-following priority)
Entry: 4084–4086
SL: 4078
TP: 4098 → 4112 → 4135 → 4160
Suggestion: Wait for a rejection candle at 4090 or an M15 reversal signal before executing.
Scenario 2 – Buy deep (Fib + S/R)
Entry: 4041–4043
SL: 4036
TP: 4056 → 4072 → 4095 → 4120
Suggestion: Prioritize when price fills the gap and leaves a clear lower wick.
Scenario 3 – Sell scalp at resistance (counter-trend)
Entry: 4130–4132
SL: 4138
TP: 4112 → 4100 → 4088 → 4060
Note: Only quick scalps; abandon if H1/H2 closes strongly above 4145.
Bonus – Sell scalp 4200
Condition: Clear rejection appears on smaller frames.
SL: above the nearest new peak.
Reference TP: 4185 → 4166 → 4145.
Risk Management & Invalidation
Short-term bullish bias remains valid when price holds above 4085–4090.
H2 closes above 4145 → prioritize buying on breakout, limit all sell orders.
H2 closes below 4036 → risk of deeper test around 4020.
Risk per trade 0.5–1%, move SL to breakeven at +1R, do not average down against the trend.
Which price zone do you find noteworthy today? Comment below & hit Follow on LiamTrading channel for the earliest updates.

a BuySide QuickScalp #GBPJPY 📌 Market Insight: {#GBPJPY }
⚠️ Risk Assessment: {High}
🚀 Approach:
Not a bad Structure , we need momentum first then a nice LTF entry sign .
#Ash_TheTrader #Forex #GBPJPY #MarketAnalysis #TradingSetup #RiskManagement #GOLD #Scalper #NQ #EURUSD

Gold price analysis todayXAUUSD Update — Hold the structure, wait for a quality BUY setup
Currently, the gold chart has no major structural changes — the market is in a correction phase at an important resistance zone. This is a “consolidation” phase before the next trend becomes more obvious, so the priority is to be patient and wait for a high probability setup.
If you are holding a SELL position from the resistance zone, the current strategy is to hold the order and manage profits — wait for a reaction at the support zones to decide to close/open more. For those looking for BUY opportunities, wait for signs of price rejection (rejection / wick / bullish price action) at the indicated support zone before entering the order.
Important zone: 4075 — 4031 (support zone to find BUY signal)
Strategy: Enter BUY when there is a clear price rejection signal + volume/price action reaction.
Target: 4300
Risk management: stoploss placed below support zone if price action breaks and closes deep below.

$SPY $SPX Scenarios — Wednesday, Nov 12, 2025🔮 AMEX:SPY SP:SPX Scenarios — Wednesday, Nov 12, 2025 🔮
🌍 Market-Moving Headlines
💬 Fed marathon day: Six Fed officials speak across the day, led by Williams, Waller, and Bostic — giving markets multiple reads on the Fed’s reaction to soft labor data and upcoming inflation prints.
📉 Policy sensitivity rising: With no major macro releases this week, investors are hypersensitive to tone shifts in Fed commentary — especially regarding rate-cut timing and balance sheet guidance.
🧩 Positioning churn: After a light Tuesday session, liquidity normalizes as equities digest global risk appetite and pre-CPI setups.
📊 Key Data and Events (ET)
⏰ 9:20 AM — John Williams (NY Fed)
⏰ 10:00 AM — Anna Paulson (Philadelphia Fed)
⏰ 10:20 AM — Chris Waller (Fed Governor)
⏰ 12:15 PM — Raphael Bostic (Atlanta Fed)
⏰ 12:30 PM — Stephen Miran (Fed Governor)
⏰ 4:00 PM — Susan Collins (Boston Fed)
⚠️ Note:
No economic data releases today — markets will key off Fed tone and Treasury yield movement ahead of Thursday’s CPI and jobless claims (both still at risk of delay).
⚠️ Disclaimer: Educational and informational only — not financial advice.
📌 #SPY #SPX #trading #Fed #Williams #Waller #Bostic #Miran #Collins #macro #inflation #yields #markets

GBPCAD: Price Cross Below H1 ATLKey Observations
On the D1 TF, price is showing a weak bearish trend
EMA20 barely crossed below EMA60, however, price is showing more inside bars than what I'd like to see
On the H1 TF, price crossed below the ATL
Price is also accelerating away from the EMA band

EURJPY PROFITS Eurjpy recap trade, it’s hit (TAKE PROFIT) and now can relax and what for what’s to come next but shall keep following the trend

XAU/USD | Watch Gold at $4100 – Pullback or Continuation Ahead?By analyzing the Gold chart on the 2-hour timeframe, we can see that after the last analysis, the price dropped from $3997 to $3984, then quickly found strong demand and started a powerful rally, breaking the $4040 resistance.
At the moment, Gold has reached the $4100 zone. A short-term pullback from this level is likely, but after a brief correction, I expect the uptrend to continue. The next bullish targets are $4140, $4156, and $4162.
Please support me with your likes and comments to motivate me to share more analysis with you and share your opinion about the possible trend of this chart with me !
Best Regards , Arman Shaban

GOLD BOUGHT XAUUSDGold recap , gold has hit (take profit) simply by following the trend and trading simple , I now expect it to have a temporary price rest before it can raise and continue its upward momentum

EURUSD REBOUND AHEAD|LONG|
✅EURUSD broke structure to the upside, reclaiming a key demand block after sweeping sell-side liquidity. Price may continue expanding toward the next buy-side imbalance. Time Frame 3H.
LONG🚀
✅Like and subscribe to never miss a new idea!✅

CADCHF STRONG REJECTION|LONG|
✅CADCHF swept liquidity beneath the previous swing low and is now reacting from a clean demand block, hinting at a possible short-term reversal toward internal range liquidity. Time Frame 3H.
LONG🚀
✅Like and subscribe to never miss a new idea!✅

10 Stocks READY to EXPLODE!🔥 10 STOCKS READY TO EXPLODE! 🔥
NYSE:LMND , NYSE:FUBO , NASDAQ:GRAB , NYSE:PATH + 6 more primed setups. 🚀
Watch before they run 👇
Are you in any of these trades/ investments?

NZD-CAD Free Signal! Buy!
Hello,Traders!
NZDCAD is reacting within a premium zone after filling imbalance and tapping into a horizontal supply area. The move shows potential redistribution for a leg higher.
---------------------
Stop Loss: 0.7955
Take Profit: 0.7905
Entry: 0.7925
Time Frame: 2H
---------------------
Sell!
Comment and subscribe to help us grow!
Check out other forecasts below too!
Disclosure: I am part of Trade Nation's Influencer program and receive a monthly fee for using their TradingView charts in my analysis.

EURJPY FREE SIGNAL|SHORT|
✅EURJPY shows price delivery into a premium area, mitigating a clear supply level while forming bearish order flow. Short-term target sits below the recent internal range low. Time Frame 3H.
—————————
Entry: 178.640
Stop Loss: 178.900
Take Profit: 178.150
—————————
SHORT🔥
✅Like and subscribe to never miss a new idea!✅

EUR-AUD Local Short! Sell!
Hello,Traders!
EURAUD is trading inside a premium range, rejecting from a horizontal supply area with strong bearish reaction and clean imbalance left below—suggesting a potential continuation lower. Time Frame 2H.
Sell!
Comment and subscribe to help us grow!
Check out other forecasts below too!
Disclosure: I am part of Trade Nation's Influencer program and receive a monthly fee for using their TradingView charts in my analysis.

EURCHF LOCAL LONG|
✅EURCHF tapped into a clean demand zone, sweeping liquidity below previous lows before showing bullish displacement. A retracement could now aim for the imbalance zone overhead. Time Frame 3H.
LONG🚀
✅Like and subscribe to never miss a new idea!✅

USD-CHF Bullish Rebound! Buy!
Hello,Traders!
USDCHF is showing reaction off a key demand reaccumulation block after a strong displacement move, hinting at potential short-term retracement toward the inefficiency above. Time Frame 4H.
Buy!
Comment and subscribe to help us grow!
Check out other forecasts below too!
Disclosure: I am part of Trade Nation's Influencer program and receive a monthly fee for using their TradingView charts in my analysis.

Backtesting on TradingViewBased on the massive feedback from our previous article about backtesting we decided to make a follow up on how to backtest your strategy.
Every trader talks about strategy.
Few actually test it.
Backtesting is where ideas meet data — and TradingView makes it surprisingly simple.
Whether you code your own system or use built-in tools, backtesting shows you how your logic performs before you risk a single dollar.
1. Open the Strategy Tester
Start by opening the chart of the asset you want to test.
Click “Strategy Tester” at the bottom of the screen.
This activates TradingView’s built-in engine that simulates your system’s historical trades automatically.
You’ll see three tabs appear:
Overview: a summary of your results.
Performance Summary: key stats like profit, drawdown, and win rate.
List of Trades: every single historical trade your strategy executed.
2. Load or Create a Strategy
Go to the Indicators & Strategies tab.
TradingView separates indicators from strategies — only strategies can trigger trades for backtesting!
You have two options:
Use a built-in or public strategy: like “MACD Strategy” or “Moving Average Crossover.”
Paste your own Pine Script strategy: under “Pine Editor,” then click “Add to Chart.”
Once applied, TradingView automatically calculates historical trades based on your logic.
Tip: Indicators are for signals, strategies are for testing execution.
3. Adjust the Test Parameters
To make your test realistic, click the ⚙️ icon next to your strategy name.
In the Properties tab, you can define:
Initial capital (e.g. $10,000)
Position size (fixed or percent-based)
Commission and slippage
Pyramiding (how many positions can stack)
Then set your date range in the Strategy Tester — for example, test from 01-01-2022 to 01-01-2024.
The goal is to simulate what your system would have done under real conditions.
4. Analyze the Results
Once the test runs, TradingView gives you a detailed breakdown:
Net Profit (%) — your total gain or loss.
Max Drawdown — your biggest loss from peak to trough.
Win Rate & Profit Factor — how often you win and how much you win versus lose.
Average Trade — the mean result per trade.
Equity Curve — how your balance evolved over time.
Scroll through the List of Trades to see how each entry and exit behaved.
If you spot clusters of losses, note the pattern — that’s where improvements start.
This is the part where you analyze and think why did a trade fail and how can I avoid it.
TradingView also enables you to export data in excel so its super easy to analyze and look for improvement.
5. Refine and Forward-Test
Once you’ve seen how your system performs historically, make small adjustments.
Change one parameter at a time — like EMA length, RSI threshold, or stop-loss distance — and rerun the test.
When you find consistent results across timeframes or markets, move to paper trading mode.
Forward-testing confirms your backtest logic under real conditions, including live volatility and execution timing.
If your live and backtested results align closely, you’ve built something solid and you are ready to make money.
A big tip here, even a small thing such as a change in stop loss or timeframe change from 15 minutes to 14 minutes can make a huge difference so try out different conditions.
TRUMP Update📊 TRUMP Update
TRUMP is testing the blue support level 🔵
If it breaks below, it could confirm a bearish setup 📉
The first short target would be the green line level 🟢

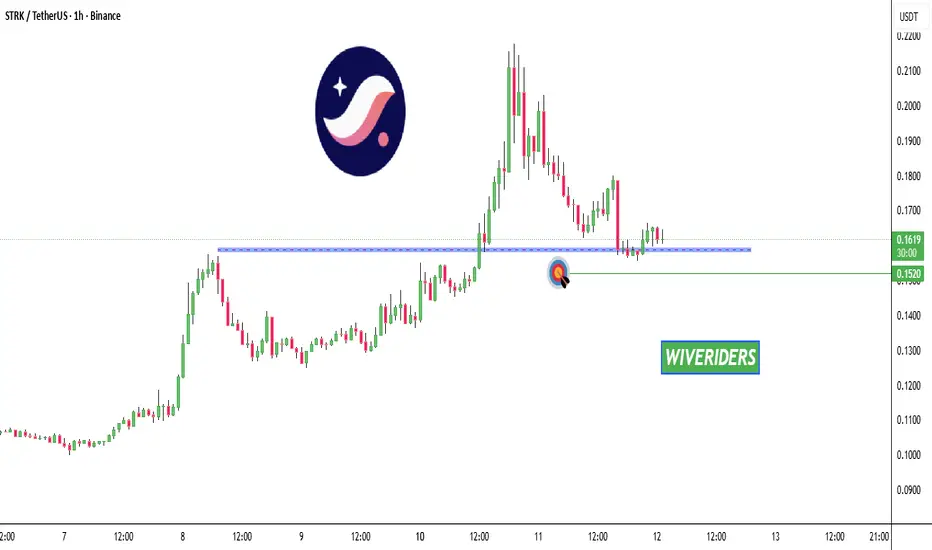
$STRK Update📊 NASDAQ:STRK Update
NASDAQ:STRK is testing the blue support level 🔵
If it breaks below, it could confirm a bearish setup 📉
The first short target would be the green line level 🟢
$ZEC Update📊 CRYPTOCAP:ZEC Update
CRYPTOCAP:ZEC is testing the blue support level 🔵
If it breaks below, it could confirm a bearish setup 📉
The first short target would be the green line level 🟢
