JELLYJELLY Update🚨📊 JELLYJELLY Update
JELLYJELLY has also formed a new resistance zone in red 🔴.
This level is now acting as a strong ceiling,
and price must break out above this red resistance
to show any real bullish momentum again.
Until that breakout happens,
sellers remain in control and upside stays limited.
Trading

US30 FREE SIGNAL|LONG|
✅US30 taps a key demand zone after a clean liquidity sweep, signaling potential displacement higher. If bullish orderflow sustains, a premium retracement toward the target zone is likely.
—————————
Entry: 46,590
Stop Loss: 46,408
Take Profit: 46,808
Time Frame: 4H
—————————
LONG🚀
✅Like and subscribe to never miss a new idea!✅

SYRUP Update🚨📊 SYRUP Update
SYRUP has also formed a new resistance zone in red 🔴.
This level is now acting as a strong ceiling,
and price must break out above this red resistance
to show any real bullish momentum again.
Until that breakout happens,
sellers remain in control and upside stays limited.

BITCOIN Free Signal! Buy!
Hello,Traders!
BITCOIN taps into a major higher-timeframe demand area, reclaiming structure and sweeping downside liquidity. A bullish reaction here may drive price toward the next internal range high.
--------------------
Stop Loss: 88,783$
Take Profit: 94,407$
Entry Level: 91,500$
Time Frame: 1D
--------------------
Buy!
Comment and subscribe to help us grow!
Check out other forecasts below too!
Disclosure: I am part of Trade Nation's Influencer program and receive a monthly fee for using their TradingView charts in my analysis.

AIA Update🚨📊 AIA Update
AIA has also formed a new resistance zone in red 🔴.
This level is now acting as a strong ceiling,
and price must break out above this red resistance
to show any real bullish momentum again.
Until that breakout happens,
sellers remain in control and upside stays limited.

TEL Update🚨📊 TEL Update
TEL has also formed a new resistance zone in red 🔴.
This level is now acting as a strong ceiling,
and price must break out above this red resistance
to show any real bullish momentum again.
Until that breakout happens,
sellers remain in control and upside stays limited.

ICP Update🚨📊 ICP Update
ICP has also formed a new resistance zone in red 🔴.
This level is now acting as a strong ceiling,
and price must break out above this red resistance
to show any real bullish momentum again.
Until that breakout happens,
sellers remain in control and upside stays limited.
👉 Get real-time trade alerts:

FIL Update🚨📊 FIL Update
FIL has formed a new resistance zone in red 🔴.
This level is now acting as a strong ceiling,
and price must break out above this red resistance
to show any real bullish momentum again.
Until that breakout happens,
sellers remain in control and upside stays limited.

TESLA FREE SIGANL|SHORT|
✅TESLA Price reacts off a premium-priced supply block, showing bearish displacement and a clean break in structure. Retracement into the imbalance may fuel continuation lower.
—————————
Entry: 408.98$
Stop Loss: 424.00$
Take Profit: 392.00$
Time Frame: 4H
—————————
SHORT🔥
✅Like and subscribe to never miss a new idea!✅

NATGAS Bearish Breakout! Sell!
Hello,Traders!
NATGAS broke down from the bearish wedge, signalling displacement and a shift in order flow. After sweeping internal liquidity, price is expected to expand lower toward the marked target demand zone. Time Frame 4H.
Sell!
Comment and subscribe to help us grow!
Check out other forecasts below too!
Disclosure: I am part of Trade Nation's Influencer program and receive a monthly fee for using their TradingView charts in my analysis.

GOLD BEARISH BREAKOUT|SHORT|
✅ XAUUSD broke cleanly below the 4H supply after taking buy-side liquidity. With displacement confirming bearish order flow, price is expected to target the sell-side liquidity pool near the marked zone. Time Frame 4H.
LONG🚀
✅Like and subscribe to never miss a new idea!✅

NZD-CHF Bearish Bias! Sell!
Hello,Traders!
NZDCHF already pulled back into the horizontal supply, filling imbalance and grabbing buy-side liquidity. With distribution forming, price is expected to extend lower toward the target sell-side liquidity zone. Time Frame 2H.
Sell!
Comment and subscribe to help us grow!
Check out other forecasts below too!
Disclosure: I am part of Trade Nation's Influencer program and receive a monthly fee for using their TradingView charts in my analysis.

AUDCAD RISKY LONG|
✅AUDCAD is sliding into a clean demand zone where liquidity rests below recent lows. Expect a reaction as price taps this imbalance. Targeting a retracement toward the marked FVG before continuation. Time Frame 2H.
LONG🚀
✅Like and subscribe to never miss a new idea!✅

AUD-JPY Local Short! Sell!
Hello,Traders!
AUDJPY reacts from a premium supply zone, showing clear distribution and a shift in structure. Liquidity below remains the next draw as bearish orderflow continues. Time Frame 4H.
Sell!
Comment and subscribe to help us grow!
Check out other forecasts below too!
Disclosure: I am part of Trade Nation's Influencer program and receive a monthly fee for using their TradingView charts in my analysis.

#041: USD/SGD Long Investment Opportunity
A technical structure is forming in the USD/SGD pair, indicating a potential resumption of bullish momentum after the corrective phase that began at the highs earlier this month. Hello, I'm Forex Trader Andrea Russo, author of the book "The Institutional Code of Forex, 14 Steps to Read the Markets Like a Bank," available on Amazon. I'm an independent trader and money manager, and I thank you in advance for your time.
The price has completed a sequence of lower highs and lower lows, but in recent sessions, it has shown a slowdown in bearish pressure and increased reactivity in the 1.3010–1.3020 range, an area previously used as an entry point by institutional traders.
The proposed trade is structured according to a reaccumulation logic after liquidity has been raised, with a BUY LIMIT position at a technically significant level.
The price has broken the descending trendline that guided the correction phase and is currently building a support base within the identified trading range. The decline towards 1.30126 represents, in this configuration, a classic institutional pullback into a previously inefficient area of demand.

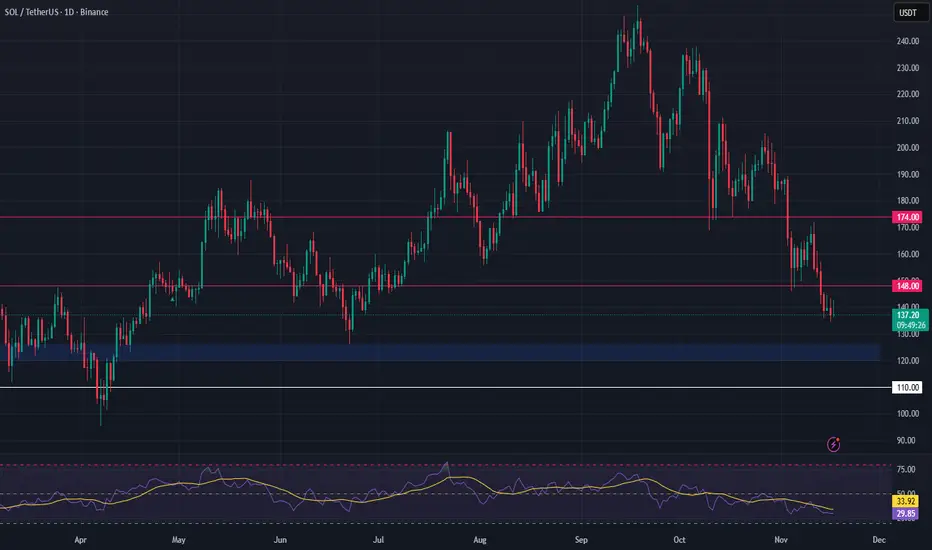
SOL – Watching for a Higher-Timeframe Reversal SetupSolana has been pulling back after its recent rally, and we’re looking for price to retest the next major support zone. A successful hold here could set the stage for a higher-low formation and a continuation of the broader uptrend — offering a solid long spot opportunity.
Trade Setup:
• Entry Zone: $120 – $126
• Take Profit Targets:
🥇 $148
🥈 $174
• Stop Loss: $110
When Crypto Actually MovesCrypto trades around the clock, but the market doesn’t behave the same way at every hour. Volume, liquidity, and volatility cluster around predictable windows, and those windows shape how setups form and how price reacts. When you understand these shifts, you stop taking trades randomly and start aligning execution with the moments when the market truly moves.
Why Sessions Matter
Even though crypto never sleeps, human traders and institutional desks still operate in cycles. Liquidity providers adjust during business hours. Market makers re-balance at session opens. Macro news is released on a fixed schedule. These patterns create recurring volatility signatures.
Ignoring sessions means you treat every candle as equal. Understanding sessions means you add a layer of context that improves timing, risk control, and win rate.
Asia Session (00:00–06:00 UTC)
The Asia window tends to be slower and more range-bound.
Characteristics include:
– Moderate liquidity
– Clean consolidations
– Accumulation before Europe
– Fewer impulsive moves unless driven by news from Asia-Pacific regions
This period often sets the initial range of the day. Liquidity begins to cluster above highs and below lows, creating the conditions for later sweeps.
Europe Session (07:00–12:00 UTC)
Liquidity expands significantly as London opens. You often see the first engineered move of the day.
Key behaviors:
– Early sweeps of the Asia range
– Strong breakouts from overnight compression
– Directional push before New York volatility
This session frequently defines the directional bias into US hours. It’s a prime window for structured setups because market participation rises sharply.
US Session (13:00–20:00 UTC)
This is the most active window. The highest liquidity and most decisive moves occur here.
Typical features:
– Strong continuation or full reversal of the London move
– Reaction to economic news
– Trend acceleration during peak overlap hours
This is where major breakouts, deep liquidity hunts, and high-powered moves happen. If you trade momentum or breakout strategies, this session offers the cleanest conditions.
Weekend Behavior
Weekends operate on thin liquidity. Order books are lighter, market makers are less active, and volatility behaves differently.
Common outcomes:
– Sharp wicks that violate structure
– Sudden spikes without follow-through
– False breakouts with immediate reversals
Weekend moves often distort technicals. They can be useful for narrative-driven positions but carry higher risk for intraday traders.
How to Integrate Sessions Into Your Trading
Use sessions to filter when you participate and when you avoid noise.
Practical adjustments:
– Execute momentum setups during Europe or US hours.
– Treat Asia session as a range-building phase suitable for scouting zones.
– Avoid taking aggressive positions during weekend chop.
– Use session opens as key decision points for liquidity grabs.
When you layer session timing on top of structure, you refine entries and eliminate trades that lack the environment for follow-through.
The Strategic Advantage of Session Awareness
Session timing gives you clarity. You start anticipating where liquidity is likely to be engineered, where volume will enter, and when the market is likely to trend or stall.
This transforms your approach.
Instead of reacting to candles, you plan around expected volatility cycles.
Instead of forcing trades, you wait for session transitions that historically produce reliable movement.

Liquidity Basics: Equal Highs/Lows, Inefficiencies & POIsPrice doesn’t move randomly, it is always attracted towards liquidity.
Every wick, breakout, and fake-out tells a story of orders being filled.
If you can read where those orders are hiding, you stop trading noise and start trading intention.
Equal Highs & Lows — The Obvious Targets
Retail traders love to mark equal highs and lows as “strong support/resistance.”
Smart money sees them as fuel.
Above equal highs = cluster of buy stops.
Below equal lows = cluster of sell stops.
When price reaches them, it’s a collection of accumulated liquidity as a main driver behind that move.
Inefficiencies — Fair Value Gaps
Also known as Fair Value Gaps (FVGs) or imbalances, these occur when price moves too quickly, leaving unfilled orders behind.
Price often revisits these zones later to rebalance.
Spot them between large candles with no overlap, they often mark where institutions filled partial orders.
Points of Interest (POIs)
POIs are areas where liquidity and inefficiency converge , the zones of intent.
Look for:
Liquidity sweep of equal highs/lows
Return to imbalance or order block
Shift in market structure
That’s where high-probability setups occur.
Note:
Stop chasing every candle.
Start mapping why price moves.
Equal highs and inefficiencies are magnets, with proper plan and confluence this can represent your strong side of trading.

EURUSD Sellers In Panic! BUY!
My dear subscribers,
EURUSD looks like it will make a good move, and here are the details:
The market is trading on 1.1601 pivot level.
Bias - Bullish
My Stop Loss - 1.1593
Technical Indicators: Both Super Trend & Pivot HL indicate a highly probable Bullish continuation.
Target - 1.1617
About Used Indicators:
The average true range (ATR) plays an important role in 'Supertrend' as the indicator uses ATR to calculate its value. The ATR indicator signals the degree of price volatility.
Disclosure: I am part of Trade Nation's Influencer program and receive a monthly fee for using their TradingView charts in my analysis.
———————————
WISH YOU ALL LUCK

EURCHF: Another Selling Opportunity 🇪🇺🇨🇭
EURCHF will most likely drop after a test of a major intraday/daily
resistance cluster.
The pair completed a consolidation on that, forming a local
selling imbalance.
I expect a bearish movement at least to 0.92 level.
❤️Please, support my work with like, thank you!❤️
I am part of Trade Nation's Influencer program and receive a monthly fee for using their TradingView charts in my analysis.

SILVER BEARS WILL DOMINATE THE MARKET|SHORT
SILVER SIGNAL
Trade Direction: short
Entry Level: 5,103.6
Target Level: 4,498.0
Stop Loss: 5,504.6
RISK PROFILE
Risk level: medium
Suggested risk: 1%
Timeframe: 1D
Disclosure: I am part of Trade Nation's Influencer program and receive a monthly fee for using their TradingView charts in my analysis.
✅LIKE AND COMMENT MY IDEAS✅

CHF/JPY SENDS CLEAR BEARISH SIGNALS|SHORT
CHF/JPY SIGNAL
Trade Direction: short
Entry Level: 194.825
Target Level: 191.430
Stop Loss: 197.075
RISK PROFILE
Risk level: medium
Suggested risk: 1%
Timeframe: 12h
Disclosure: I am part of Trade Nation's Influencer program and receive a monthly fee for using their TradingView charts in my analysis.
✅LIKE AND COMMENT MY IDEAS✅

NZD/JPY BEARS ARE GAINING STRENGTH|SHORT
Hello, Friends!
NZD-JPY uptrend evident from the last 1W green candle makes short trades more risky, but the current set-up targeting 86.923 area still presents a good opportunity for us to sell the pair because the resistance line is nearby and the BB upper band is close which indicates the overbought state of the NZ/JPY pair.
Disclosure: I am part of Trade Nation's Influencer program and receive a monthly fee for using their TradingView charts in my analysis.
✅LIKE AND COMMENT MY IDEAS✅
