ES (SPX, SPY) Analyses, Key Levels, Setups for Tue (Dec 16th)
As we head into Tuesday, ES is showing signs of structural weakness following a significant sell-off, culminating in a late dip into the 6845-6840 demand zone. The prevailing trend appears to be downward as long as prices remain beneath the resistance range of 6863-6874. However, the 6845-6840 support still has the potential to trigger a rebound. Traders should anticipate the most decisive price action around major data releases, followed by a phased, level-to-level approach in trading strategy.
EVENTS THAT CAN MOVE ES (ET)
2:00am UK labor data
3:15am-5:00am Eurozone PMI batch + ZEW sentiment window
8:30am US jobs data bundle + Retail Sales + Earnings + Unemployment
9:45am US Flash PMI
10:00am Business Inventories
4:30pm API oil stats (can hit energy tone into the close)
Market Outlook: NY Session Forecast
In the upcoming New York trading session, we anticipate a period of consolidation likely to include a modest rebound attempt. However, this upside movement is expected to face resistance within the range of 6859 and 6863-6874. Should sellers maintain pressure and keep prices below 6863 as we head into the session, we could see a subsequent pullback towards the 6845-6840 range, followed by a potential drop to 6825.
On the bullish side, if the market can decisively reclaim and sustain levels above 6874, we might open the door for a rally towards 6902 and possibly 6923.
Conversely, a clear breach below 6840 that lacks immediate recovery signals strengthens the bearish outlook, targeting 6825 initially, with the potential for a further decline to 6800-6790.
ES Short (A++) - Sell 6863-6874 - SL 6876.50 - TP1 6845-6840 TP2 6825 TP3 6800-6790
Key zones
Support - 6845-6840, 6825, 6800-6790
Resistance - 6851-6859, 6863-6874, 6902, 6923-6936
A++ Setup 1 - Short (ceiling fade)
Entry - Sell 6863-6866 after a rejection from 6863-6874
Stop - 6876.50 (above the rejection high)
TP1 - 6845-6840
TP2 - 6825
TP3 - 6800-6790
ES Long (A++) - Buy 6825 reclaim - SL 6814.25 - TP1 6863 TP2 6902 TP3 6923
A++ Setup 2 - Long (flush then reclaim)
Entry - Buy 6825-6828 only after price reclaims and holds above 6825
Stop - 6814.25 (below the flush low)
TP1 - 6863
TP2 - 6902
TP3 - 6923
Good Luck !!!
Tradinganalysis

ES (SPX, SPY) Analysis, Levels, Setups for Wed (Dec 10th)Market Overview:
The daily trend remains generally bullish, although recent sessions have manifested a sideways consolidation just beneath recent highs. Analysis of the 4-hour chart reveals a compressed range characterized by lower highs and higher lows, with prices maintained above the significant weekly demand zone between 6,600 and 6,640. On the hourly chart, the market has recently tested the support band at 6,840-6,850, currently resting at this level while momentum indicators suggest a potential upward reversal from a short-term oversold condition.
This price action appears more indicative of a pause at the lower boundary of the recent trading range rather than an outright breakdown.
We will continue to monitor the established levels for the week; prices have oscillated within these parameters without any clear break, suggesting that while the landscape of the market remains static, our positioning within it continues to evolve.
Overnight Developments Ahead of FOMC Meeting
As we head into the FOMC day, the prevailing market sentiment appears stable, with a slight upward bias as long as the support level around 6,840-6,850 holds firm. Asian and London sessions may experience dips below today's lows; however, if we manage to close above the first support level (S1), there remains potential for a rebound toward the 6,870-6,900 range as we approach the New York morning session.
Conversely, a decisive break and sustaining an hourly close beneath 6,840 would likely trigger a deeper examination of the second support level (S2), situated between 6,780-6,805, during either the European or early U.S. trading hours. With the Federal Reserve's announcement imminent, we anticipate more pronounced market moves could arise predominantly once we break free from the S1/S2 or R1/R2 boundaries, rather than from the current middle of the trading range.
A++ SETUP 1 - LONG
Enter: 6,790 - 6,800
SL: 6,770
TP1: 6,850
TP2: 6,900
TP3: 6,920 - 6,945
A++ SETUP 2 - SHORT
Enter: 6,925 - 6,935
SL: 6,965
TP1: 6,860
TP2: 6,800
TP3: 6,750
High impact news/events for tomorrow
2:00 pm - Fed interest rate decision and FOMC statement (last Fed meeting of 2025)
2:30 pm - Fed Chair Powell press conference
10:30 am - EIA weekly crude oil inventories (US oil stock data, often moves CL and ES/NQ via risk sentiment)
10:00 am - US Wholesale trade & inventories (medium impact, can move ES a bit if there is a big surprise)
Good Luck !!!

ES (SPX, SPY) Analysis, Key-Zones, Setups for Tue (Dec 9th)ES Market Overview (Daily/4H/1H)
The daily trend in the ES market remains bullish, with prices consistently above the most recent higher low while approaching a significant multi-month supply zone characterized by the 6,980-7,020 range. Although momentum has moderated, it has not completely reversed, suggesting that buyers continue to support dips, while larger market participants exercise caution around the 7,000 mark.
On the 4-hour chart, we have identified a new swing high near 6,900, followed by a notable pullback that touched the 6,820-6,840 area and subsequently rebounded. This development maintains the sequence of higher lows; however, sellers are becoming increasingly active with each attempt to rally towards the 6,880-6,900 range.
Examining the shorter-term 1-hour and 30-minute charts reveals that Monday experienced a lower high compared to last week's peak, leading to a decline towards the 6,820s before regaining ground in the 6,860s. Currently, the ES is positioned midway within the support band and beneath the intraday highs around 6,875-6,895, indicating a balanced short-term outlook: buyers are engaged below the 6,850 level, while selling pressure emerges near 6,890.
Macro Backdrop for Tomorrow
As we approach the December FOMC meeting, which kicks off tomorrow with the decision and subsequent press conference from Fed Chair Jerome Powell expected on Wednesday, market positioning is likely to remain cautious, especially near the upper range.
Key U.S. data releases scheduled for tomorrow include the NFIB Small Business Optimism Index at 6:00 ET for November and the postponed JOLTS job openings report at 10:00 ET for October. These reports provide insights into hiring trends and business sentiment following the autumn slowdown and recent government shutdown. In particular, the 10:00 ET release could trigger increased volatility. Furthermore, the global tone appears somewhat apprehensive, with Asian markets showing signs of weakness ahead of the Fed's decision.
OVERNIGHT SESSION FORECAST FOR NY MARKETS
In the base case scenario, we anticipate that the E-mini S&P 500 (ES) will navigate between support level S1, situated between 6,840 and 6,850, and the band of 6,875 to 6,895 as traders position themselves ahead of the JOLTS report and the commencement of the Federal Reserve meeting. A retreat to S1 that holds above the approximate level of 6,835 is considered constructive, potentially setting the stage for a recovery into the upper range of Monday’s session, specifically around 6,880 to 6,895, as we transition into London trading and early New York.
On the upside, should buyers successfully propel and maintain prices above 6,900 during the New York morning session, the next significant target would be resistance level R2, ranging from 6,920 to 6,945. This area is likely to attract selling activities as market participants position themselves ahead of the Fed's Wednesday decision, making sustained trading above R2 before the announcement less probable.
Conversely, if S1 does not hold and we witness hourly closes below approximately 6,835, this could indicate a shift toward a more bearish outlook, paving the way for a decline towards support level S2, which lies between 6,780 and 6,805—aligning with the 4-hour higher low region. Such a breakdown would frame the next trading day as a corrective phase within the broader uptrend.
Overall, the bias heading into tomorrow leans mildly bullish yet appears to be capped. We expect a two-sided trading range, with initial dips towards S1 likely attracting buying interest, while pronounced selling pressure is anticipated around the 6,890-6,905 region and more so at 6,920-6,945 as traders await further guidance from the Federal Reserve.
A++ Setup 1 - Short from R1
Entry: 6,892 - 6,900 short
SL: 6,912
TP1: 6,850
TP2: 6,815 - 6,820
TP3: 6,790 - 6,800
A++ Setup 2 - Long from S1
Entry: 6,842 - 6,850 long
SL: 6,828
TP1: 6,882 - 6,890
TP2: 6,905
TP3: 6,920 - 6,930
Good Luck !!!
ES (SPX, SPY) Week-Ahead Analyses (Dec 8th - 12th)Market Analysis: Multi-Timeframe Structure Indicates Continued Bullish Sentiment, Yet Signs of Fatigue Emerge
Weekly Trend Assessment
The weekly trend remains robustly bullish, characterized by a series of higher highs and higher lows since the spring lows. The latest significant weekly higher low was established in the low 6,200s, with current price action oscillating just below the resistance zone around 6,900. This positioning indicates that price is trading at a premium against the last substantial weekly swing range (approximately 6,250 to 6,900), with a key equilibrium point at around 6,575. With prices situated nearly 300 points above this mid-range, new long positions in this area are likely paying a premium, contingent upon sustained price movement rather than favorable entry points.
The current weekly candle displays a small body resting at the top of the preceding expansion bar, a classic sign of balance at the top of an ongoing trend rather than a definitive reversal.
Daily Trend and Range Overview
The daily structure also points towards bullish momentum: since the November lows near the low 6,300s, prices have generated higher highs and higher lows, currently thriving within the strong resistance band of 6,850 to 6,900. Recent trading sessions have produced a tight range below this recent peak, with support forming around 6,840-6,860 and resistance capping at 6,890-6,905. Until there is a decisive move above the 6,905-6,920 range or a daily close beneath 6,840, the market remains in a sideways consolidation pattern at the pinnacle of this uptrend.
4-Hour Structure Insight
The 4-hour chart reflects a sharp upward leg originating from approximately 6,780, reaching into the 6,900 territory, followed by overlapping candles and shallow retracements. This price action suggests that the preceding move was impulsive, and present conditions may represent a pause rather than a full reversal. The latest significant 4-hour swing demonstrates a higher high around 6,900-6,905 followed by a higher low at 6,870, with current prices positioned in the upper half of this micro-range.
Momentum within the 4-hour timeframe appears to be waning: candles are producing smaller bodies, with wicks protruding in both directions, coupled with diminished trading volume. This behavior often precedes either a marginal high or a retreat towards the earlier price base.
1-Hour Contextual Analysis
On the 1-hour chart, the market is currently trapped between a short-term support floor around 6,870-6,875 and a resistance cap in the 6,895-6,905 range. Overnight trading has developed within this mid-range, setting the stage for today's session. As traders enter the New York trading hours, a critical factor will be whether the market can decisively break and maintain levels above 6,905, or if that resistance will invite profit-taking and selling pressure.
Momentum Indicators: Weekly and Daily Perspectives
The weekly oscillator has retraced from prior overbought extremes and is now gradually ascending from a neutral zone - a constructive medium-term indicator. Although the trend remains upward, the substantial momentum surge may have already occurred. The daily oscillator presents an elevated stance, yet it is not at a new extreme and is beginning to form slightly lower highs while prices concurrently touch or slightly exceed previous highs. This presents a mild bearish divergence: the overarching trend is up, but each successive high lacks the same vigor as its predecessors.
In summary, while the structural analysis continues to favor a bullish outlook, momentum indicators signal a potential slowdown in the pace of price increases. The current scenario depicts an uptrend approaching resistance, exhibiting signs of fatigue but not yet forming a definitive topping pattern. Traders should remain vigilant in this environment as they navigate the interplay of momentum and price action going forward.
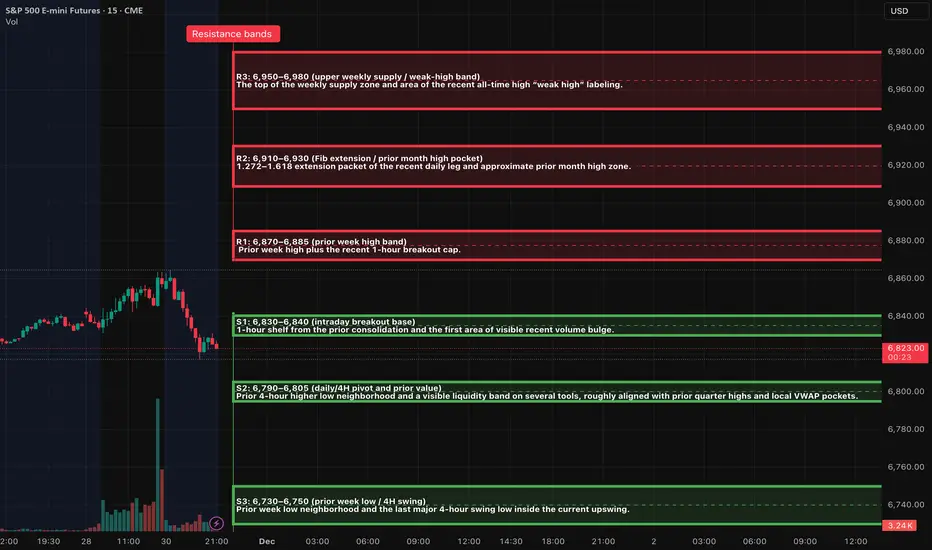
Key levels and zones
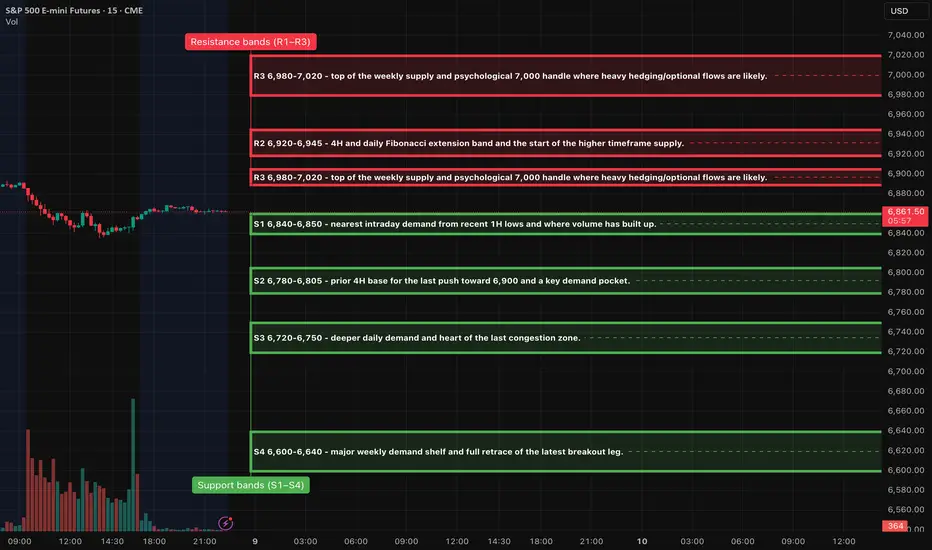
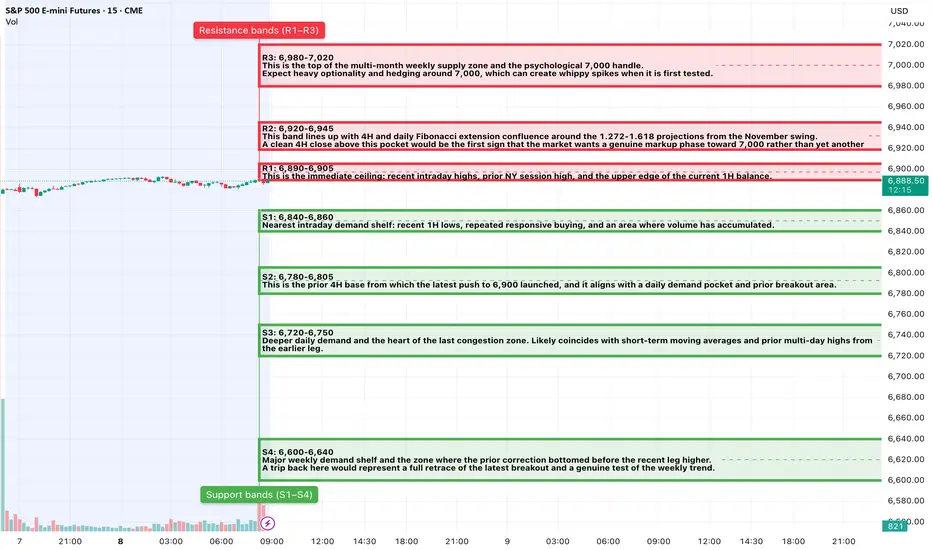
Resistance bands (R1–R3)
R1: 6,890-6,905
This is the immediate ceiling: recent intraday highs, prior NY session high, and the upper edge of the current 1H balance.
It also aligns with short-term extension targets from the last 4H leg. A lot of short-term stops will sit just above it.
Expect the first NY push into this pocket to attract profit-taking from longs and counter-trend scouts.
R2: 6,920-6,945
This band lines up with 4H and daily Fibonacci extension confluence around the 1.272-1.618 projections from the November swing.
It sits inside the broader weekly supply shelf and represents the first real “air pocket” above the current range.
A clean 4H close above this pocket would be the first sign that the market wants a genuine markup phase toward 7,000 rather than yet another rejection.
R3: 6,980-7,020
This is the top of the multi-month weekly supply zone and the psychological 7,000 handle.
It is labeled as a weak high area on higher timeframes: structurally important because a decisive break and hold above here would confirm a fresh weekly expansion leg, while another rejection would likely start a meaningful corrective phase.
Expect heavy optionality and hedging around 7,000, which can create whippy spikes when it is first tested.
Support bands (S1–S4)
S1: 6,840-6,860
Nearest intraday demand shelf: recent 1H lows, repeated responsive buying, and an area where volume has accumulated.
As long as NY closes keep holding above this band, the current congestion can be framed as a high-level pause, not a breakdown.
First test in NY AM is a candidate for a tactical bounce; repeated tests with weaker response increase the odds of a deeper flush.
S2: 6,780-6,805
This is the prior 4H base from which the latest push to 6,900 launched, and it aligns with a daily demand pocket and prior breakout area.
A 4H close back into and through this band would mean the most recent breakout has fully retraced. That is where swing buyers from the last leg begin to feel pain.
This is also near the top of a thicker volume shelf; structurally a very attractive support for A++ bounces if reached with a fast, emotional flush.
S3: 6,720-6,750
Deeper daily demand and the heart of the last congestion zone. Likely coincides with short-term moving averages and prior multi-day highs from the earlier leg.
If we are in a simple pullback within an ongoing weekly uptrend, this band should hold on a closing basis.
A stop-run into S3 that quickly reclaims S2 is classic “flush and spring” behavior.
S4: 6,600-6,640
Major weekly demand shelf and the zone where the prior correction bottomed before the recent leg higher.
A trip back here would represent a full retrace of the latest breakout and a genuine test of the weekly trend.
If this zone were to fail on a weekly close, you would be talking about trend damage rather than a routine shakeout.
One Decisive Pivot
The S&P futures are currently operating at a crucial make-or-break level between 6,780 and 6,800. This threshold acts as the dividing line between what could be characterized as an “orderly pullback within an ongoing trend” versus a “failed breakout.” Should the S&P maintain its position above 6,780 on both a 4-hour and daily closing basis, it will likely signal a high-level consolidation phase, potentially setting up for a breakout. Conversely, if the index witnesses a sustained decline below this pivot, particularly in conjunction with a rise in volatility, we could anticipate a deeper correction targeting key support levels S3 and possibly S4 in the coming weeks.
Volatility Environment
The VIX is sitting comfortably in the mid-teens, reflecting relative tranquility in the options market despite the index hovering just below all-time highs. The upward-sloping term structure of implied volatility indicates that the market anticipates modest near-term fluctuations while demanding a premium for longer-dated protection-classic contango behavior. This suggests an expectation for calm leading up to the upcoming central bank decision, with an inherent potential for volatility spikes should the Fed’s declaration differ from expectations.
Options Positioning and Skew Dynamics
A look at the equity-only put/call ratio, which currently stands at approximately 0.43 - significantly below the 20-day average of 0.60 - signals a robust call market and a degree of optimism prevailing within single-stock and broad equity options. Meanwhile, an uptick in demand for index puts persists, as evidenced by the index put/call ratio at around 1.07 and the SPX-specific ratio at approximately 1.13. This trend implies institutional preferences for hedging mechanisms even as spot indices flirt with historic highs. Furthermore, the SKEW index, around 149, remains considerably elevated compared to its long-term average, indicating that out-of-the-money downside insurance is costly relative to at-the-money options. This reflects ongoing concerns regarding tail risks in the current subdued market environment.
Overall, this paints a picture of a classic "call-happy, hedged-underneath" setup: the speculative fervor on the surface is balanced by institutional strategies focusing on downside protection. It's reasonable to infer that dealers are modestly long gamma at these index levels, which typically supports mean reversion around significant strike prices, such as 6,900, leading up to the Fed meeting - though these assumptions should be approached with caution.
Market Breadth and Internals
As we assess the broader market landscape, major indices concluded the previous week with modest gains, remaining within 1% of their all-time highs. Day-to-day breadth trends have exhibited a mixed demeanor; recent indicators show approximately 45% of stocks advancing while around 52% declined in one of the sessions, which leans towards a mildly negative sentiment, aligning with typical “fade at the highs” behavior rather than outright selling pressure.
Technology and growth sectors have continued to lead the market, while defensive plays, particularly utilities, have trailed - a development consistent with a risk-on market sentiment as opposed to classic late-cycle caution. Collectively, these internal metrics do not appear to confirm a market top but rather suggest a consolidation phase characterized by rotation at elevated price levels.
Credit and Funding Landscape
High-yield credit remains resilient, with HYG trading around 80.7 and JNK near 97.3, both positioned well within a narrow range proximal to their recent highs without signs of sudden outflows. The stability observed in high-yield ETFs indicates that credit spreads remain largely intact, contributing to overall orderly funding conditions without evident stress signals to undermine equity strength.
Sentiment and Crowd Positioning Analysis
The latest AAII survey reveals about 44.3% of respondents are bullish, 24.9% neutral, and 30.8% bearish, positioning the bull-bear spread at approximately +13.5 percentage points - well above the long-term average and indicative of rising optimism. When coupled with the low equity put/call ratio, this sentiment reflects a cautiously optimistic outlook that could risk complacency; however, it does not yet indicate a level of extreme sentiment typically preceding major market tops.
In summary, sentiment appears to support continued upward movement but carries an enhanced risk that any adverse macroeconomic developments could prompt a swift and pronounced market correction as overly crowded long positions seek exits.
Cross-Asset and Global Risk Tone
On the global stage, equity indices remain largely firm. The S&P 500 is experiencing a year-to-date increase of approximately 17% and is just shy of its record high. European indices like the DAX are also nearing their peaks, while Asian markets reflect mixed signals without evident distress. Additionally, the cryptocurrency market is displaying a risk-on attitude, with Bitcoin trading above $91,000 and Ethereum above $3,000 - both of which have risen recently ahead of the Fed meeting.
As we move forward, the interplay of these factors will be pivotal in shaping market expectations and movements in the wake of key policy announcements.
Macro and Data Calendar Context
This week, all eyes are on the Federal Reserve's meeting and rate decision scheduled for Wednesday. Futures markets currently reflect a strong expectation for a 25-basis-point cut from the existing range of 3.75-4.0 percent. However, internal divisions within the Fed indicate that this meeting could be one of the most contentious in recent memory. Market participants will also closely scrutinize updated projections and the tone during the press conference for insights into the anticipated rate trajectory through 2026.
On the data front, traders can expect delayed JOLTS figures and employment cost data. However, no significant inflation metrics are on the immediate agenda to influence the Fed's decision.
As for the week’s trading landscape, the narrative is quite clear: today and tomorrow are likely to involve positioning and range-trading at elevated levels, with Wednesday’s rate decision and subsequent press conference acting as critical catalysts that could break the current trading range of 6,850-6,900.
Scenario Mapping and Odds
Forecasting the market trajectory involves qualitative assessments rather than precise calculations, but the analysis reflects the prevailing structure, sentiment, and macroeconomic environment.
Primary Path (Approximately 55% Probability)
We expect a period of consolidation with a slight positive bias. The E-mini S&P 500 (ES) is anticipated to fluctuate between support (S1 at 6,840-6,860) and resistance (R2 at 6,920-6,945) leading up to the Fed meeting. We may witness multiple attempts to test the 6,890-6,905 ceiling, leading to sharp but controlled pullbacks. Market breadth appears mixed but stable, with the VIX remaining in the mid-teens and high-yield credit markets demonstrating resilience. A decisive directional breakout is likely to occur post-Fed - either a bullish push through R2 toward the 7,000 mark if the rate cut and guidance are deemed supportive or a bearish reaction if the Fed's tone leans hawkish.
Bear-Extension Path (Around 25% Probability)
This scenario suggests a failed breakout resulting in a deeper correction. Should the ES spike toward R1/R2 but decisively falter, a breakdown below S1 with a four-hour close under approximately 6,840 - either before or immediately after a hawkish Fed surprise - could trigger accelerated declines toward S2 (6,780-6,805) and potentially S3 (6,720-6,750). In this case, we would likely see the VIX rising above 20, deteriorating market breadth, and softness in high-yield indices (HYG/JNK). If these indicators remain stable, the likelihood of this path diminishes.
Confirmation Triggers: A four-hour close beneath 6,840, coupled with a spike in volatility and weakening credit conditions, will signal that this bearish scenario is gaining traction.
Bull-Surprise Path (Approximately 20% Probability)
In this scenario, a clean breakout could initiate a year-end rally. The ES would break through R1, consolidate briefly, and then surge past R2, ideally closing above 6,945, thereby converting the 6,900 level into support. A dovish Fed decision paired with guidance perceived as growth-supportive - without reigniting inflation concerns - could easily lift prices into the R3 band (6,980-7,020) this week. Under this outcome, we would expect lowered VIX levels, a broadening of sector leadership beyond just mega-cap technology stocks, and a potential euphoric sentiment among investors.
Confirmation Triggers: Sustained trading above 6,945, with S1 holding as support on any pullbacks, would confirm the validity of this bullish scenario.
Order-Flow and Micro-Structure Analysis: Key Levels for Today's New York Session
In today's intraday trading environment, particularly within the New York session, attention will be focused on critical resistance and support levels.
Resistance Levels (R1 and R2):
- At R1 (6,895-6,905), traders should monitor for late buyers entering the market. If this occurs without a corresponding increase in volume and 1m-5m candles start to show upper wicks, it may indicate potential weakness. A shift in Delta from strongly positive to neutral or negative during this price action would support a bearish outlook.
- Should the price advance to R2 (6,920-6,945), the essential factor will be whether it can sustain above this level on 15-minute closes. A clean acceptance accompanied by tight consolidations in the shorter time frames would suggest a bullish continuation. Conversely, if spikes and sharp rejections are noted, this could favor a fade in prices.
Support Levels (S1 and S2):
- At S1 and particularly at S2, the long thesis strengthens if there is a notable expansion in volume during a flush, followed by a marked slowdown and stable buying activity. A pattern of 1m-5m candles producing higher lows, while still operating within the support zone, would further bolster the long case.
In instances where the micro-structure fails to align with the broader market narrative at these pivotal levels, the prudent approach may be to refrain from trading until the market clarifies its direction in relation to impending Fed announcements.
Market Forecast for Today's NY Session:
- For today, the baseline expectation is for the ES to continue fluctuating within the 6,840-6,905 range, with an early attempt to breach overnight highs into the 6,895-6,905 zone. If this upward movement struggles, particularly with weak market breadth and the Nasdaq lagging, a pullback towards the 6,865-6,875 mid-range is anticipated, potentially extending down to S1 at 6,840-6,860, where we can expect responsive buyers to re-enter.
- A decisive break and sustained hold above the 6,905-6,920 level ahead of Fed statements would signal market anticipation of a dovish outcome, possibly triggering an earlier test of R2. On the downside, a breach below 6,840 on a 4-hour closing basis would suggest a shift toward a bearish continuation leading into the event.
Traders should focus on two A++ setups as primary strategies: consider fading any exhausted rallies approaching 6,900 and prepare to enter long positions on a genuine flush down to the 6,780-6,805 support area if the opportunity arises.
A++ Setup 1 - Short from upper shelf (R1)
Enter: Short ES in the 6,895-6,905 zone once you see a 5-15m rejection candle and a 1m-5m lower high back inside 6,900.
SL: 6,918-6,922, above the rejection wick and inside R2.
TP1: 6,860, at the top of the S1 shelf (take about 70% off and move stop to breakeven or slightly in the green).
TP2: 6,810-6,800, targeting the top of S2 if momentum extends.
Notes: Treat this as a high-probability fade of stretched prices into event risk; if you get a clean 4H close above ~6,920, the idea is invalid and you stand aside.
A++ Setup 2 - Long from 4H base (S2)
Enter: Long ES in the 6,780-6,805 zone after a fast flush into S2, a 15m candle that sweeps below and closes back above ~6,790, and then a 5m higher low above that reclaim.
SL: 6,770-6,775, below the reaction low and under the S2 pocket.
TP1: 6,860-6,870, back toward the S1/mid-range band (scale about 70% and move stop to breakeven or slightly positive).
TP2: 6,920-6,945, targeting the R2 band if the bounce evolves into a full reclaim of the upper range.
Notes: This is your preferred “flush-and-spring” play; a 4H close below ~6,780 invalidates the bounce thesis from S2 and shifts focus to lower bands.
XAUUSD Bullish Reversal Setup – Breakout Target AheadGold (XAUUSD) is currently reacting from a major intraday support zone after a sharp correction. Price has tapped into the lower liquidity area and is showing early signs of potential bullish reversal.
🔶 Key Levels & Structure
Strong Support Zone: Price is testing a major demand area where previous bullish moves originated.
Breakout Zone: A minor breakout is expected once price breaks above the short-term resistance structure.
Strong Resistance: A bigger bearish liquidity block sits below, but the market is currently respecting the upper demand.
Breakout Target: If bulls gain momentum, price could push toward the 4165–4175 supply area.
📈 Bullish Scenario
If price holds above the current support and breaks the short-term structural high, we may see a clean bullish continuation toward the upper breakout target zone.
📉 Bearish Scenario
Failing to hold current support could drag price back down into the lower liquidity pools before any strong reversal attempt.
📝 Overall Outlook
Market structure favors a bullish recovery, but confirmation is required through a clear breakout of short-term resistance. Traders should wait for strong candle closures to avoid false moves.
🔥 Title Suggestions
Gold Ready for a Bullish Breakout from Key Support
XAUUSD Reversal Setup – Watching the Breakout Levels
Gold Analysis: Strong Support Holding, Breakout Target Ahead
XAUUSD Bulls Preparing for Next Rally

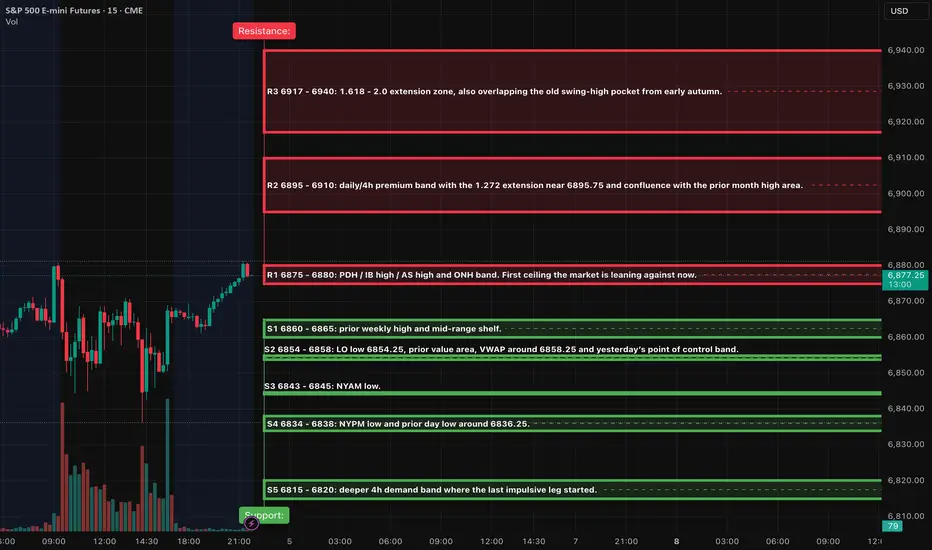
ES (SPX, SPY) Analysis, Key-Zone, Setups for Fri (Dec 5th)Market Overview
The daily trend remains firmly upward, with prices pressing against the November swing-high band, characterized by a sequence of higher lows and a gradual ascent toward previous peaks. Momentum indicators on both the daily and 4-hour charts are on the rise, yet they have not entered extreme levels, suggesting a likelihood of continued upward movement into the upper premium band rather than an imminent substantial reversal.
On the 4-hour and 1-hour charts, the E-mini S&P 500 (ES) has been consolidating in a narrow range, roughly between 6835 and 6880, as it builds energy just below the prior high. This range coincides with the 1.272 to 1.618 Fibonacci extension zone, located around 6895 to 6917. Given this setup, the outlook for tomorrow appears slightly bullish, provided the price remains above the mid-range support levels.
Market Brief: Key Developments for December 5, 2025
As we approach the final Federal Open Market Committee (FOMC) meeting of the year scheduled for December 9 -10, market participants are increasingly pricing in a substantial likelihood of a 25 basis point rate cut, along with further easing anticipated in the coming year.
For tomorrow, however, it’s important to note that the widely followed November employment situation report (including Non-farm Payrolls and the unemployment rate) has been officially postponed to December 16 due to the ongoing government shutdown. While some generic calendars may still reflect the original December 5 date for the payroll figures, this information has become outdated. At this time, it appears unlikely that any partial wage data will be released in lieu of the full report.
Nevertheless, many calendars are still marking U.S. hourly earnings and related labor indicators for the morning session. Expectations are set for hourly earnings, nonfarm payrolls, and unemployment rate placeholders around 8:30 AM ET, alongside the University of Michigan consumer sentiment and inflation expectations reports at 10:00 AM ET.
In practical terms, traders should expect regular liquidity levels in Asian and London markets. However, be prepared for potential volatility spikes around the 10:00 AM ET release of the U. Michigan data, especially if any unexpected headlines arise concerning the delayed labor report.
Market Outlook: Overnight Trends into New York Trading Session
As we head into the New York trading session, the key focus remains on the E-mini S&P 500 (ES). The base case scenario suggests that as long as ES maintains support above the significant range of 6854 to 6858 - often referred to as S2 - during any dips seen in the Asian and London sessions, we can anticipate a gradual upward movement. This trajectory would likely involve repeated testing of resistance levels around 6875 to 6880 (R1). Should we witness consistent hourly closes that approach this resistance with only modest pullbacks toward 6860, the likelihood of a breakout toward the premium zone of 6895 to 6910 increases, potentially occurring before or during the New York session.
On the other hand, the alternative scenario would unfold if the market decisively breaks below S2, resulting in a series of hourly closes beneath 6854. Such a development would signal a shift in sentiment and a potential rotation toward support levels S3 and S4, which target 6835. This would likely create a mean-reversion environment, with trading in New York focused more on the lower half of the 6835 to 6880 range rather than pushing for a breakout above resistance. Investors should tread carefully as these scenarios develop.
A++ setup 1 - Long breakout continuation above 6875
Bias: continuation long, only if we see real acceptance above R1.
Trigger conditions:
15m candle closes with a solid body above 6880, turning the 6875 - 6880 band from
Entry zone: 6878 - 6882 on the first 1m/5m higher low after that pullback holds.
Initial stop: 6869, tucked below the 6870 intraday pivot and just under the reclaimed band.
• TP1: 6904 - 6908, inside the 6895 - 6910 premium band, giving you roughly 2R or better if you are filled near the middle of the entry band and respect the tight stop.
• TP2: 6915 - 6918, near the 1.618 extension.
A++ setup 2 - Short reversal from failed break 6895 - 6910
Bias: high-quality fade only if the market runs stops into the premium band and then traps longs.
Entry zone: 6890 - 6896 on a retest of 6895 from below after that rejection is confirmed.
Initial stop: 6908, above the rejection high and inside the upper part of the premium band.
• TP1: 6858, back into the VWAP / prior value area pocket. That gives you roughly 2R or better if you are filled near mid-band with a 10 - 12 point stop.
• TP2: 6843 - 6845, test of NYAM low.
Tomorrow is shaping up to be a pivotal decision point following a robust advance in the market. As long as the support level around 6855 remains intact, any dips should be viewed as buying opportunities, particularly targeting the premium range of 6895 to 6917. However, a decisive rejection from this premium zone, with prices falling back through 6870, may signal an A++ short opportunity, potentially driving prices down toward 6858 and beyond.
Good Luck !!!
ES (SPX, SPY) Analysis, Levels, Setups for Thursday (Dec 4th)Market Outlook: Key Event and Trading Strategy
Main Event: Tomorrow's primary focus will be the release of US Initial Jobless Claims at 8:30 AM ET. Market participants should anticipate a significant increase in volatility during the premarket session surrounding this announcement. Notably, no other major US economic indicators of similar significance are scheduled to be released, which typically influence the E-mini S&P 500 (ES) as consistently as Jobless Claims does.
Investors should consider the 8:30 AM release as the initial decision point. It is advisable to allow for the initial volatility spike to materialize before assessing market levels as they begin to normalize. The A++ trading setups detailed below are designed to activate following the 8:30 move, ideally capitalizing on opportunities that arise during the morning session in New York.
Market Analysis: Current Landscape and Outlook
Daily Overview: The E-mini S&P 500 (ES) has maintained an upward trajectory, approaching the swing high levels from November. Currently, the price is positioned within the upper range of recent activity, just below a significant resistance zone situated in the high 6800s to low 6900s. While daily momentum indicators remain in positive territory, they are showing elevated levels, suggesting potential for upside continuation. However, the reward for initiating new long positions in proximity to resistance appears limited at this juncture.
An examination of the four-hour chart reveals a sideways trading band beneath the recent highs. Despite repeated attempts to breach the upper boundary, gains have not been sustained, though buyers continue to defend pullback levels. Below the current price, a notable demand zone exists between 6815 and 6825, with a deeper support area around 6780 to 6790. Should the 6815 level hold on a closing basis, the medium-term trend remains favorable.
Today’s price activity has formed a tight range, approximately between 6857 and 6865, with the previous day’s high located near 6873 and early lows today around 6820. The market appears to be consolidating near last week’s highs, with clear liquidity zones identified both above 6873 and below 6840.
For the overnight session extending into the New York trading day, the expectation is sideways-to-up as long as the price remains above 6815. This scenario suggests potential squeezes toward the 6885 to 6900 range before a more significant decision point emerges. Conversely, a decisive break and 15-minute close below the 6815 level would open the door to the 6780 to 6790 region and would likely temper the bullish outlook heading into Friday's session.
A++ Setup 1 - Short from upper band 6885-6898
Entry zone: 6882-6888 short on the first clean 5m lower high after the 15m rejection.
Initial stop: above 6898 (or 2-3 points above the rejection wick if that printed higher). From a mid-band entry, this is roughly 10-12 points of risk.
• TP1: 6860-6863 (return to the top of today’s box and prior week high zone).
• TP2: 6835-6840 (mid-band support).
• Optional runner TP3: 6818-6822 if 6840 fails and selling pressure accelerates.
Invalidation
A decisive 15m close above 6898 that then holds on a pullback. In that case, the short idea is downgraded and price is more likely aiming for 6915-6925.
A++ Setup 2 - Long from demand pocket 6815-6825
Entry zone: 6820-6826 long after the first clean 5m higher low and reclaim of 6825.
Initial stop: under 6808-6810, below the rejection wick and the lower edge of the pocket. From a 6823 entry this is about 13-15 points of risk.
• TP1: 6857-6860 (today’s box floor and first resistance on the way back up).
• TP2: 6868-6873 (prior day high and recent NYPM highs).
• Optional runner TP3: 6885-6895 if price continues squeezing toward the upper resistance band.
Invalidation
A 15m close beneath 6810 that is not reclaimed quickly. That opens the way toward 6780-6790 and downgrades the long.
Good Luck !!!
ES (SPX, SPY) Deep Analyses for Upcoming Week (Dec 1st - 5th)Multi-Timeframe Market Structure Analysis
Weekly Trend Overview
The E-mini S&P 500 (ES) continues to reflect a robust bullish trend on the weekly chart, characterized by a series of higher highs and higher lows. The most recent swing low is situated in the mid-6,500s, while prices are currently testing the previous weekly high zone around the high-6,800s, accompanied by a labeled weak high band overhead.
In terms of market positioning, prices reside firmly in the upper half of the annual range, trading within a premium supply band rather than at a discount. Momentum indicators are showing signs of a slowdown, with the weekly oscillator retreating from overbought conditions and gently sloping downward, even as prices hold near their highs. This situation exemplifies early-stage negative momentum divergence, suggesting that while the overarching trend remains intact, any upside progress is now slower and increasingly susceptible to pullbacks.
The structural bull market on the weekly timeframe is still valid, but the current price action falls into a costly zone, placing the onus on buyers to maintain upward momentum.
Daily Trend Analysis
Following a notable decline in November from the all-time high, ES established a higher low around the mid-6,500s, coinciding with a key extension bundle. Subsequently, it rebounded through the mid-6,700s, successfully reclaiming the essential daily midrange. The latest price action reflects a sequence of lower lows (LL), higher lows (HL), and a higher high, signaling a short-term bullish trend within a broader sideways pattern just beneath the recent highs.
The active daily range is delineated between 6,650 and 6,900, with current trading situated in the upper third. The daily momentum oscillator has sharply ascended from oversold territory and sits comfortably in the 60s—nearing overbought conditions but not quite there yet.
The daily trend indicates an uptrend initiated from a higher low, now testing resistance levels. Trend-following participants are positioned long, though late entrants may find themselves crowded near the upper edge of the trading range.
Four-Hour Structural Insights
The 4-hour chart reveals a strong reversal from a low around 6,525, where price structure has formed a clean stair-step of higher highs and higher lows. The latest 4-hour higher low rests in the high-6,700s. The recent impulse leg from this higher low has driven prices into the prior week's high and supply band near the high-6,800s. Observations indicate that candles are narrowing while wicks are extending, typically signaling an impending maturation of the current price leg.
While this remains largely an impulse move rather than a complete correction, the risk-to-reward ratio for entering fresh long positions at these levels appears unfavorable without a corrective pullback.
The 4-hour trend is decidedly bullish, yet this leg is maturing. A retracement toward the last observed higher low band in the high-6,700s would be both typical and healthy for the ongoing progression.
One-Hour Intraday Context
The 1-hour chart indicates a prolonged consolidation phase in the low-to-mid-6,800s, succeeded by a breakout thrust toward the prior week’s high. Recent micro-structural developments show small higher highs with diminished follow-through into the resistance zone. The emergence of upper wicks on the 1-hour candles suggests we're in the later stages of this move which originated from Friday’s New York low.
For intraday traders, entering new positions at this stage carries poor asymmetry. Strategies may involve either capitalizing on a potential exhaustion spike higher or considering buys only after a reset lower.
The intraday price leg is nearing maturity; anticipate either a minor mean reversion back into the breakout base or a final overshoot into the overhead extension band, followed by a more substantial pause.
Oscillator Insights on Weekly and Daily Timeframes
On the weekly front, the oscillator is rolling over from overbought levels, keeping prices near previous highs. While this in itself does not constitute a sell signal, it does imply that any additional advances will likely become increasingly challenging and volatile. Conversely, the daily oscillator remains robust, exhibiting positive momentum and trending upwards, although already sitting at mid-to-high levels. While there remains potential for one more uptick toward resistance, the risk of a sharp downturn looms larger should market news or flows fail to meet expectations.
Bottom Line: The primary timeframe indicators (weekly/daily) maintain a bullish outlook, while the active swings on the 4-hour and 1-hour charts are showing maturity and extension into resistance. The upcoming trading week will likely focus on navigating this late-stage upswing, either through fading exhaustion at the range's peak or by purchasing on controlled dips into well-defined demand zones.
Market Overview: Key Levels and Dynamics
Trend Boundary Analysis: 6,780 Area
The pivotal threshold for discerning between a healthy pullback and a significant trend reversal lies around the 6,780 mark. A sustained daily close below this level—specifically under S2 and near the last daily higher low—would signal a transition from what appears to be a “healthy pullback in an uptrend” to a more pronounced “daily correction.” In contrast, remaining above 6,780 allows for the interpretation of pullbacks as buyable dips into existing demand. However, should the market close below this threshold with consistent acceptance evidenced by multiple 4-hour closes and significant volume, the prevailing sentiment would shift towards anticipating a larger trading range or an early trend change.
Volatility Metrics Overview
The volatility index (VIX) closed at approximately 16.35 on Friday, a considerable drop from the mid-20s earlier in the month, indicating a low-to-moderate equity volatility regime. The options market appears relaxed rather than panicked. The VIX term structure has returned to contango, with the front month trading cheaper than the back month, supporting a risk-on environment without veering into euphoria. On the treasury front, the MOVE index remains elevated at around 69, having retreated from mid-80s spikes earlier in November, signaling that rate volatility has cooled yet remains high compared to pre-2022 standards.
The recent readings suggest that the fear that overshadowed the mid-month selloff has largely been priced out. Both equity and rate volatility have begun to mean-revert, typically favoring range trading and a more orderly trend rather than severe sell-offs. However, it’s important to note that the current state makes protective measures inexpensive, hinting that abrupt corrections could emerge unexpectedly.
Options Positioning Dynamics
The total put/call ratio is hovering around 0.70 for the latest session, suggesting a slight tilt towards puts relative to longer-term averages. The equity put/call ratio stands at about 0.44, indicating a bullish, call-heavy sentiment among traders, predominantly in single-name options. The 10-day moving average of the put/call ratio is roughly 0.92, slightly below neutral, indicating some short-term complacency, although not excessively stretched.
The SKEW index has stabilized around 143, down from the 160s a year ago but still above the traditional baseline of 120-130. This points to an inclination for tail hedging that is present but not extreme. Given the mid-teen VIX levels and a neutral total put/call ratio combined with a low equity put/call ratio, it is reasonable to deduce that dealers are likely not heavily short gamma at current spots. They may be positioned closer to long or flat gamma within the 6,750-6,900 range, which generally dampens intraday volatility and suggests a tendency toward mean-reversion. Conversely, movement outside this band—specifically above 6,950 or below 6,730—could alter the gamma positioning and pave the way for more significant directional shifts.
Market Breadth and Internal Strength
The S&P 500 concluded the week with a modest 0.5% gain on Friday, reflecting small gains throughout the month, while the Nasdaq faced a 1.5% decline, primarily driven by weakness in large technology stocks. The S&P 500 remains above both its 50-day and 200-day moving averages, having reclaimed the 50-day line last week after an earlier dip, suggesting renewed market participation beyond just a few mega-cap stocks.
Sector performance varied notably, with technology facing headwinds throughout November—most notably from AI-linked companies—while sectors such as energy, consumer cyclicals, and certain areas of healthcare and financials saw positive movements towards month-end. Despite an earlier warning from indicators like the McClellan Oscillator suggesting internal weaknesses, the recent rebound has begun to improve breadth. However, concerns linger that this rally might be more fragile than typical broad-based advances, given its rotational and choppy nature.
Credit and Funding Landscape
The high-yield index (HYG) hovers around 81, near recent highs, indicating generally favorable credit conditions as it has progressively climbed through November. High-yield spreads are tightening relative to recent standards, reinforcing a “risk-on” attitude within credit markets. There are no apparent signs of acute funding stress; previous operational disruptions in futures markets were not indicative of systemic issues.
Currently, credit markets are not signaling alarms. As long as HYG remains above approximately 79, equity dips are more likely to be viewed as buying opportunities rather than triggers for widespread liquidation.
Sentiment and Investor Positioning
In the latest AAII survey, the bull-bear spread stands at around -11%, indicating a modest bearish sentiment, with bears outnumbering bulls by approximately 11 percentage points—below the historical mean of +6%. Conversely, the low equity put/call ratio suggests that traders are actively pursuing upside positions in individual equities.
In summary, while survey data points to cautious investor sentiment, options markets illustrate a preference for call buying and a diminishment of fear. This dichotomy often results in uneven uptrends with the potential for sudden pullbacks when complacency is inevitably challenged.
Global Risk Sentiment and Cross-Asset Overview
In the cryptocurrency sector, Bitcoin has stabilized around 90-91k following a significant correction earlier in the month, with modest recovery observed in the past week. This development underscores a risk-on atmosphere among investors.
Macro and data-calendar context
• The coming week (Dec 1–5) is busy but not as pivotal as the mid-December CPI/Payrolls
• Key events:
• Monday: ISM Manufacturing and construction spending.
• Tuesday: JOLTS job openings.
• Wednesday: ADP employment and ISM Services, plus several PMI and industrial-production figures.
• Thursday: Challenger job cuts, weekly jobless claims, and trade balance.
• Friday: Critically, the delayed PCE and core PCE inflation data for September, pushed back by the recent government shutdown.
• Fed communication: The Fed is effectively entering its pre-meeting quiet period; Powell’s upcoming speech is one of the last major remarks before the December meeting.
Macro narrative: Markets are leaning heavily toward another Fed rate cut in December and a benign inflation path.  Given that, negative surprises in PCE or labor data could trigger a sharp repricing.
The late-November rally appears to be a recalibration of positioning and sentiment following a mid-month scare within the tech sector, rather than a direct response to any significant data shock. This week's major macroeconomic event is Friday's PCE report; other data releases are expected to influence intraday fluctuations rather than alter the overarching trend.
Scenario Analysis and Probabilities
These scenarios represent probabilistic outcomes rather than certainties.
Primary Path — “Controlled Grind with Dip-Buying” (Approximately 50%)
As we enter Monday, expect a modest pullback from Friday's late gains, with overnight Globex trading projected to fluctuate between 6,820 and 6,880. Early in the week, the market may test support levels S1 (6,830–6,840) or potentially S2 (6,790–6,805), ultimately leading to renewed attempts to breach resistance at R1 and possibly R2. By the week’s end, prices are anticipated to oscillate within a broad range of 6,790–6,930 ahead of Friday's PCE announcement, with only temporary moves outside this zone.
Confirmation Criteria: This path will be validated if we observe rejections below the 6,780 level holding firm on a closing basis, accompanied by repeated failures of sellers to maintain downward pressure beneath S2.
Bear-Extension Path — “Deeper Reset Before Year-End” (Approximately 30%)
This scenario is triggered by a failed breakout above R1/R2 early in the week, coupled with a significant intraday reversal and a decisive 4-hour close beneath S2 and potentially S3. Initial price action may feature a spike into the 6,910–6,930 range followed by swift sell-offs, leading to a rapid retreat back through S1 and S2, particularly if the PCE data comes in above expectations or labor statistics surprise on the upside, prompting a re-assessment of potential Fed rate cuts.
Target Area: The initial aim would be the 6,650–6,700 region (near S4), with the possibility of a complete reversal down toward the more robust 6,620–6,650 band.
Confirmation Criteria: Continuous acceptance below approximately 6,730 on a 4-hour basis, combined with a daily close under the 6,780 threshold, would indicate a return to the narrative of a higher low for November.
Bull-Surprise Path — “Breakaway Into New Highs” (Approximately 20%)
This scenario is set in motion by a clear 4-hour and subsequent daily close above R2 and R3, driven by exceptionally benign PCE numbers and a supportive stance from the Federal Reserve. Initial price action should reflect minimal pullback in the early part of the week, steadily climbing past R1 and R2, ultimately resulting in a trend day that aggressively squeezes shorts above the 6,950 mark.
Target Area: The market will likely gravitate toward the extension zone of 7,050–7,100.
Confirmation Criteria: Sustained trading above 6,930 without significant reversals, robust market breadth, and a VIX that remains comfortably anchored in the mid-teens or lower will serve as key indicators for this bullish outlook.
Two A++ setups for the week
A++ Setup 1: Rejection short from R2
Fade spike into 6,910-6,930; Entries, SL, TPs
Entry zone: 6,890–6,900 on the first clean 1-minute pullback after the 5-minute lower high.
Initial stop: Above the rejection high plus a small buffer; planning number ~6,935. That is about 35-45 points of risk if filled near 6,895-6,900; refine to the actual 15-minute wick when it forms.
TP1: 6,830-6,840 (S1 / breakout base). From a 6,895 entry, that is roughly 55–65 points, giving at least 1.3-1.5R with the conservative stop and significantly more if the wick is tighter.
TP2: 6,790-6,805 (S2 demand pocket).
TP3 (runner): 6,730-6,750 (S3), only if tape is heavy (e.g., PCE or data shock).
A++ Setup 2: Continuation long from S2
ES Long (A++) - Buy reclaim of 6,790–6,805; Entries, SL, TPs
Entry zone: 6,805-6,815 on the first 1-minute higher-low after the 5-minute confirmation.
Initial stop: A few points below the spike low; planning number ~6,780, which gives about 25–35 points of risk.
TP1: 6,870-6,885 (R1 / prior week high band). From a 6,810 entry, that is roughly 60–75 points, delivering comfortably more than 2R with the planned stop.
TP2: 6,910-6,930 (R2 extension band).
TP3 (runner): 6,950-6,980 (R3 / upper weekly supply) if PCE and flows are supportive.
Good Luck !!!
ES (SPX, SPY) Analysis, Levels, Setups for Wed (Nov 26)Market Overview
The equity markets are currently facing a pivotal moment. The E-mini S&P 500 (ES) has made a significant rebound from the daily low around 6,520, approaching robust resistance levels formed by the highs of the previous week and yesterday. Both daily and 4-hour charts reveal a consistent pattern of higher lows emerging from a recent trough. However, the price now finds itself just beneath a key distribution cap and Fibonacci extension zone, estimated between 6,810 and 6,888. The daily momentum oscillator has shifted upward from an oversold position and remains at a mid-range level, indicating that while it is not yet overbought, the general trend still favors buying the dips, provided that crucial support levels are maintained.
Meanwhile, the Nasdaq 100 (NQ) mirrors this momentum, hovering near its New York Pre-Market (NYPM) peak. Recent gains have been bolstered by impressive earnings from Nvidia, highlighting the ongoing AI narrative, even as concerns about a potential market bubble begin to emerge, with NVDA's stock showing signs of volatility.
Events & News for Wednesday 26 Nov (Pre-Thanksgiving)
Wednesday is a data-heavy session in the U.S., and it’s also the last “normal” day before the Thanksgiving holiday liquidity vacuum. Expect volatility spikes and potential regime shifts around:
• 08:30 ET – Weekly jobless claims plus a cluster of delayed October releases: durable goods orders, trade balance/wholesale data, personal income & core PCE inflation, and related indicators.
• 10:00 ET – New home sales and other housing-related data.
• 10:30 ET – EIA crude oil inventories (can move risk sentiment via energy/curve).
• 14:00 ET – Fed Beige Book, giving an updated regional read on growth and inflation ahead of December’s FOMC meeting.
In addition, the BEA has postponed the Q3 GDP second estimate that had been scheduled for this week, so markets are leaning more heavily on the data above for macro guidance.
Net takeaway: 8:30 ET is the main volatility window, with a second impulse risk at 10:00–10:30 and potential trend extension or reversal into the NY morning kill-zone.
Key Zones (ES Z-25, based on current structure)
Immediate Resistance
• R1: 6,790–6,795
NYPM High / Prior Day High cluster (NYPM.H 6,792.5, PDH & Y-VAH 6,792.5). Sellers have defended this intraday band so far; it’s the lid of today’s range.
• R2: 6,805–6,815
1H fib extension 1.272 (≈ 6,810.25) plus likely PWH vicinity. First HTF extension above today’s range; a clean “stop run & decision zone” if 6,795 breaks.
• R3: 6,840–6,850
1H fib extension 1.618 (≈ 6,847.25). If buyers punch through R2, this is the next logical magnet and a strong candidate for an exhaustion spike on good data.
• R4: 6,880–6,900
1H fib 2.000 (≈ 6,888) and prior daily swing-high area. That whole 6,888–6,900 pocket is a big-picture objective and, for now, a likely “weak high” that could attract a stop run but also host the first serious counter-trend attempts.
Support / Demand
• S1: 6,765–6,775
Yesterday’s POC (~6,769.5), NY lunch high/NYL.H (6,774.25), and top of the 1H consolidation shelf. As long as the market keeps closing above this band on 15–60m, the short-term uptrend remains intact.
• S2: 6,720–6,735
Y-VAL 6,720.5, LO.H 6,721.5, ONH 6,732.5. This is the top of the prior value area and a natural “buy-the-dip” location if 6,770 gives way on data noise.
• S3: 6,670–6,705
NYAM.L 6,674.5, IB Low 6,674.5, ONL 6,701.75, plus current LOL 6,701.75. If we get a deeper flush, this is the primary intraday demand band where bulls must step back in to preserve the recent trend from the daily low.
• S4: 6,560–6,580
PDL 6,574.5 and top of the larger daily discount block. A break and sustained acceptance below here would open the door for a much larger retrace back toward the 6,520–6,420 HTF discount zone (daily 1.272/1.618 fibs).
Market Outlook: Bias & Forecast (Overnight → NY Session)
Structural Bias:
The prevailing market sentiment remains bullish as long as the E-mini S&P 500 (ES) sustains its position above the support range of 6,720–6,735 on a closing basis. The likely trajectory indicates a probing towards the 6,810–6,850 extension band. While the recent rally shows signs of being extended, it has not yet reached a point of definitive exhaustion, pointing towards a “late-stage impulse” rather than a confirmed top.
Overnight → London Session:
The base case anticipates a sideways-to-moderately downward movement from the 6,790s back toward the support levels of S1/S2 (6,765 → 6,730). This move aims to address intraday imbalances without disturbing the overall market structure. Should liquidity be limited, there may be an attempt during the London session to trigger stops through today's highs, directing attention towards resistance levels R2 (6,805–6,815) ahead of the New York session's developments.
New York AM Session (8:30–11:00 ET):
Should robust data emerge—indicating a favorable economic climate with subdued core Personal Consumption Expenditures (PCE) and steady labor claims—this is likely to spark a rally through R1 towards R2/R3, targeting 6,810 and subsequently 6,847 as key upside magnets. Conversely, a negative surprise featuring weak growth, a troubling inflation mix, or a risk-off sentiment evident in the Beige Book later in the day could dramatically alter the market landscape, potentially driving a liquidation toward support levels S2/S3, or in case of an unexpected shock, even probing S4 over the coming 24 to 48 hours.
In the near term, the expectation leans towards a gradual upward movement with shallow pullbacks, aiming for the 6,810–6,847 range. However, traders should remain vigilant for an increased risk of an exhaustion spike and a possible intraday reversal as this target zone is approached.
A++ Setups for Tomorrow
A++ Setup 1 – Trend Long from Retest of 6,730–6,770
Trigger:
Price trades down into 6,730–6,770 (S1/S2 overlap) either overnight or on the 8:30 data flush.
15m prints a higher low and closes back above ~6,755, reclaiming the mid-range.
5m confirms with a clear reclaim and hold of 6,760–6,770, then a higher low on 1m.
Entry Zone: 6,760–6,775 on a clean pullback after reclaim (not the first knife-catch wick).
Initial Stop: Below 6,720, tucked beyond Y-VAL/LO.H and the pullback low (≈ 35–45 pts risk depending on your exact fill).
Targets:
• TP1: 6,810–6,815 (R2 / 1.272 fib).
• TP2: 6,840–6,850 (R3 / 1.618 fib).
• Stretch: 6,880–6,900 (R4 / 2.0 fib) if data and risk sentiment stay supportive.
A++ Setup 2 – Exhaustion Short from 6,847–6,888
Trigger:
Impulsive move into 6,847–6,888 during NY AM or early PM, ideally on or shortly after 8:30 data.
15m candle shows rejection (long upper wick) and closes back below ~6,847.
5m prints a lower high under that rejection high, and 1m fails to make new highs on retests.
Entry Zone: 6,845–6,865 on the first proper lower-high after the rejection (avoid shorting the exact wick; let the LH print).
Initial Stop: Above 6,900, beyond the 2.0 fib and psychological round number (≈ 35–45 pts risk).
Targets:
• TP1: 6,790–6,795 (R1 / NYPMH/PDH cluster).
• TP2: 6,760–6,770 (S1 pivot band).
• Stretch: 6,720–6,735 (S2 / top of value) if selling pressure persists.

ES (SPX, SPY) Analysis, Levels, Setups for Tue (Nov 25th)Market Outlook: Analyzing Technical Trends and Economic Indicators
The recent rebound from the 6520–6450 support zone has generated a constructive short-term outlook. However, the market now approaches a significant supply area in the 6800 range. While the immediate trend appears to favor modest gains, contingent upon maintaining support between 6660 and 6645, a pivotal decision zone resides between 6765 and 6815. A strong acceptance above this band could trigger an upward movement towards 6855–6930, while failure to hold could lead to a corrective phase targeting 6690, 6625, and potentially 6550.
Upcoming Economic Data: November 25
The week ahead is marked by a wealth of economic data expected to impact trading activity, particularly in the U.S. housing market and consumer sentiment. Key reports scheduled for Tuesday morning include the S&P/Case-Shiller Home Price Index for September, the Conference Board Consumer Confidence Index for November, Pending Home Sales for October, and the Richmond Fed Manufacturing Index. These releases, set for the 9:00–10:00 ET window, could introduce volatility into the markets.
Recent trends in consumer confidence have suggested a dampened sentiment due to the prolonged government shutdown and slow job growth. A disappointing report could perpetuate discussions of recession and further Fed interest rate cuts, while an unexpected improvement would likely support the current risk-on sentiment.
On the corporate front, pre-market earnings from major players like Analog Devices, Alibaba, Best Buy, Dick’s Sporting Goods, J.M. Smucker, and NIO could further influence market dynamics in the early hours, especially if there are surprises in their guidance.
Technical Analysis: Higher-Timeframe Perspective
From a higher-timeframe standpoint, the daily chart reflects a completed down-swing exiting the prior weak high around 6930, retracting to the extension zone between 6525 and 6455 where buyers have demonstrated strong interest. This low now appears as a "strong low" in technical analysis terms, aligning with higher timeframe discount levels and previous demand signals. Oscillators indicate a shift from oversold conditions, currently suggesting a corrective rally rather than an immediate resumption of a downward trend.
However, trading remains constrained within a 4-hour supply band between approximately 6765 and 6815. This range is characterized by the last notable lower high and previous sell-side momentum that precipitated the significant drop to 6520. Unless price breaches the 6815 threshold, the overall swing structure continues to reflect a "lower-high" scenario, which necessitates caution for any bullish positions as they occur within a broader corrective framework.
Intraday Trading Dynamics: Expectations for the Day
Analyzing the intraday structure on the 1-hour and 30-minute charts reveals that Monday’s trading culminated in a robust upward trend from the London low of 6625 to the New York AM low of 6646, concluding with a consolidation phase just beneath the Asia session high at 6724. The cluster of highs around 6715–6725 precisely correlates with an intraday equilibrium line situated just below the upper edge of the 4-hour supply band.
Volume data indicates strong buying activity emerging from the base established at 6520–6625, tapering off as prices approached the 6715–6725 range. Further insights from the 1-hour oscillator hint at a cooling in momentum, suggesting that initial price reactions may favor mean reversion rather than an unimpeded breakout.
Looking ahead into the New York trading hours:
- Asia Session: Anticipate a trading range likely between 6700 and 6730, with potential stop raids above 6725 and minor retracements towards 6685.
- London Session: If buyers can sustain the 6685–6660 level during potential pullbacks, this could establish a foundation for another attempt at reaching the 6765–6815 supply zone during the New York data release.
- New York Open: Provided that the 6660–6645 area holds during 15-minute closes, the baseline scenario suggests a rotation into the 6765–6815 decision band between late London and early New York. A significant rejection in this zone, characterized by long upper wicks and unsuccessful 15-minute closes above 6815, would favor a pullback towards 6690–6710 by day’s end. Conversely, clear acceptance above 6815 on robust volume would pave the way for targets at 6855 and potentially back to 6930.
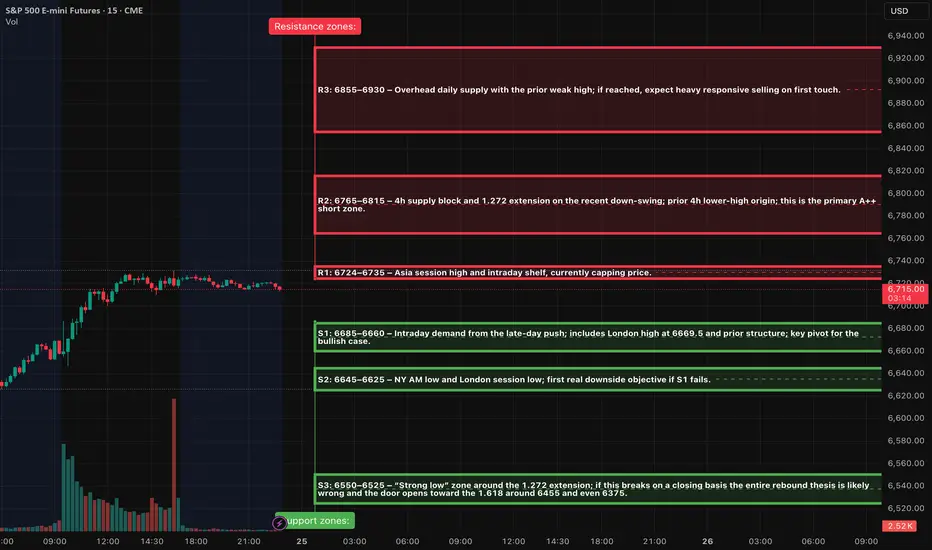
Key zones
Resistance zones:
R1: 6724–6735 – Asia session high and intraday shelf, currently capping price.
R2: 6765–6815 – 4h supply block and 1.272 extension on the recent down-swing; prior 4h lower-high origin; this is the primary A++ short zone.
R3: 6855–6930 – Overhead daily supply with the prior weak high; if reached, expect heavy responsive selling on first touch.
Support zones:
S1: 6685–6660 – Intraday demand from the late-day push; includes London high at 6669.5 and prior structure; key pivot for the bullish case.
S2: 6645–6625 – NY AM low and London session low; first real downside objective if S1 fails.
S3: 6550–6525 – “Strong low” zone around the 1.272 extension; if this breaks on a closing basis the entire rebound thesis is likely wrong and the door opens toward the 1.618 around 6455 and even 6375.
A++ Setup 1 – Short fade from 6765–6815 (Tier-1 rejection play)
Entry zone: 6780–6805, leaning as close to 6800 as price action allows after the spike and stall.
Invalidation / hard stop: 6827, above the 4h supply high and the 1.272 line; if price can close above there, the rejection idea is wrong.
Targets and management:
TP1: 6710–6690 (retest of intraday equilibrium and prior 30m shelf). That gives roughly 2R from a 6785–6800 entry with a 20–25 point stop.
TP2: 6645–6625 (London and NY AM lows cluster). This is where you want the bulk of the remaining size off if sellers stay in control.
TP3: 6550–6525 (strong low zone) only if macro tape turns risk-off; treat this as a runner target, not baseline.
A++ Setup 2 – Long continuation from 6660–6680 (Tier-1 acceptance play)
Entry zone: 6670–6680 after the sweep and reclaim; avoid catching the first knife if momentum is still heavy.
Invalidation / hard stop: 6643, below the combined London low band; a 15m close below 6645 means the demand shelf failed.
Initial risk: roughly 30–37 points depending on fill.
Targets and management:
TP1: 6724–6735 (Asia high / intraday range top). From a 6675 entry with a 30-point stop this is just over 1.5R; to keep the setup A++, bias toward entries closer to 6670 or take partials slightly higher, around 6740, where 2R is reached.
TP2: 6765–6815 (4h supply band). This is where you expect strong counter-flow; plan to remove most of the remaining size here.
TP3: 6855–6930 only if price slices through 6815 on strong volume and macro data support risk-on; in that case trail under 1h higher lows rather than using static targets.
ES (SPX, SPY) Week Ahead Analysis - (Nov 24th - 28th)Executive Overview
Equity markets, particularly the E-mini S&P 500 (ES), are currently navigating a broader weekly uptrend, yet have entered a phase of short-term correction after encountering resistance around the 6,900 to 7,000 level. Presently, prices hover near 6,660, finding support from a robust pocket in the mid-6,500s.
Recent volatility indices have surged, with the VIX now in the low 20s and the term structure exhibiting a near flat or slight backwardation. Meanwhile, key credit metrics, funding conditions, and spread behaviors remain stable, suggesting that the current market dynamics are more indicative of equity valuation adjustments and positioning realignments rather than a sign of systemic distress.
Looking ahead to the coming week, we anticipate a choppy trading environment characterized by two-sided price movements within a range of 6,520 to 6,780. Intraday strategies are likely to involve selling into strength around resistance levels R1 and R2, while seeking to capitalize on buying opportunities when prices approach support levels S1. Notably, the VIX is expected to remain elevated above its recent teens regime during this period.
A critical point of focus will be the 6,520 to 6,540 support zone. Should this area fail to hold on a daily closing basis, we could see the correction extend toward the 6,420 to 6,450 range, with further downside potential targeting the low-6,300s.
Multi-Timeframe Analysis of Market Structure
Weekly Trend: Premium/Discount
The current market structure remains characterized by higher highs (HH) and higher lows (HL). The last significant upward movement peaked just shy of 7,000, while the ongoing pullback has managed to hold above the previous weekly higher low band, located in the high-5,000s to low-6,000s range. A notable supply zone exists from approximately 6,850 to just above 7,000, identified as a weak high. Below this, a robust demand/value area spans from around 5,850 (at the 1.272 Fibonacci retracement) down to approximately 5,575 (the 2.0 Fibonacci level) from the previous major leg. On this timeframe, the E-mini S&P (ES) is trading at a premium in relation to the substantial 5,800–5,900 weekly value area. However, we have transitioned from momentum-driven expansion to a mean-reverting correction phase.
Daily Trend and Range
Shifting to a daily perspective, the structure has inverted to a short-term downtrend, marked by a lower high established near 6,900, followed by a lower swing low around the 6,520s. Fibonacci retracement levels from the last sell-off align as follows: 1.272 at approximately 6,521, 1.618 at around 6,418, and 2.0 at approximately 6,304. The 6,520s zone is precisely where price action found support. For the upcoming week, the operative daily range can be defined between 6,520–6,540 as the lower band and 6,760–6,780 as the upper band, coinciding with the previous breakdown area and recent four-hour lower high.
Four-Hour Structure
Analyzing the four-hour chart reveals a clear downward impulse from the mid-6,700s lower high to lows in the mid-6,500s, followed by a sharp rebound. A Fibonacci sequence applied to this movement suggests retracement levels of 1.272 at approximately 6,527, 1.618 at around 6,455, and 2.0 at roughly 6,376. These levels coincide with a notable demand block around the 6,520–6,540 range, identified as a "strong low," with additional liquidity found in the 6,450s and 6,370s. The recent upward movement from these lows appears corrective within the broader impulse, indicating a potential lower high is forming under the 6,680–6,700 area. Until price reclaims and maintains this band, the four-hour swing remains in a down-to-sideways trend.
Hourly Context
From an hourly viewpoint, the ES experienced a decline from approximately 6,770 to the mid-6,500s, subsequently establishing a series of higher lows as it grinds upward. Recent hourly activity shows price pressing against an overhead resistance zone located around 6,660–6,670, just beneath the Asia Session high of 6,662.5 and the New York PM high / previous day high at 6,677.5. The volume-weighted average price (VWAP) is situated near 6,609.75, with prior intraday lows clustering between 6,594 and 6,611.75. Intraday, the ES is currently mid-range, confined between support levels at 6,640–6,642 (Asia Session Low) and resistance at 6,662.5–6,677.5 (Asia Session High / New York PM High / Previous Day High / Yearly Value Area High).
Weekly and Daily Oscillators / Momentum
The weekly oscillator has retracted from overbought conditions but remains elevated, signifying a cool-off within a strong uptrend. Conversely, the daily oscillator is currently oversold and beginning to reverse, showing readings in the mid-20s with the first uptick following a significant downturn. This pattern is classic for potential bounces; however, confirmation of a full trend reversal is yet to materialize.
Key levels and zones
Resistance (R-side)
R1: 6,662–6,678
• Components: Asia Session High 6,662.5, NYPM High / PDH 6,677.5, Y-VAH also anchored at 6,677.5, plus a clear 1H/30m shelf.
• Significance: This is the nearest control ceiling; it capped Friday’s rebound and marks the boundary between neutral intraday and more aggressive squeeze potential.
• Role: First place to fade “pop-and-fail” wicks for short A++ plays, and the first area that must be decisively reclaimed for bulls to press a larger squeeze.
R2: 6,760–6,780
• Components: Prior 4H lower high and breakdown zone; 1H HH before the large red impulse bar; sits just below a dense daily supply band.
• Significance: A retest of broken support turned resistance. Acceptance back above here would suggest the entire recent flush was a failed breakdown, opening the path to retest the highs.
R3: 6,895–6,945
• Components: 1H fib extensions 1.272 ≈ 6,895.75 and 1.618 ≈ 6,942.50, plus prior weekly weak high / supply band just under 7,000.
• Significance: This is the larger-timeframe cap. Reaching this zone in one week would likely require either a decisively dovish Fed tone or very strong data.
---
Support (S-side)
S1: 6,520–6,540
• Components: Daily fib 1.272 ≈ 6,521.25, 4H fib 1.272 ≈ 6,527.25, recent swing low cluster and strong demand band.
• Significance: This is the primary weekly pivot for the current correction. First major A++ long location if it’s flushed and reclaimed during liquid hours.
S2: 6,418–6,455
• Components: Daily 1.618 ≈ 6,418, 4H 1.618 ≈ 6,455.50, plus a “strong low” label in that region.
• Significance: This is deeper discount inside the current swing, where larger timeframe players would be expected to defend aggressively if the broader uptrend is to remain intact.
S3: 6,304–6,376
• Components: Daily 2.0 ≈ 6,304.00, 4H 2.0 ≈ 6,376.25, lower edge of the current visible demand block.
• Significance: If price reaches here this week, the market is in a full-fledged risk-off extension, but still within the context of the broader weekly uptrend.
S4: 5,850–5,575 (weekly)
• Components: Weekly fibs 1.272 ≈ 5,850.75, 1.618 ≈ 5,721.00, 2.0 ≈ 5,577.50.
• Significance: True structural weekly demand; a tail-risk destination if macro or credit conditions were to deteriorate sharply.
---
Volatility Backdrop
The VIX spot closed at approximately 23.4 on Friday, having surged beyond 26 earlier in the week, marking the highest levels observed since spring. The VIX futures curve has shifted to a flat or mildly backwardated structure, with near-term contracts hovering around 22.9 for late November and extending into subsequent months. Meanwhile, rates volatility (MOVE) is situated near 78–79, close to its historical average, indicating it is not in crisis territory.
The volatility complex is signaling a notable expectation of an equity shock, although it does not reflect panic in the funding or rates sectors. The flat to slightly backwardated volatility curve suggests potential for larger intraday swings and gap risks, while also presenting significant reward opportunities when market entries align with critical price levels.
Options and Positioning
The total put/call ratio currently stands at approximately 0.87, with the index put/call ratio around 1.03, and exchange-traded products (ETP) at about 1.28. In contrast, the equity-only put/call ratio is at a lower 0.56. The 10-day moving average of the total put/call ratio is approximately 0.90, which is not indicative of panic extremes. The SKEW index is around 148—elevated, yet falling short of the extreme levels (150–160+) that typically signal substantial tail-risk hedging.
Institutional hedging remains present but lacks urgency; there is a distinct preference for put options in indices and ETFs, while single-stock options continue to skew toward calls. Coupled with a VIX in the low-20s and a near-flat curve, this indicates that dealers are likely moderately short gamma at current strike prices. Consequently, price movements beyond key levels may extend further than usual before reversion occurs. This inference, drawn from the volatility and put/call configurations, does not represent a direct measurement.
Market Breadth and Internals
Earlier in the week, the NYSE experienced a significant imbalance, with decliners outnumbering advancers by more than 3:1, alongside a higher count of new lows than new highs, a classic indicator of distribution. However, by Friday, the breadth reversed sharply, with approximately 2,237 advancers against 548 decliners on the NYSE. Nevertheless, the McClellan Oscillator remains negative (~-72), and the Summation Index is in a downward trajectory, suggesting ongoing repair rather than the emergence of a new bull trend. Defensive sectors, including health care and consumer staples, have outperformed, while tech and speculative AI stocks led the recent selloff.
The market has transitioned from a clear uptrend to a choppy corrective phase characterized by distribution. The activity on Friday, while indicative of an oversold breadth thrust, has not confirmed a market bottom.
Credit and Funding
The high-yield ETF (HYG) is trading around 80.3, only slightly below recent highs, indicating no signs of disorderly selling. The US high-yield option-adjusted spread (OAS) is near 3.17%, and B-rated high-yield OAS is about 3.3%, both well below long-term averages (>5%) and only marginally above recent tight levels.
Conclusion:
Credit markets display relative calm, reinforcing the notion that the recent weakness in equities is driven by valuation and sentiment rather than a funding crunch.
Sentiment and Crowd Positioning
Recent AAII survey results indicate roughly 32.6% of respondents identify as bulls, while 23.9% classify as bears. This results in a negative bull-bear spread of about -11%, contrasted with a long-run average of +6%. The combination of an elevated VIX, a negative bull-bear spread, and moderate put/call ratios reflects a climate of pessimism without full-fledged capitulation.
Practical Takeaway:
There exists potential for an upward squeeze if macroeconomic headlines shift towards dovish sentiment. However, a prolonged risk-off environment remains possible if critical support levels like S1 and S2 break.
Cross-Asset and Global Risk Tone
Global equities experienced their most significant weekly pullback since early this year, with the MSCI World Index declining by roughly 3%. Europe’s Stoxx 600 recorded its largest weekly drop since summer, primarily driven by weakness in the tech sector and increased volatility. The cryptocurrency market is in a full risk-off stance, with Bitcoin dipping to a seven-month low before rebounding around $84k, accompanied by sentiment indicators reflecting extreme pessimism and heavy liquidations, now followed by a weekend bounce from oversold RSI levels.
Relative Risk Tone:
The Nasdaq-100 (NQ) remains weaker compared to the S&P 500 (ES), aligning with the decline in tech and AI sectors, while defensive and value-oriented sectors maintain resilience. Overall, the cross-asset narrative suggests a risk-off tone, yet not systemic in nature—exactly the backdrop where well-defined level trading is most effective.
Macro and Data Calendar
The upcoming holiday-shortened week is set to unveil a series of delayed U.S. economic data, including September retail sales, PPI, Core PPI, home prices, pending home sales, inventories, and consumer confidence on Tuesday, followed by jobless claims, durable goods, Chicago PMI, and the Beige Book on Wednesday. The prior government shutdown has postponed key GDP and inflation reports, heightening uncertainty around the Fed's December decisions. Federal Reserve officials exhibit divided opinions about another rate cut in December; some advocate for a pause with inflation near 3%, while others, including at least one governor and the NY Fed president, lean toward support for an additional 25 basis point reduction. Market odds for a December cut have shifted within a ~50–70% range, depending on daily fluctuations.
Classification of the Recent Move:
This market dynamic appears primarily as a reset in valuations and positioning following the exuberance surrounding AI and tech, exacerbated by data-related uncertainty rather than stemming from a definitive “data shock” event.
13. Two A++ setups (for the coming sessions)
These are plan-level plays, to be executed only if price action and vol conditions line up as described.
A++ Setup 1: R1 Rejection Short
Trigger
Inside NY AM or the first hour of NY PM:
1. 15m candle wicks above 6,670–6,675 and closes back under 6,665.
2. 5m prints a lower high beneath that wick, closing back below ~6,660.
3. 1m breaks down through the intraday shelf near 6,655 with increased selling volume / negative delta.
Execution
• Entry: around 6,660–6,665 on the first 1m pullback that fails under the broken shelf.
• Initial stop: above the wick high, e.g. 6,690 (adjust to the actual 15m high but keep risk in the 20–25 point range).
• Risk (example): entry 6,665, stop 6,690 → 25 pts.
Targets
• TP1: 6,615–6,620 (VWAP / prior intraday shelf) → about 2R (50 pts) from a 25-pt stop.
• TP2: 6,540–6,550 (upper edge of S1 / prior congestion) – roughly 4R.
• TP3 (runner): 6,520–6,530 (core of S1 cluster) – 5R+ if reached.
A++ Setup 2: S1 Flush-and-Reclaim Long
Trigger
15m candle flushes below 6,530, ideally tagging 6,520–6,525, with a long tail and closes back above ~6,535–6,540.
5m shows a higher low above the 15m wick low, with real bids stepping in and volume picking up.
1m pushes back through 6,545–6,550 and holds, turning that band into a floor.
Execution
• Entry: 6,545–6,550 on the first 1m pullback that holds above 6,540 after the reclaim.
• Initial stop: below the 15m flush low, e.g. 6,515–6,520.
• Example parameters: entry 6,550, stop 6,520 → 30-pt risk.
Targets
• TP1: 6,595–6,600 (local shelf / prior L at 6,594 and ONH/VWAP neighborhood) → about 2R (60 pts) from a 30-pt stop.
• TP2: 6,662–6,678 (R1 band) – the same ceiling from Setup 1; that’s roughly 4R+ from the entry.
• TP3 (runner): 6,760–6,780 (R2) if data and vol cooperate, giving 7R+ potential.
If that microstructure doesn’t show up, downgrade each play from A++ to stand-aside – let someone else fight in the middle of the range and keep your capital for when the levels truly light up.
Good Luck !!!
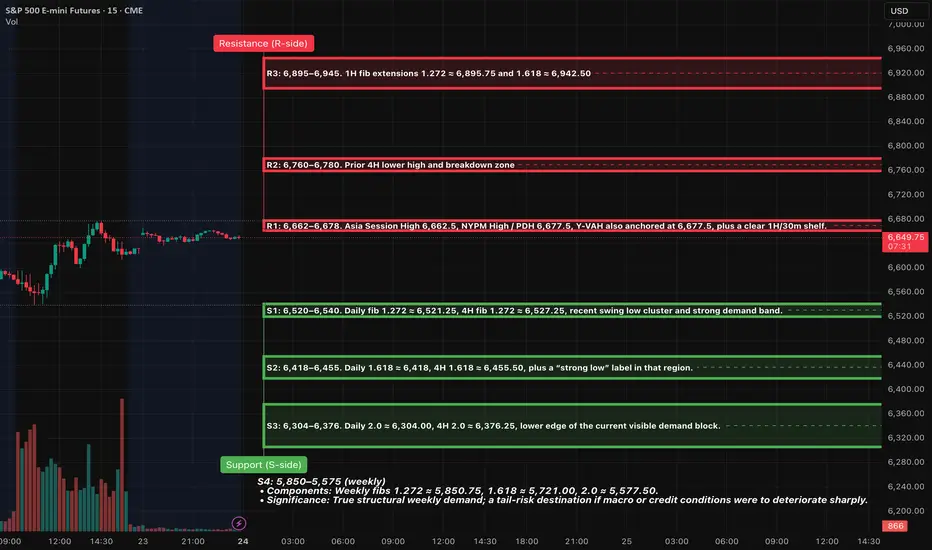
ES (SPX, SPY) Analysis, Levels, PA Forecast, Setups Fri (Nov 21)Analyzing Today’s Sharp Market Decline
The significant selloff observed today was not an arbitrary event. The day began with a robust rally following another impressive earnings report in the AI-chip sector, which propelled futures sharply upward and triggered a short squeeze in the Nasdaq. However, the release of a stronger-than-anticipated jobs report shifted the market's sentiment. While hiring showed signs of rebounding, the unemployment rate also ticked higher, undermining the prevailing narrative that the Federal Reserve would soon lower interest rates.
This development served as a stark reminder of the ongoing restrictive monetary policy, coupled with slowing economic growth and exorbitant valuations in the tech sector. Major investment funds capitalized on the morning’s strength in AI and large-cap stocks as an opportunity to reduce their risk exposure. Additionally, systematic trend-followers faced compulsion to sell once the S&P 500 fell below critical support levels.
The environment for high-beta assets, including cryptocurrencies, is already in a “reset” phase, which left little incentive for dip-buying at lower price points. As the E-mini S&P 500 futures broke through the previous day’s support levels, the situation escalated into a full liquidation. This perfect storm involved trapped long positions from the morning breakout, stop-loss orders falling into execution beneath yesterday’s lows, and mechanical selling, culminating in the largest intraday reversal since the spring.
Market Outlook
The current market sentiment is skewed bearish as the ES remains entrenched below the critical 6,660 to 6,700 range. The price is hovering near a significant demand zone established around the lows of the previous trading day and today’s New York session. While we can expect some upward bounces, these movements appear to be temporary rallies within an ongoing downtrend, rather than indicators of a potential new upward leg.
Market Analysis: Is This the Beginning of a Downtrend or a Temporary Shakeout?
In the recent developments within the E-mini S&P 500 (ES) on the daily timeframe, we’ve observed the formation of a distinct lower high following the recent all-time peak. This shift has seen prices breach the last identified higher-low area, establishing a new narrative. The sequence has transitioned from a higher high to a lower high, culminating in a movement into prior demand zones marked by increased volume, all while momentum appears to be rolling over.
On the four-hour chart, the prevailing trend reflects a series of lower highs and lower lows. The recent selloff has further entrenched this trajectory into the discount zone, now signaling proximity to the next Fibonacci retracement target below.
While momentum indicators have already dipped from overbought conditions, they have not yet reached deeply oversold thresholds, indicating potential for another leg downward following any short-term corrective bounce.
From a broader perspective, the long-term trend remains positive; however, a short- to medium-term corrective phase appears to be in play. Today’s market dynamics suggest we may be in the midst of this corrective leg rather than witnessing the final downturn.
As prices have recently entered a significant demand zone, a bounce lasting one to three sessions—or a period of sideways consolidation—seems likely before any potential further decline.
In summary, while current conditions favor a move towards lower prices in the days ahead, the market likely anticipates a "lower after a bounce" scenario rather than an immediate and steep decline.
Key resistance zones
Resistance is written as bands, not single ticks.
R1: 6,589–6,600
This band sits around the current Asia-session high and the underside of today’s New York low. It is the first lid above price. If rallies stall here, the tape stays heavy and favors another test of the lows.
R2: 6,634–6,658
This is the main breakdown zone from today, centered around the New York afternoon high and the upper edge of the late-session range. As long as ES trades below this shelf, the short-term downtrend remains intact and every bounce is suspect.
R3: 6,760.5–6,791.25
This band covers the New York morning low-to-high range and the origin of the big sell leg. If price ever retests this area and fails, it is a prime region for larger swing shorts. Only sustained trade and closes above this pocket would suggest the current corrective leg is ending.
---
Key support zones
S1: 6,575–6,552
This is the immediate floor combining the Asia-session low, New York afternoon low, and prior-day value low. It is where we are effectively trading now. Expect reactive bounces and stop-runs here, as both sides are active.
S2: 6,525–6,509
This is the next downside magnet if S1 breaks cleanly. It aligns with a fib extension and 4-hour demand. A decisive move into this region would represent the next step down in the correction.
S3: 6,430–6,418
Deeper extension and prior higher-timeframe demand. If the correction matures into a more serious pullback over several sessions, this pocket becomes a reasonable medium-term downside destination.
A++ Setup 1 – Short from R2 supply (continuation short)
Direction: Short
Entry zone: 6,638–6,648
SL (hard stop): 6,678
TP1: 6,588
TP2: 6,552
TP3: 6,515
Invalidation (structure):
If we get a 15m full-body close above 6,675, treat the short idea as invalid and stand aside; market is likely shifting into a squeeze toward 6,700+ instead of extending the down leg.
---
A++ Setup 2 – Quick-reclaim long from S1 demand (counter-trend bounce)
Direction: Long
Entry logic: need a flush then reclaim
Entry zone (after reclaim): 6,562–6,568
SL (hard stop): 6,538
TP1: 6,610
TP2: 6,638
TP3: 6,660
Invalidation (structure):
If price breaks below 6,552 and 15m closes stay below 6,545 without a fast reclaim, the bounce idea is invalid; then you wait for the deeper S2 zone instead of forcing longs here.
Good Luck !!!
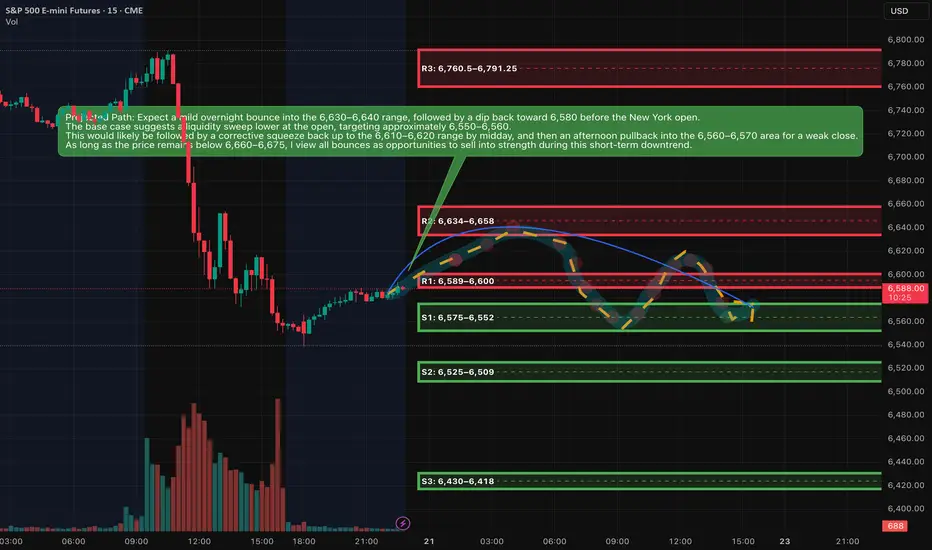
ES (SPX, SPY) Analysis, Key-Zones, Setups for Thu (Nov 20th)Market Bias Analysis
The current short-term bias is constructively bullish, yet it remains contingent on upcoming events. Recent momentum has been bolstered by Nvidia's exceptional earnings report and a significant intraday reversal in the E-mini S&P 500 (ES). As long as the 6,670–6,680 range holds during any pullbacks, the path of least resistance appears to be upward. It is important to note that the broader daily trend is still bullish, unless we see a decisive breach below the key demand zone of 6,520–6,510 in the ES.
Market Overview
In a notable shift following a four-day decline, today's trading session exhibited a renewed bullish sentiment. The E-Mini S&P 500 (ES) printed a robust green daily candle, bouncing off a low of approximately 6,622.00 yesterday to close near 6,740.
From a technical perspective, the daily chart reveals that the recent selloff has established a lower high without breaking the prior significant higher low. The reaction low remains comfortably above the daily 1.272 extension cluster situated around 6,521.25. On the 4-hour chart, the price action has transitioned from a pattern of lower lows to a new higher low, currently pushing into the Price Quotient Median (PQM) and Price Quotient High (PQH) band, just below previous 4-hour supply levels. Observing the 1-hour chart, today's trading reflected a definitive trend day upward, characterized by a consistent series of higher lows and higher highs, culminating the session near the 1-hour 1.272 Fibonacci extension at 6,743.75.
Macroeconomic factors played a crucial role in this market turnaround, particularly after Nvidia reported stunning Q3 earnings that exceeded expectations, generating approximately $57 billion in revenue. The company’s strong AI-driven outlook and positive after-hours performance alleviated concerns that the recent downturn in technology stocks signified the onset of a broader unwinding of the AI bubble. This development contributed to a rally in index futures as the session drew to a close.
Nonetheless, the overarching theme remains one of valuation pressures and interest rate concerns. Despite breaking a four-session losing streak, market participants are poised for tomorrow’s data, which will be pivotal in shaping the Federal Reserve's policy trajectory moving forward.
Scheduled Events (Tomorrow – Thursday, Nov. 20, 2025)
Tomorrow’s docket is heavy and directly relevant for ES:
• 8:30 a.m. ET – September Employment Situation (delayed jobs report)
The September nonfarm payrolls and unemployment rate, postponed by the government shutdown, are finally released. This is the only full jobs report the Fed will have before its December meeting, and markets are treating it as a major verdict on the labour market.
• Other U.S. data (during the morning/early afternoon)
Various calendars flag building permits / housing data, regional manufacturing (e.g., Philadelphia Fed), and existing home sales clustered through the U.S. session – all secondary to the jobs report but able to add fuel if they confirm or contradict the labour story.
• Fed speakers / meetings
• Chicago Fed President Austan Goolsbee has a scheduled fireside chat around midday (12:40 p.m. ET).
• The Fed also has a closed Board meeting at 1:15 p.m. ET and a two-day Cleveland Fed financial-stability conference that can generate headlines.
Net: the jobs report is the main event; Fed comments will colour the move rather than drive it on their own.
Setups (A++ Concepts)
These are two high-conviction, rule-style ideas you can plug into your own framework. Price levels are exact from your charts.
A++ Setup 1 – Continuation Long from Value Pocket
Entry trigger concept:
Look for a sweep into the chosen band (e.g., wick into 6,690–6,695 or down into 6,663–6,668) followed by a strong 15m/5m bullish close back above 6,700. That shows buyers defending value and rejecting a deeper rotation into S3.
Risk / invalidation:
Structural invalidation if ES closes the hour below 6,652.50 (Y-POC) and cannot reclaim 6,668. In practice, a tight stop can sit just under 6,652.00 if entering from 6,690–6,705, or under 6,645.00 if using the deeper S2 pocket.
Targets:
• TP1: 6,743.75 (1H 1.272)
• TP2: 6,777.00 (1H 1.618)
• TP3: 6,813.50 (1H 2.0)
---
A++ Setup 2 – Short Fade from 1H Extension Cluster
Entry zone:
Primary sell pocket: 6,777.00–6,813.50
(1H 1.618 to 2.0 extension cluster.)
Risk / invalidation:
Structural invalidation above 6,825–6,830 (clear 1H/4H acceptance beyond the 2.0 extension).
A practical stop can sit around 6,828.00 if entering inside the band.
Targets:
• TP1: 6,743.75 (1H 1.272 / prior extension)
• TP2: 6,683.50–6,690.00 (NYPM high / S1 top)
• TP3: 6,659.00–6,664.75 (VWAP/value pocket S2)
Narrative:
If Nvidia’s beat triggers a euphoric push straight into the upper fib level but the tape immediately rejects that strength, the market is saying “good news already in the price.” This setup expresses the view that the real gravity is lower, back toward value and potentially into S3 if macro data disappoint.

ES (SPX, SPY) Analyses, Key Zones, Setups for Wed (Nov 19th)Market Analysis: A Shift in Momentum for ES
In today's market, the daily chart for the E-mini S&P 500 (ES) reveals a notable shift in momentum, characterized by a sequence of price action that signals a potential downtrend. Previously, we observed a high, followed by a lower high, and today's movement has decisively broken through the last remaining support at the higher-low shelf. This change comes after a rejection from the recent lower-high zone, situated just below the 6,900 mark, followed by a retreat through the crucial 6,700 threshold. What initially appeared to be a bullish uptick is now consolidating into a corrective downswing.
Today's significant drop marks the continuation of this emerging downward trajectory. Prices breached intraday support around 6,675 to 6,700, slid past the prior higher-low region near 6,635, and ultimately settled atop the initial daily demand zone. Notably, the selling volume during this decline expanded compared to previous sessions, underscoring that this movement reflects genuine market participation rather than mere fluctuations.
While the longer-term outlook remains bullish, reflected in the weekly trend, the daily and four-hour charts currently indicate a pronounced short-term downtrend. Key indicators include the formation of a lower high, the breach of the previous higher-low, and a liquidity run to the downside toward the extension cluster. As we move forward, this developing bearish scenario suggests potential for further declines in the coming sessions, though we are positioned within local demand territory, indicating that bounces and two-directional trading are likely in the near term.
Key Resistance Zones
Resistance 1: 6,637
This level represents today’s late-session swing high on the 30-minute chart, denoted as the S-session high (S.H 6,637). It serves as the initial resistance point above the current market price.
Resistance 2: 6,679.75 – 6,687.50
A cluster of highs, with NYAM.H marked at 6,679.75, LO.H at 6,685.75, and NYPM.H at 6,687.50, forms a critical intraday supply pocket. This region represents the primary A++ short zone should the price experience a bounce.
Resistance 3: 6,700 – 6,720
Above the NY session high band, the 4-hour chart highlights a previously broken support shelf and local supply just below 6,720. Any movement back into this area would likely be corrective within the ongoing downswing unless the E-mini S&P can close and hold a daily candle above this range.
Higher-Timeframe Cap:
Any price action remaining below the recent daily lower-high zone—situated near the last significant LH before the drop—maintains a bearish bias for the larger swing. A definitive daily close above this lower-high would be necessary to negate the current short-term downtrend.
---
Key Support Zones
Support 1: 6,627.50 and 6,614.75
The AS.L level is printed at 6,627.50, with the NL.L around 6,614.75 on the 30-minute chart. Together, these levels form the initial local support shelf just beneath the current price.
Support 2: 6,606.50 – 6,603.25
Marked by NYPM.L at 6,606.50 and NYAM.L at 6,603.25, this band serves as the next area of resting liquidity from today’s trading sessions. A clean break and sustained move below this range could pave the way for the Fibonacci targets below.
Support 3 (Major Fibonacci Cluster): 6,541.50 – 6,509.00
On the 1-hour chart, the 1.272 Fibonacci level is found at 6,541.50, while the 4-hour chart places it at 6,509.00. The daily chart marks the 1.272 at 6,521.25, creating a significant demand box from approximately 6,541 down to 6,509, with 6,521 serving as a mid-pivot. This is the pivotal "bounce or break" zone.
Support 4 (Deeper Extension Pocket): 6,501.75 – 6,458.00
The 1-hour chart identifies the 1.618 Fibonacci extension at 6,501.75 and the 2.0 extension at 6,458.00. The 4-hour chart aligns the 1.618 at 6,429.25 and the 2.0 at 6,341.50, with the daily chart placing the 1.618 at 6,418.00 and the 2.0 around 6,304.00. The initial focus for tomorrow is the 6,502–6,458 region. Should the 6,541–6,509 band fail, this area becomes a strong magnet where a more pronounced short-covering bounce is likely.
The definitive structural line on the downside is the cumulative daily 1.618–2.0 cluster, ranging from approximately 6,418 down to 6,304. A decline to this range could signify a major correction leg rather than a mere shallow pullback.
A++ SETUP 1 — REJECTION SHORT FROM NY HIGH BAND
Trigger:
15m: candle wicks into 6,680–6,688 and closes back below about 6,675.
5m/1m: a failed attempt to push higher (lower high) after that rejection.
Entry:
Aggressive: enter short 6,678–6,682 after the 15m rejection close and 1m fails to make new highs.
Conservative: limit sell in 6,680–6,685 on a controlled retest from below.
Stop (hard invalidation):
Around 6,698.00 above the band and intraday highs (about 16–20 points of risk if filled 6,678–6,682).
Targets:
TP1: 6,637.00 (session swing high). From 6,680 entry with 6,698 stop ≈ 2.3R.
TP2: 6,606.50 – 6,603.25 (NYPM.L / NYAM.L shelf), ≈ 4R from 6,680 entry.
TP3: 6,541.50 – 6,521.25 (top of fib demand cluster), campaign-style extension.
A++ SETUP 2 — EXHAUSTION LONG FROM FIB CLUSTER DEMAND
Trigger:
15m: price trades below 6,530, tags 6,521–6,509, then closes back above about 6,530 (wick through, body back up).
5m/1m: a higher low forms above roughly 6,520 after that reclaim; sellers fail to push back below the cluster.
Entry:
Aggressive: 6,525–6,535 on the first higher low on 1m/5m after the 15m reclaim of 6,530.
Conservative: limit buy near 6,525 on a controlled retest into the top of the cluster after the first reaction.
Stop (hard invalidation):
Around 6,497.00 under the bottom of the cluster and recent swing low (≈ 30–38 points of risk if entered 6,525–6,535).
Targets:
TP1: 6,595–6,600 (broken structure and local VWAP zone). From 6,530 entry with 6,497 stop ≈ 2R.
TP2: 6,637.00 (S-session high and first major resistance).
TP3: 6,679.75 – 6,687.50 (NYAM.H / LO.H / NYPM.H band), where a bounce can turn into a full squeeze.
Upcoming Economic Indicators
For tomorrow's trading session (Wednesday, U.S. time), traders should keep an eye on several key economic releases:
- At 8:30 AM ET, the U.S. will release Housing Starts and Building Permits for October, along with import/export price indices. These figures are vital for gauging growth, especially after a series of subdued permits and erratic starts.
- At 10:30 AM ET, the EIA Weekly Petroleum Status Report, alongside crude inventory data, is expected to influence energy markets and broader risk sentiment.
- Later in the afternoon, markets will be attentive to FOMC minutes and remarks from New York Fed President John Williams, both of which could impact rate-cut expectations based on the overall tone relative to recent communications.
Good luck !!!

ES (SPX, SPY) Analysis, Key Zones, Setups for Tue (Nov 18th)ES experienced a notable decline, concluding the day with a sharp downturn but managed a late-session rebound off a significant demand zone. At this juncture, it appears to be a robust corrective phase within an overarching uptrend, with a reasonable probability of a bounce or a range-bound trading day ahead, barring any unexpected developments from data releases or commentary from Federal Reserve speakers.
Looking ahead to tomorrow, November 18, 2025, the economic calendar is unusually packed for a Tuesday, as various U.S. data are set to be released following delays caused by a government shutdown. Key indicators to watch that could influence ES during the New York session include the import and export price indexes for October at 8:30 AM ET, industrial production and capacity utilization figures also for October at 9:15 AM ET, and the NAHB housing market index for November at 10:00 AM ET.
Additionally, several Federal Reserve officials, including Barr, Waller, Williams, and Kashkari, are scheduled to speak throughout the day. The market is particularly attuned to their insights regarding the likelihood of another rate cut, especially in light of the recently released October FOMC minutes and this week’s jobs report.
Given the abundance of potential market-moving information, I would consider the period from 9:15 to 10:15 AM ET as a critical window for "headline risk" tomorrow.
The recent market decline can largely be attributed to macroeconomic factors:
The S&P 500 cash index ended the day down approximately 0.9%, with the Dow falling around 1.2% and the Nasdaq declining by about 0.8%. This pullback has moved the indices further away from their all-time highs established last month.
The selling pressure was particularly acute among mega-cap technology stocks and the AI sector. Major players such as Nvidia, Apple, Palantir, and AMD faced heavy trading as investors began to question whether the recent surge in tech stocks, driven by AI enthusiasm, had outpaced underlying fundamentals ahead of Nvidia’s earnings release on Wednesday.
Market sentiment was further dampened by a noteworthy prediction from Stifel's chief strategist, who suggested a potential 5% drop in the S&P 500, targeting a level around 6,350 in the coming months. This outlook was based on concerns regarding high valuations and uncertainties surrounding the Fed’s future policy as delayed economic data begins to materialize.
Interestingly, the yield on 10-year Treasuries dipped slightly towards ~4.13% , indicating that today’s selloff was more of a de-risking/profit-taking maneuver specific to equities rather than a reflection of widespread risk aversion typically signaled by bond market movements.
From a technical perspective on the ES futures:
Intraday trading patterns reflected a continuation of last week’s trend of lower highs and lower lows. Prices faltered near the 6,800–6,805 mark during the overnight session before entering a clear downtrend through the morning. The volume accelerated during the late-morning selloff, ultimately reaching a low around the 6,658–6,660 band, which coincides with established daily demand zones.
Following this drop, we observed a pronounced shift in behavior: significant buying volume surged at the lows, leading to a rejected price at that demand zone and a controlled short-covering rally back above 6,690, approaching the 6,700–6,705 range as the day closed. The Nasdaq exhibited a similar trajectory, with a heavy selloff subsequently followed by a recovery.
Structurally, today’s activity reflects:
A strong continuation of downside movement, stemming from last week’s lower-high structure and macro-driven de-risking, culminating in a liquidity flush into a previously identified demand pocket followed by short-covering toward the close.
From a broader perspective, is this the beginning of a genuine downtrend?
On the daily chart, ES remains within a larger uptrend originating from the summer lows. A higher peak above 6,900 was established in late October, with the current pullback representing a decline of approximately 3–4% from that peak. Today's trading reached the 6,650–6,670 support region, which previously served as a vital higher low space, before closing back above it. Daily momentum indicators have rolled over but are beginning to flatten, indicating they are not yet deeply oversold.
In contrast, the shorter-term 4-hour and 1-hour views present a more bearish outlook: a sequence of lower highs has formed, and the retest of prior higher low levels appears to be underway. Short-term moving averages have shifted downward, and 4-hour momentum remains negative, albeit with initial signs of a slight positive divergence compared to new price lows.
In summary:
I interpret this phase as a significant corrective downswing within a larger uptrend rather than the onset of a new bear market. The potential for a more substantial correction exists, particularly if Nvidia’s earnings disappoint or if the run of delayed economic data proves weak. However, the day's trading indicates more of a necessary adjustment rather than the onset of a catastrophic decline, aligning with institutional views that this pullback signifies a "healthy reset" following a robust advance, rather than an indication of a market bubble bursting.
Should ES close below the 6,650 mark on a daily basis and subsequently begin to print lower highs under that level, I would increase my assessment of the risk of a transition into a more enduring downtrend, with targets around the 6,350–6,400 range over the coming weeks, echoing Stifel's projections. For the time being, however, buyers continue to defend this crucial daily support zone.
Key zones to monitor for tomorrow, in the futures market:
I identify the following support zones:
6,658–6,650: This region marks today’s New York PM low and aligns with the prior day’s low. It serves as the first critical intraday support level. As long as ES maintains closes above this area on 1-hour and 4-hour charts, I consider the movement to be a corrective phase rather than a broader downtrend.
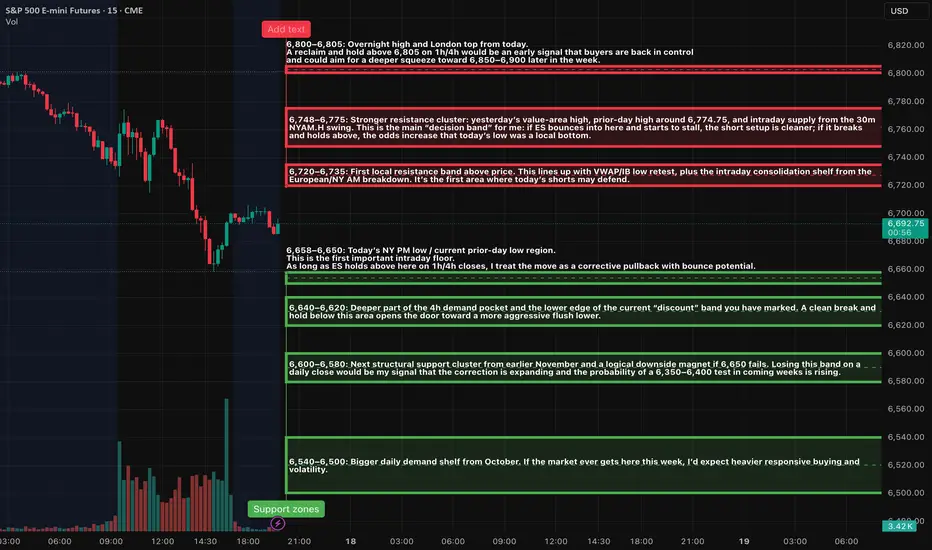
ES (SPX, SPY) Analysis for Week Ahead (Nov 17th - 21st)Market Analysis: ES1 - Navigating Recent Price Action and Upcoming Economic Catalysts
Current Price Context:
The E-mini S&P 500 (ES1) is currently trading in the range of 6,755 to 6,785, following a sharp pullback from the 6,880 to 6,900 peak and a notable rebound off the 6,650 levels. While both the weekly and daily structures exhibit an overarching uptrend characterized by higher highs and higher lows, we are presently experiencing a mid-pullback phase, with prices resting below a newly established supply zone spanning 6,850 to 6,900. Importantly, we remain above the key demand shelf situated around 6,650 to 6,670.
Big Picture Overview: Weekly and Daily Trends
- Weekly Analysis: Over recent months, ES has ascended from approximately 6,000 to the 6,900 level. The past few weeks have seen a new high printed, followed by a red candle signaling a pullback towards mid-range levels. Despite this corrective move, we maintain a buffer above the preceding weekly low near the 6,500 to 6,550 range, affirming the uptrend. The current price action appears more as a corrective pause rather than a definitive peak.
- Daily Perspective: After reaching a new high just shy of the 6,900 mark, the market retreated into the mid-6,600s before bouncing back. Recent daily candles indicate a phase of consolidation within the 6,730 to 6,780 range, characterized by wicks on both ends and diminishing body sizes, alongside reduced volume compared to earlier volatility. Oscillator indicators are retreating from overbought conditions but appear to be stabilizing, suggesting a digestion phase rather than a full-scale momentum breakdown.
Shorter Timeframe Analysis (4-Hour and 1-Hour):
- On the 4-hour chart, a completed downward impulse from around 6,880 to the low 6,650s has been observed, with the price touching the 1.272 Fibonacci extension at approximately 6,653. Additional Fibonacci levels below include 6,597 (1.618) and 6,536 (2.0). The price action around the 1.272 extension has prompted a robust response, featuring significant green candles and increased volume, establishing a base between 6,700 and 6,800.
- On the 1-hour chart, the market exhibits a minor uptrend (from lower lows to higher highs) that has encountered resistance around 6,780. Currently, price action is consolidating near a pivot level of 6,750, leading to the establishment of a balance range between 6,720 and 6,780 as we head into Monday.
Summary: The broader context remains bullish on higher timeframes, with a corrective phase taking root on the medium timeframe, while the short-term landscape indicates balance. This scenario represents a classic "trend pullback parked on key support," with next week's developments likely steering us either back toward the highs or engendering a deeper test of 6,600 or 6,550, contingent on forthcoming economic data and Fed commentary.
Macro and Event Landscape: A Busy Week Ahead
The recent U.S. government shutdown has resulted in a considerable backlog of economic data releases. Market participants will be closely monitoring delayed payroll data, along with other significant indicators such as industrial production and housing metrics that are being released simultaneously. This aggregation of data is anticipated to introduce intraday volatility, particularly during the 8:30 to 10:00 AM ET windows.
Key Economic Indicators to Watch:
- Core Data Releases: In the week of November 17–21, critical releases include:
- Empire State manufacturing index
- Import and export price indices
- Industrial production and capacity utilization figures for October
- Housing starts and building permits scheduled for mid-week
- Additional delayed labor data later in the week as agencies address the backlog.
- FOMC Minutes and Fed Commentary: The release of the FOMC minutes from the late October meeting will communicate the Fed's confidence in the recent improvements in inflation and its openness to potential rate cuts in December. A lineup of Fed speakers is set to take the stage, likely influencing market sentiment and causing price reactions based on their comments.
- Corporate Earnings: Noteworthy earnings reports from Nvidia and major retailers, including Walmart, are on the calendar. Nvidia's performance will be scrutinized as a barometer for the AI segment, while insights from retail giants will provide a glimpse into consumer health as the holiday season approaches. Strong results coupled with optimistic guidance tend to buoy ES, while any disappointments could weigh on index futures, especially given the concentrated leadership from a handful of major tech stocks.
Market Sentiment and Positioning: Rate-cut expectations for December have decreased to about 40%, leaving investors cautious but not overly alarmed. This environment allows for potential relief rallies if data and Fed sentiments tilt favorably, while a series of negative reports may trigger a notable risk-off sentiment.
Conclusion: The upcoming week is poised to be event-driven, lacking a singular "mega" release like CPI but rather presenting a series of medium-to-large catalysts (Fed minutes, late payrolls, industrial production, housing statistics, Nvidia, and Walmart). Traders should be prepared for choppy conditions and liquidity fluctuations around the release times, with clearer directional moves anticipated between these events.
KEY ZONES – RESISTANCE
Resistance 1: 6,780–6,800
Immediate intraday cap formed by the last 1h high and the 4h supply block from Friday. This is the ceiling that has repeatedly turned price in the last session. A 1h or 4h close above 6,800 would confirm that buyers are back in control and likely aim for 6,850+ fairly quickly.
Resistance 2: 6,840–6,880
This is the core of the recent 4h supply and sits just below the prior daily high. It’s where the last strong sell program launched. If price trades into this pocket on light volume and stalls, that favours a lower-high top and another rotation back toward 6,720–6,700. If the tape pushes through decisively, shorts will be forced to cover.
Resistance 3: 6,900–6,930
Recent swing high / weak high area on daily. It’s the obvious target for any early-week squeeze. If this zone gets cleaned out and holds on the retest, the uptrend resumes and we can start talking about higher fib extensions and a run toward the 7,000 handle. A sharp rejection here, especially around Fed minutes or Nvidia earnings, would fit a double-top pattern and could kick off a deeper pullback leg.
Resistance 4: 7,050–7,200
This band lines up with the daily fib projection cluster (around 7,180–7,325) from the prior leg and the upper edge of the larger weekly supply. It’s not expected to be reached immediately, but if data and earnings line up bullishly, this is the swing target area for longs initiated off the 6,650–6,700 support.
KEY ZONES – SUPPORT
Support 1: 6,720–6,740
This is Friday’s late-day base and Sunday evening pivot zone, sitting right around current price. It lines up with the 1h equilibrium where price has been rotating. As long as ES holds above 6,720 on closing basis, buyers are defending the immediate balance and can make another push toward 6,780–6,800.
Support 2: 6,650–6,670
This is the recent swing low on 4h and sits just above the 1.272 extension (~6,653). It’s the first real higher-timeframe demand pocket of this pullback. A clean tag and strong bounce here would look like a classic trend-pullback low forming. A sustained break under 6,650 would suggest the market isn’t done repricing and opens the door to the deeper fibs.
Support 3: 6,595–6,610
This cluster includes the 1.618 extension (~6,597) and prior breakout structure from earlier in the trend. It’s the “deeper but still healthy” retrace area; if ES flushes into this band on bad data then snaps back, it can still preserve the weekly uptrend. Failing here would start to threaten the bullish structure and invite a test toward the prior weekly low.
Support 4: 6,530–6,560
The 2.0 extension (~6,535) plus the weekly prior low / PML region. This is a major higher-timeframe floor. If ES ever gets here this week, the tape is likely under stress, but it also becomes the zone where large buyers usually test the waters for a bigger swing entry. A weekly close below ~6,530 would be the first real warning that the uptrend is morphing into something more corrective or even distributive.
Support 5 (deeper swing): 6,300–6,350
Older weekly demand and prior quarterly low / PQL area. Not a base case for this week, but important to note as the “catastrophic” downside magnet if something truly breaks (data shock, earnings disaster, geopolitical flare-up).
SETUPS – WEEK AHEAD IDEA PACK
1. Trend-pullback continuation long from support
Location: 6,650–6,670 primary, 6,595–6,610 secondary.
Trigger idea:
Look for an overnight or early-week sweep into 6,650–6,670 that quickly rejects (long lower wick on 1h / 4h, strong reclaim back above 6,680). Ideally, this happens outside the heaviest data windows so it’s more order-flow driven than headline noise.
If that fails and price drives into 6,595–6,610 instead, repeat the same logic there: washout, strong reaction, then a reclaim of 6,620–6,630 as confirmation that buyers stepped in.
Upside path from this setup:
First target is the 6,780–6,800 cap. If that gives way, next magnet is 6,840–6,880, then a possible extension run at the 6,900–6,930 recent high area. Later in the week, if macro tailwinds show up, this move can stretch toward 7,000 and, in an optimistic case, into the 7,100+ fib cluster.
Risk management conceptually:
From a swing perspective, the “line in the sand” for this idea is under 6,595. A clean daily close below that level would invalidate the shallow-pullback idea and suggest we are heading toward 6,530–6,560 or lower.
2. Short-term fade from the 6,840–6,880 / 6,900 pocket
Location: 6,840–6,880 first, 6,900–6,930 as extension.
Trigger idea:
If ES trades up into 6,840–6,880 ahead of Fed minutes or the Nvidia/Walmart prints and shows tired price action (long upper wicks on 15m/1h, loss of intraday momentum, failure to hold above 6,860), that area is attractive for a tactical short aiming back toward the 6,780–6,750 pivot.
A more aggressive fade is possible into 6,900–6,930 if the first test breaches 6,880 but immediately stalls at the prior high.
Downside path from this setup:
First magnet is the 6,780–6,800 band, then the balance base at 6,720–6,740. If that gives way on a macro shock, sellers can push for a retest of 6,650–6,670.
Risk management conceptually:
For shorts initiated at 6,840–6,880, a protective stop makes sense above 6,910–6,920. Fades taken into a full sweep of 6,900–6,930 should respect a hard stop above ~6,950; above that, risk of a proper breakout toward 7,000+ increases sharply.
3. Range-trade scalps inside 6,720–6,780
While ES is stuck inside this intraday box, there is room for mean-reversion trades: buying dips into 6,720–6,730 and selling pushes into 6,770–6,780 with tight intraday stops. This is a lower-quality idea compared to the bigger levels, but it’s relevant if Monday and early Tuesday stay choppy while everyone waits for the meat of the calendar mid-week.
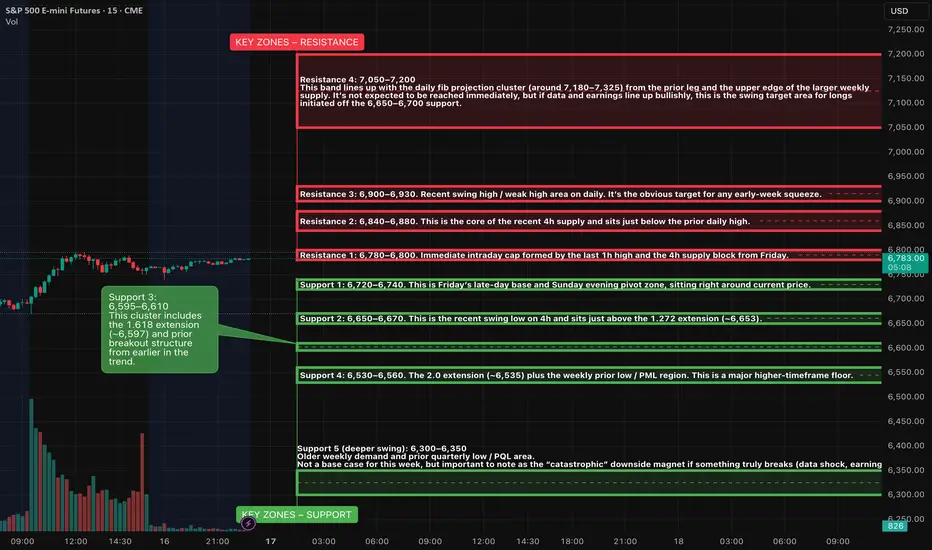
ES (SPX, SPY) Analysis, Key Zones, Setups for Thu (Nov 6)The daily trend has softened following the formation of a lower high. Analysis of the 4-hour chart indicates a bounce that encountered resistance near the 6860–6870 range, subsequently retreating to the 6810 support level. As we look ahead to tomorrow's trading, consider the 6805–6808 range as the key intraday “threshold” while the 6830–6835 zone will serve as the first significant resistance level to watch.
Setups (Level-KZ Protocol 15/5/1; NY KZ 09:30–11:00 & 13:30–16:00 ET)
1. Acceptance long from support
Trigger: 15m holds S1 6805–6808 → 5m reclaim 6823 VWAP → 5m close above 6830.
Entry: 6831–6834 on first 1m HL after the 5m re-close.
SL: 6821 (hard) or 15m trigger-wick −0.25–0.50 pt.
TP1: 6856–6861 (≥2R gate).
TP2: 6870–6873.
TP3: 6890–6895 if squeeze.
Management: No partials before TP1; at TP1 close 70%, set 30% runner to BE; no trail before TP2.
2. Rejection fade short from resistance
Trigger: Pop into 6856–6861, stall, then 5m full-body re-close back below 6856 with 1m LH.
Entry: 6850–6854.
SL: 6864.25 (hard) or 15m wick +0.25–0.50.
TP1: 6830–6832.
TP2: 6823 VWAP.
TP3: 6805–6808.
Note: If 5m re-claims 6861 after entry, exit early; setup invalid.
3. Breakdown continuation short
Trigger: 5m body close below 6805 with retest fail from beneath.
Entry: 6800–6803.
SL: 6810.75 (hard) or 15m wick +0.25–0.50.
TP1: 6790–6795.
TP2: 6768–6772.
TP3: 6747–6752.
Note: If reclaim and 5m closes back above 6808, cancel.
4. Breakout continuation long
Trigger: 5m acceptance above 6861 and hold on retest.
Entry: 6862–6865 on first 1m HL.
SL: 6853.25.
TP1: 6870–6873.
TP2: 6885–6890.
TP3: 6905–6912.
Note: If acceptance fails (5m body back under 6861), flip bias back to fade R3.
Event map for Thursday (ET)
FOMC meeting Day 1 (runs Thu–Fri; Fed is not affected).
EIA Weekly Natural Gas Storage 10:30.
Most BLS/DOL macro releases (e.g., Productivity & Costs, Weekly Jobless Claims) are suspended during the shutdown. Expect fewer 8:30 prints and thinner liquidity until the cash open.
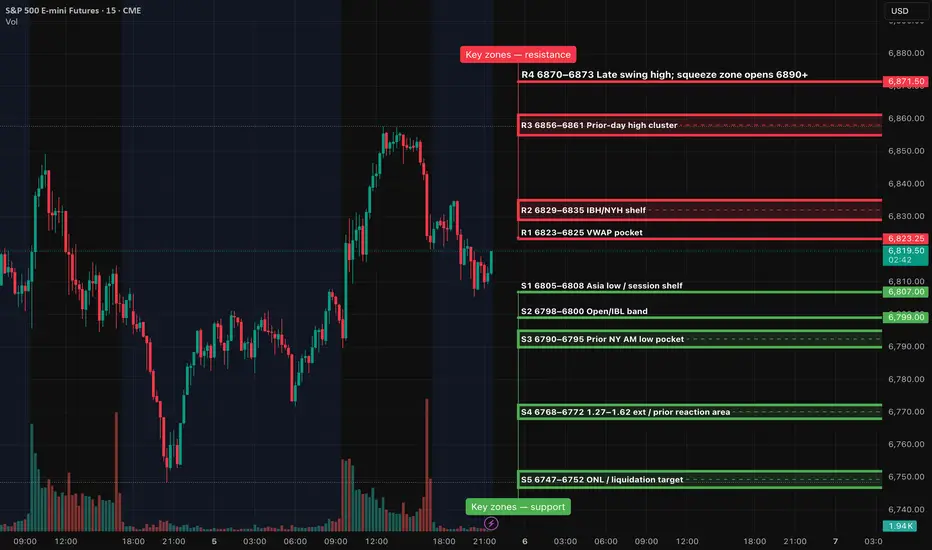
ES (SPX, SPY) Analysis, Key Levels, Setups Tue (Oct 21)Market Update for Traders:
Context:
Currently, the price is approaching a key supply zone between 6,765 and 6,795. While we have seen a series of higher highs on the 1-hour chart, the momentum appears to be flattening. Below this supply level, we have identified some significant areas to monitor. The first clean value area on the 1-hour chart is around 6,701 to 6,705, with a visible pullback shelf located between 6,685 and 6,690. There's also a stronger demand zone in the 6,655 to 6,665 range. If we manage to break above the supply cap at 6,795, the next measured extension target is around 6,840, but this should be treated as a stretch unless we see solid acceptance above 6,795.
Key Zones to Watch:
Resistance:
- 6,765–6,795 (this is the current cap)
- Extension potential at 6,840, provided we see firm acceptance above 6,795.
Support:
- Look for the first decision point around 6,725–6,735, which reflects overnight strength.
- 6,701–6,705 is a key equilibrium area.
- The shelf for the first buyable dip lies at 6,685–6,690.
- Further support is found in the demand pocket at 6,655–6,665.
- If we encounter a deeper risk-off scenario, watch for extensions down to 6,604, 6,564, and 6,520, but only if we see a decisive failure in the rebound.
Setups:
Setup 1 — Rejection Short at 6,765–6,795 (A++)
Entry: 6,788–6,793 after a 5m re-close back below 6,795 and a 1m lower-high
Stop (SL): 6,804.50 (above rejection wick/upper edge)
TP1: 6,729–6,733
TP2: 6,701–6,705
TP3: 6,686–6,690
Setup 2 — Acceptance Long above 6,795 (A++)
Entry: 6,796–6,799 on first pullback that holds after decisive 15m acceptance over 6,795
Stop (SL): 6,785.00 (back inside the band)
TP1: 6,822–6,828
TP2: 6,840 stretch
TP3: 6,852–6,855 if squeeze persists
Setup 3 — Quick-Reclaim Long at 6,701 (A+ Bounce)
Entry: 6,702–6,705 only if 6,701 briefly slips and then a 5m candle re-closes back above it
Stop (SL): 6,694.50
TP1: 6,729–6,733
TP2: 6,765–6,775
TP3: 6,788–6,793
Setup 4 — Shelf Long at 6,685–6,690 (A Bounce)
Entry: 6,686–6,689 with a 1m higher-low and 5m hold
Stop (SL): 6,678.00
TP1: 6,701–6,705
TP2: 6,729–6,733
TP3: 6,765–6,775
Setup 5 — Demand-Pocket Long at 6,655–6,665 (A Bounce)
Entry: 6,657–6,663 on stabilization and 1m higher-low
Stop (SL): 6,647.00
TP1: 6,686–6,690
TP2: 6,701–6,705
TP3: 6,729–6,733
Setup 6 — Breakdown Short if 6,701 Turns to Resistance (A+)
Entry: 6,698–6,701 after a 5m close below 6,701 and a retest that fails
Stop (SL): 6,707.50
TP1: 6,686–6,690
TP2: 6,665–6,660
TP3: 6,604–6,564 only if momentum stays risk-off
Management (apply to all)
take the setup only if TP1 ≥ 2.0R using the stated SL. At TP1 close 70% and set the 30% runner to break-even; runner attempts TP2→TP3 if structure supports it. Time-stop 45–60 minutes if neither TP1 nor SL is hit. Primary execution windows: NY AM 09:30–11:00 ET and NY PM 13:30–16:00 ET.

XAUUSD GOLD RESISTANCE 3775-3788 READ CAPTIONHi traders'. what do you think about gold
Gold is currently trading near a strong resistance zone (3775 – 3788).
Price has shown bearish rejection from this area, indicating selling pressure.
If buyers fail to push above 3795 (risk level), sellers are likely to dominate.
Downside targets align with support at 3751 and the demand zone at 3736.
Stop loss above 3795 keeps the setup safe and controlled
🔹 Resistance Zone: 3775 – 3788
🔹 Risk Level (Stop Loss): Above 3795
TP1 3751 (support zone)
3736 (demand zone)
⚡ For educational purpose only, not financial advice
👉 Follow for more safe setups & daily analysis! ✅

GBPUSD Outlook – Trend is My LifeGBPUSD Outlook – Trend is My Life
GBPUSD continues to move in line with the broader bearish structure on the H4 timeframe. Price reactions along the trendline have been accurate, and at the moment, the pair is showing signs of a minor pullback towards the upper trendline. This offers a potential opportunity for a short-term sell, while keeping an eye on the 1.3400 support as a possible swing buy zone.
If 1.3400 breaks decisively, the preferred scenario remains to follow the downtrend with further sells until a clear reversal structure is confirmed.
The MACD indicator continues to signal a strong and sustained bearish bias, adding weight to this outlook. Remember the phrase: “Trend is My Life” – staying aligned with the prevailing trend is key to maximising efficiency across any trading system.
Key levels to watch:
Resistance: 1.3510
Support: 1.3380
Patience in observing price action around these zones will provide better entries and improve trade management.
#GBPUSD #Forex #TechnicalAnalysis #PriceAction #MACD #TrendFollowing

CHFJPY - Before UP. Technical.Hello dear Traders!
Marked circles are for demonstration that the market has suspicious done same trend situation with an uptrend before. So, this is sign for as about that the market may repeat the uptrend again.
Thank you! Nika.

Gold Technical & Fundamental Update | August 11–15, 2025XAUUSD closed last week near $3,400 after breaking above the resistance of the descending channel. Price action has been choppy, hinting at cautious buying ahead of major U.S. events this week, CPI, PPI, Retail Sales, and Fed commentary.
Key levels:
✅$3,380: Above = bullish bias continues; Below = look for selling setups
✅Support: Former channel resistance now acting as a retest zone
✅Trend guide: Ascending trendlines from the early August recovery
Watch how gold reacts to $3,380 early in the week. This will set the tone for either continuation toward recent highs or a deeper pullback.
#gold #xauusd #forex #technicalanalysis #marketupdate #tradingvie
I’ll update my thoughts in the comments as price action unfolds.
Disclaimer:
Based on experience and what I see on the charts, this is my take. It’s not financial advice—always do your research and consult a licensed advisor before trading.

Gold at All-Time Highs – Blow-Off or Breakdown?Gold has just printed new all-time highs, but I’m approaching with caution. At these levels, everyone long is in profit — leaving no trapped buyers above and only liquidity for smart money to grab.
We kicked off the session with an impulsive spike higher, but this may have been a stop run and liquidity sweep rather than the start of another leg up. If price struggles to hold above that spike or fails on a re-test, we could see sellers step in, targeting the 4H FVG zone below.
For now, I’m watching:
A possible revisit of yesterday’s high to “fix” lack of excess on the DOM
London session reaction to today’s spike high
Potential short setups if buy-side momentum stalls
NY session might deliver the day’s best move, but we could see early opportunities in the Asian and London sessions if price confirms a shift in order flow.
What do you think? Is this a blow-off top in the making, or do buyers have one more push?
