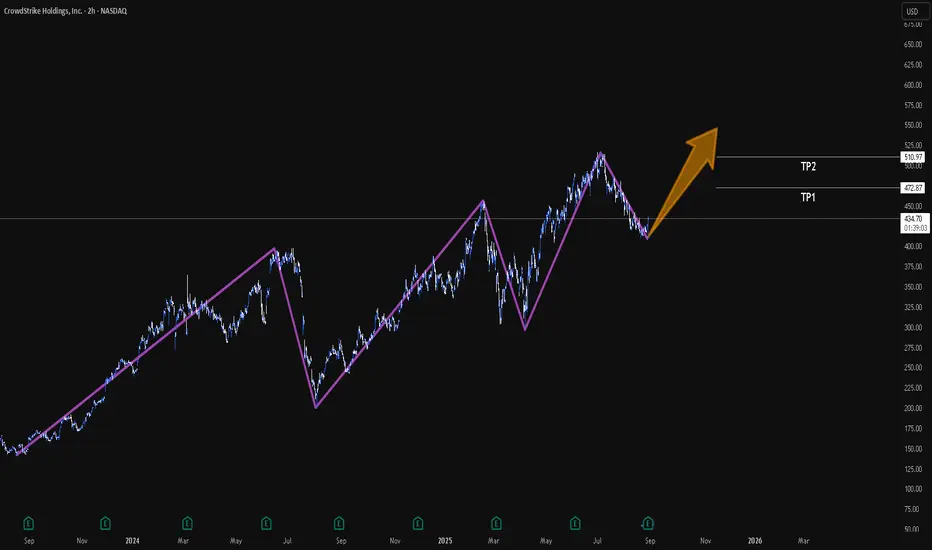
CRWD | Check for buy? Idk.As we see, the time period of the waves is getting shorter in the time range.
My price prediction in this situation is that the price will go up to check new higher levels...
Tradingidea
GOLD ~ TECHNICAL. 2H.First, what I want to say is Gold is not giving up, after the Triple top resistance.
My prediction about GOLD is that it's not only trying to reach the triangle's upside, but it's also trying to reach the resistance point by entering that marked area.
Have a profitable day!

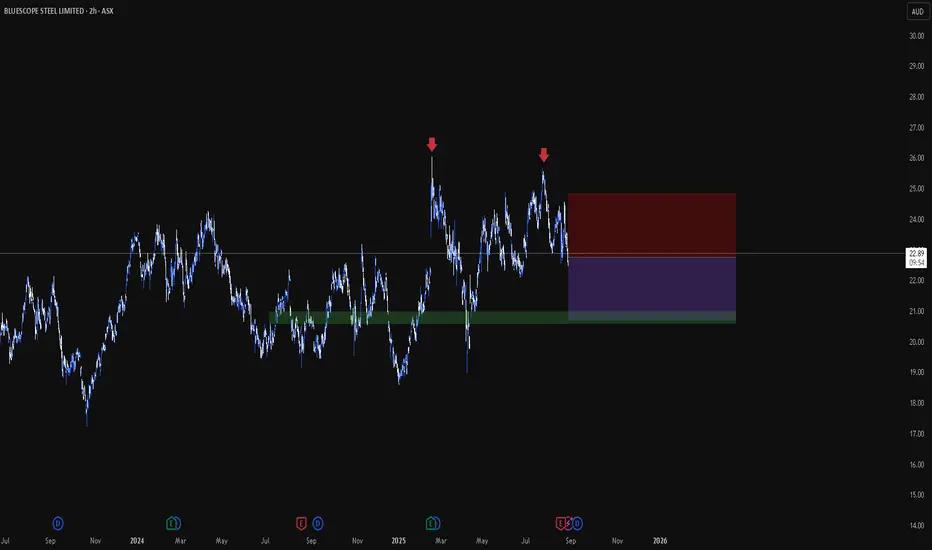
BLS | Tech. Short. The price two time tested most important resistance levels here... So, we may except it will now go down to nearest most strong support level. There where we have our TP.
OIL | Technical. 2H. The price of Crude Oil looks so bearish. We have strong downtrend...
Diagonal Support line is broken. We may see the price a bit below in next days.
I hope this chartwork will be useful for some of you.
Thank you. Have a profitable day.

AUDJPY ~ BUTOFAGO in Action. In this trading idea, I'm showing how good this Butterfly patterns can do their work.
After a few movements, we may see the price started going down with breaking our diagonal support.
We have so good TP levels also, that anyone can use for them.
GL! Nika.
:)

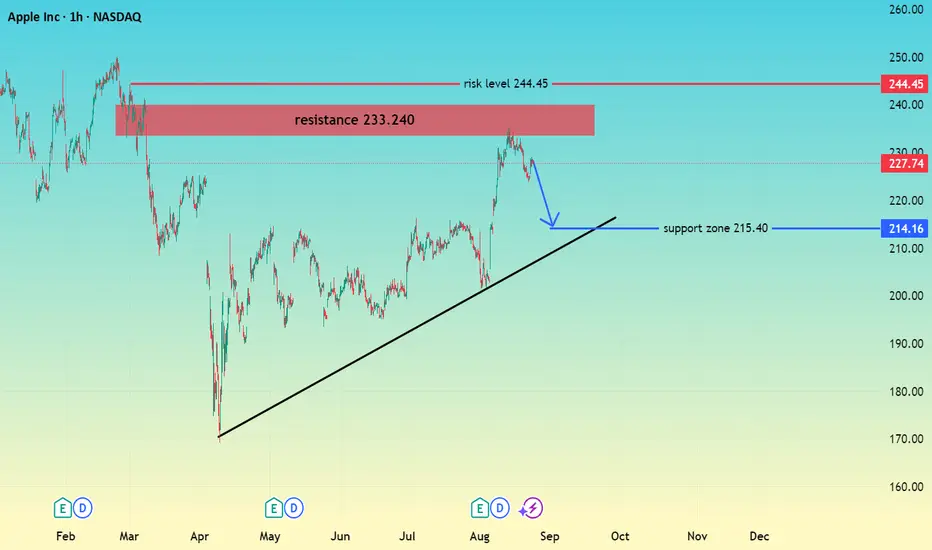
AAPL RESISTANCE 233VS SUPPORT 215 hi trader's
Apple price is testing a major resistance zone around 233 – 240.
If sellers hold this resistance, a retracement toward the 215.40 support zone and trendline is possible.
A sustained break above the 244.45 risk level would invalidate this bearish view and may open the way for higher prices
Resistance Zone: 233 – 240
Support Zone: 215.40
Risk Level ( 244.45
don't forget to like comment and follow
COPPER ~ TECHNICAL. 2H.Exiting this current channel may be accompanied by a significant price change...
So, we may have an eye on this after we buy or sell. but strongly.

USD/JPY ~ Buy Opportunity.Hello traders. It's Nika.
We got here beautiful uptrend. This looks like the price will keep go high.
Our trade in this situation will be buying from support and TP on resistance.
Trade ratio 1:54 Risk 8%.

BitcoinThis is what is very logical to happen on market with its psychological levels...
BUT ALSO, my previous BTC technical analysis is telling different perspectives.
With this technical work, it's true to say it's time of correction. Let's see! :)

USDCAD ~ Cheapy Choapa? IDKThe triple top resistance is found on the USDCAD weekly chart!
What we may expect with it is a high-quality downtrend.
But for the reason "This chart is so beautiful," here I have to say,
We need to be careful about this position UNTIL confirmation on sell.
Nika.

GBPCAD ~ Wave Roads. Tech.Hi TradingView,
Hello Traders!
On VMWA, 800, the trend looks so resistant. From it we may expect more down ways...(The price may go up maximum and test 1.93895 and after again come back...)
SMA, 1200, right now, it's a huge resistance point.
So, wait for updates on this idea...
Leave a comment if you have a specific opinion about.
Have a Profitable Day.
Nika.

NZDCAD ~ White Bear. Tech.It's the second time that the trend make retracement on Fibos 50.
But it look still price going down.
We got a few levels to check bellow. (Marked grey areas).
Have a profitable day!

is BTC going TOP again? Road To 138,000?~ In this trading idea, here is showed how well and nice this wave works.
In first example we got nice uptrend so I'm expecting that we will see something similar in a few days!
~ My prediction is to be ready strong uptrend again.
Like this idea if you see it's useful.
Make comment about your opinions too. <3
Nika. :)

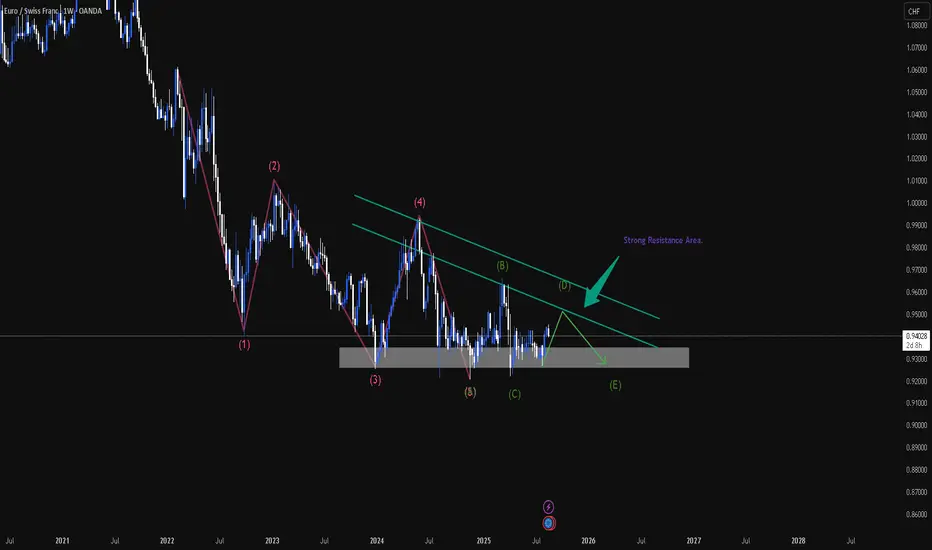
EURCHF - the little up & than down. Forming of Triangle.Right now, on market it is more predictable to be again bear movements!
The Elliot wave analysis shows as the price may go down again.
For them who is looking for entering sell, here we have two places for it.
First, it's when the price will touch resistance diagonal line. (Light-green colored).
The second place is after the price will enter that main resistance area.
Thx,
have a profitable day!
E-mini Nasdaq-100 Trading Setup for sellers ^)We have completed cup and handle pattern here...
So after the price is still high!
We may see some price gain additional, something like 13-18% .
So we have two option here for the sellers, wait and sell from marked point 1 or 2 .
P.S. This is very long time range position. ( Something like 200-800 day ).
Have a profit in your day!
Thanks.

EURUSD BermundaHi guys, this is EURUSD short idea for make some pips...
I hope it will be interesting.

GBPUSD ScalpAs we see, here we have strong and beautiful resistance level.
The price will go down and test previous levels. TP: 1.35659 (30-33pips).

BTCUSD - 1H. TECH.In this trading idea, we are reviewing the last price movement of Bitcoin/USD
I hope this video analysis will have a good and positive effect on your trading perspectives!
Wishing you profits in your trades.

USDJPY - MR.GRINGO ThinkingsHello everybody.
Today, we have some discussion about this pair but only with using Technical ways.
The pair right now is very long, maybe 80 days' time period in trouble situation. I mean, the bears have the market of it...
As we see, this 80 day was so strong bearish range, but it's great try for bulls now!
We may have a hope, the price will go up with this next side of the acceding triangular figures.
We may open long position on the price 143.603 or Just make entry for long now.
If you will follow this trading idea, there we will have "the main" resistance levels.
They are...
1. 145.735
2. 146.892
3. 148.048 yes. so I recommend this price levels, because the market will check it maybe later... For sure if you think buy.
Have a profit maker day! :) ^)

NZDCAD - TECH.Hello dear Traders,
Hello TradingView!
Today, in this chart, we will have some technical views about NZDCAD.
ABCD pattern triangle for this time looks like it has lost its weight, and soon the price will start coming down...
The price is still testing the bottom level of the ABCD triangle pattern.
My recommendation on this pair is to wait for a good sell opportunity...
TP1: 0.81669
TP2: 0.81360
Wishing you good luck and a profitable day!

EURUSD - TECH. 2Hello Traders! It's Nika.
In this technical work, as we see here, there is a few things happening at the same moment.
First thing to focus on is that we have formatting double double-head acceding triangle.
We need wait or also go short for that with small time period. After that my prediction is the price will enter that channel in price range 1.13917 - 1.13247. So, after that we can wait for the market price confirmation and only after going Buy or Sell.
After all, what we got here is two good options.
1. Open short when market will open until the price will hit "Double-head acceding triangle" bottom.
2. Go into the position after a few days, when the price will enter & left channel range 1.13917 - 1.13247.
In long time period sell and buy probability, there is price marks on chart! So, you can use it as your TP.
Thank you!
Have a profitable day. :)

BTC, where we can setup our sell positions.Hello, dear traders! It's Nika again.
I want to share this beautiful pattern and tell you some about its meaning...
---
So, as we see here, we have this "triangular-shaped uprising pattern".
We got this pattern with its own few supporting and formatting levels.
Almost all of them are marked on our chart!
---
The "usage" of this may be something like this...
First, we may see the price testing an important price level of pattern 96,000,00 very soon...
---
After, if the price continues checking support levels below, we may also see the 91 & 89 K price levels.
You will profit from this price movement only if the price goes this way. :)
---
Wishing you a happy trading day and much more success in your trades!
---
If you have any questions, please comment or send a message.
Thank you!

GBPUSD - Technical analysis 2HGood morning, traders, dear TradingView. It's Nika.
I want to share this trading idea, for a reason we have very important resistance level breakout!
I think the price of this pair will continue growing and will reach level 1.37097!
So some of you can just open long now, or wait and enter after a little correction.
Thank you.
Have a profitable day.
