GOLD 4H CHART ROUTE MAP UPDATEHey Everyone,
This is a follow up update on our 4H chart idea that we shared Sunday stating that we still had the final gap in the range left.
EMA5 cross and cross and lock above 3561 left 3615 open.
- This target was hit this week now completing our 4H chart idea.
Keep an eye out for our NEW 4H chart idea with updated levels and route map.
BULLISH TARGET
3424 - DONE
EMA5 CROSS AND LOCK ABOVE 3424 WILL OPEN THE FOLLOWING BULLISH TARGETS
3499 - DONE
EMA5 CROSS AND LOCK ABOVE 3499 WILL OPEN THE FOLLOWING BULLISH TARGET
3561 - DONE
EMA5 CROSS AND LOCK ABOVE 3561 WILL OPEN THE FOLLOWING BULLISH TARGET
3615 - DONE
As always, we will keep you all updated with regular updates throughout the week and how we manage the active ideas and setups. Thank you all for your likes, comments and follows, we really appreciate it!
Mr Gold
GoldViewFX
Tradingideas

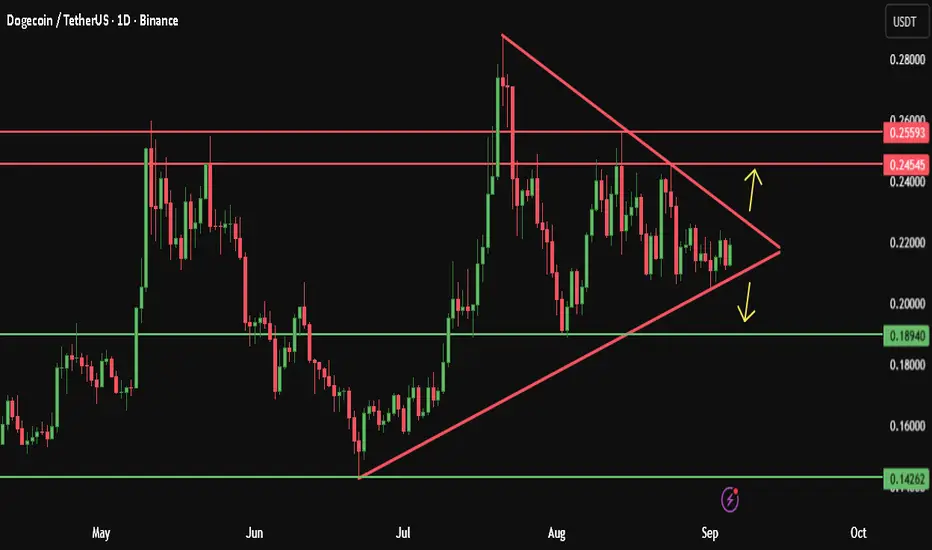
Dogecoin A potential explosive move is comingWe are currently observing the formation of a Symmetrical Triangle, suggesting the market is coiling up for a significant move.
A bullish breakout to the upside would likely target the upper resistance zone 0.2454 and 0.25593.
In the event of a bearish breakdown, we could see a decline towards the lower support at 0.18940 and 0.14262.
Let’s keep a close eye on this pattern for a confirmed direction.
please note :
this is not financial advice — it reflects only my personal opinion.
PLEASE always do your own research before trading .. Good luck with your trades.
International Payment Systems (SWIFT, CBDCs)Part I: The Evolution of International Payment Systems
1. The Early Days of Cross-Border Payments
Historically, cross-border payments were facilitated through:
Gold and Silver Settlements: Merchants exchanged precious metals, which were universally recognized as stores of value.
Bills of Exchange: Used in medieval trade, these paper instruments allowed merchants to settle accounts without moving physical assets.
Correspondent Banking: In the 19th and 20th centuries, banks built networks of correspondent relationships to settle payments across borders.
These methods were slow, costly, and prone to risks such as fraud, counterparty default, and political instability.
2. The Bretton Woods System and Beyond
After World War II, the Bretton Woods Agreement (1944) created the U.S. dollar–centric system, where the dollar was convertible into gold and became the dominant reserve currency. This system enhanced cross-border payments but still relied heavily on correspondent banks.
Following the collapse of Bretton Woods in 1971, fiat currencies began floating freely, further complicating international payments as exchange rate volatility increased.
3. The Rise of Electronic Payment Systems
The digital era of the late 20th century transformed payments:
CHIPS (Clearing House Interbank Payments System) in the U.S.
TARGET2 in Europe.
Fedwire for domestic U.S. transfers.
SWIFT, which emerged as the global financial messaging system connecting thousands of banks.
Part II: SWIFT – The Backbone of Global Financial Messaging
1. What is SWIFT?
Founded in 1973 and headquartered in Belgium, SWIFT (Society for Worldwide Interbank Financial Telecommunication) is not a payment system itself but a secure messaging network that enables banks and financial institutions worldwide to exchange standardized financial messages.
Key functions include:
Transmitting payment instructions (wire transfers, securities transactions, trade finance documents).
Enabling standardization through message formats (MT/MX messages).
Providing security with encrypted and authenticated communication channels.
2. How SWIFT Works
Participants: Over 11,000 institutions in 200+ countries.
Message Types: SWIFT MT (Message Type) and newer ISO 20022 MX formats.
Process:
A bank initiates a payment request via SWIFT.
The message is sent securely to the counterparty bank.
Actual fund settlement occurs separately through correspondent banking or clearing systems.
3. Why SWIFT Became Dominant
Global Reach: No other network connected as many banks worldwide.
Security: High encryption standards and authentication.
Neutrality: As a cooperative owned by member institutions, SWIFT is not tied to any single nation-state (though geopolitics complicates this claim).
Efficiency: Faster than telex, fax, or older systems.
4. SWIFT’s Economic and Political Significance
Handles millions of messages daily, representing trillions of dollars in transactions.
Acts as a gatekeeper of the international financial system.
Has been used as a tool of geopolitical leverage, with nations being excluded (e.g., Iran, Russia).
5. Limitations of SWIFT
Not instant: Settlement still depends on correspondent banking, which can take 2–5 days.
Expensive: Multiple intermediaries add costs (correspondent bank fees, FX spreads).
Opaque: Hard for individuals and small businesses to track payments in real time.
Geopolitical risk: Heavy influence from the U.S. and EU raises questions of neutrality.
Part III: Central Bank Digital Currencies (CBDCs) and the Future of Payments
1. What are CBDCs?
Central Bank Digital Currencies (CBDCs) are digital forms of sovereign money issued directly by central banks. Unlike cryptocurrencies (Bitcoin, Ethereum) or stablecoins (USDT, USDC), CBDCs are:
Legal tender, backed by the state.
Centralized, controlled by the central bank.
Stable in value, tied to fiat currencies.
CBDCs can be classified into:
Retail CBDCs: For use by the general public (e.g., digital yuan wallet).
Wholesale CBDCs: For interbank and institutional settlements.
2. Motivations for CBDC Development
Central banks globally are exploring CBDCs for reasons including:
Faster and cheaper payments (especially cross-border).
Financial inclusion for unbanked populations.
Reduced reliance on private intermediaries (Visa, Mastercard, SWIFT).
Geopolitical sovereignty (reducing dollar dependency).
Improved monetary policy tools (programmable money, negative rates).
3. CBDCs in Cross-Border Payments
CBDCs offer potential solutions to SWIFT’s limitations:
Instant settlement: Peer-to-peer transfers between central banks.
Lower cost: Eliminates correspondent banking layers.
Transparency: Real-time tracking of payments.
Programmability: Smart contracts for automated compliance.
4. Leading CBDC Projects Worldwide
China: Digital Yuan (e-CNY) already in pilot across multiple cities and tested for cross-border use.
Europe: The European Central Bank is developing a Digital Euro.
India: The Reserve Bank of India launched pilot programs for the Digital Rupee in 2022.
USA: The Federal Reserve is researching a Digital Dollar, though progress is slower.
Multi-CBDC Platforms: Projects like mBridge (BIS, China, UAE, Thailand, Hong Kong) aim to build interoperable cross-border CBDC networks.
Part IV: SWIFT vs. CBDCs – Collaboration or Competition?
1. Will CBDCs Replace SWIFT?
Possibility: If central banks interconnect CBDCs directly, the need for SWIFT messages may decline.
Reality: Transition will be slow; SWIFT’s vast network is difficult to replicate overnight.
2. SWIFT’s Response
SWIFT is experimenting with CBDC interoperability solutions, connecting multiple digital currencies through its network.
Focus on ISO 20022 standardization to ensure compatibility with CBDC systems.
Partnerships with central banks to ensure relevance in the digital era.
3. Coexistence Scenario
In the short to medium term, SWIFT and CBDCs may coexist:
SWIFT remains dominant for traditional bank-to-bank messaging.
CBDCs gain traction for specific corridors, especially in Asia and emerging markets.Part I: The Evolution of International Payment Systems
1. The Early Days of Cross-Border Payments
Historically, cross-border payments were facilitated through:
Gold and Silver Settlements: Merchants exchanged precious metals, which were universally recognized as stores of value.
Bills of Exchange: Used in medieval trade, these paper instruments allowed merchants to settle accounts without moving physical assets.
Correspondent Banking: In the 19th and 20th centuries, banks built networks of correspondent relationships to settle payments across borders.
These methods were slow, costly, and prone to risks such as fraud, counterparty default, and political instability.
2. The Bretton Woods System and Beyond
After World War II, the Bretton Woods Agreement (1944) created the U.S. dollar–centric system, where the dollar was convertible into gold and became the dominant reserve currency. This system enhanced cross-border payments but still relied heavily on correspondent banks.
Following the collapse of Bretton Woods in 1971, fiat currencies began floating freely, further complicating international payments as exchange rate volatility increased.
3. The Rise of Electronic Payment Systems
The digital era of the late 20th century transformed payments:
CHIPS (Clearing House Interbank Payments System) in the U.S.
TARGET2 in Europe.
Fedwire for domestic U.S. transfers.
SWIFT, which emerged as the global financial messaging system connecting thousands of banks.
Part II: SWIFT – The Backbone of Global Financial Messaging
1. What is SWIFT?
Founded in 1973 and headquartered in Belgium, SWIFT (Society for Worldwide Interbank Financial Telecommunication) is not a payment system itself but a secure messaging network that enables banks and financial institutions worldwide to exchange standardized financial messages.
Key functions include:
Transmitting payment instructions (wire transfers, securities transactions, trade finance documents).
Enabling standardization through message formats (MT/MX messages).
Providing security with encrypted and authenticated communication channels.
2. How SWIFT Works
Participants: Over 11,000 institutions in 200+ countries.
Message Types: SWIFT MT (Message Type) and newer ISO 20022 MX formats.
Process:
A bank initiates a payment request via SWIFT.
The message is sent securely to the counterparty bank.
Actual fund settlement occurs separately through correspondent banking or clearing systems.
3. Why SWIFT Became Dominant
Global Reach: No other network connected as many banks worldwide.
Security: High encryption standards and authentication.
Neutrality: As a cooperative owned by member institutions, SWIFT is not tied to any single nation-state (though geopolitics complicates this claim).
Efficiency: Faster than telex, fax, or older systems.
4. SWIFT’s Economic and Political Significance
Handles millions of messages daily, representing trillions of dollars in transactions.
Acts as a gatekeeper of the international financial system.
Has been used as a tool of geopolitical leverage, with nations being excluded (e.g., Iran, Russia).
5. Limitations of SWIFT
Not instant: Settlement still depends on correspondent banking, which can take 2–5 days.
Expensive: Multiple intermediaries add costs (correspondent bank fees, FX spreads).
Opaque: Hard for individuals and small businesses to track payments in real time.
Geopolitical risk: Heavy influence from the U.S. and EU raises questions of neutrality.
Part III: Central Bank Digital Currencies (CBDCs) and the Future of Payments
1. What are CBDCs?
Central Bank Digital Currencies (CBDCs) are digital forms of sovereign money issued directly by central banks. Unlike cryptocurrencies (Bitcoin, Ethereum) or stablecoins (USDT, USDC), CBDCs are:
Legal tender, backed by the state.
Centralized, controlled by the central bank.
Stable in value, tied to fiat currencies.
CBDCs can be classified into:
Retail CBDCs: For use by the general public (e.g., digital yuan wallet).
Wholesale CBDCs: For interbank and institutional settlements.
2. Motivations for CBDC Development
Central banks globally are exploring CBDCs for reasons including:
Faster and cheaper payments (especially cross-border).
Financial inclusion for unbanked populations.
Reduced reliance on private intermediaries (Visa, Mastercard, SWIFT).
Geopolitical sovereignty (reducing dollar dependency).
Improved monetary policy tools (programmable money, negative rates).
3. CBDCs in Cross-Border Payments
CBDCs offer potential solutions to SWIFT’s limitations:
Instant settlement: Peer-to-peer transfers between central banks.
Lower cost: Eliminates correspondent banking layers.
Transparency: Real-time tracking of payments.
Programmability: Smart contracts for automated compliance.
4. Leading CBDC Projects Worldwide
China: Digital Yuan (e-CNY) already in pilot across multiple cities and tested for cross-border use.
Europe: The European Central Bank is developing a Digital Euro.
India: The Reserve Bank of India launched pilot programs for the Digital Rupee in 2022.
USA: The Federal Reserve is researching a Digital Dollar, though progress is slower.
Multi-CBDC Platforms: Projects like mBridge (BIS, China, UAE, Thailand, Hong Kong) aim to build interoperable cross-border CBDC networks.
Part IV: SWIFT vs. CBDCs – Collaboration or Competition?
1. Will CBDCs Replace SWIFT?
Possibility: If central banks interconnect CBDCs directly, the need for SWIFT messages may decline.
Reality: Transition will be slow; SWIFT’s vast network is difficult to replicate overnight.
2. SWIFT’s Response
SWIFT is experimenting with CBDC interoperability solutions, connecting multiple digital currencies through its network.
Focus on ISO 20022 standardization to ensure compatibility with CBDC systems.
Partnerships with central banks to ensure relevance in the digital era.
3. Coexistence Scenario
In the short to medium term, SWIFT and CBDCs may coexist:
SWIFT remains dominant for traditional bank-to-bank messaging.
CBDCs gain traction for specific corridors, especially in Asia and emerging markets.
Part V: Risks, Challenges, and Opportunities
1. Risks of CBDCs
Privacy concerns: Central banks could track every transaction.
Cybersecurity threats: Centralized systems are high-value hacking targets.
Financial disintermediation: Banks may lose deposits if individuals prefer CBDCs.
Geopolitical fragmentation: Competing CBDC blocs (U.S.-led vs China-led) could split the financial system.
2. Risks of SWIFT
Sanctions weaponization undermines neutrality.
Inefficiency relative to new technologies.
Exposure to cyberattacks (e.g., Bangladesh Bank heist in 2016).
3. Opportunities
For SWIFT: Remain the global connector by facilitating CBDC interoperability.
For CBDCs: Create a more inclusive, efficient, and sovereign financial system.
For Businesses and Consumers: Faster remittances, lower costs, better transparency.
Conclusion
International payment systems are undergoing one of the most profound transformations since the Bretton Woods era. SWIFT, the dominant global financial messaging system for decades, remains crucial but faces challenges from new technologies and shifting geopolitics. Meanwhile, CBDCs represent both an opportunity and a threat—promising faster, cheaper, and more sovereign payment infrastructures but also raising risks of fragmentation, surveillance, and competition.
The likely future is not a complete replacement of SWIFT by CBDCs, but rather a hybrid system where SWIFT evolves to act as an interoperability layer while CBDCs gain prominence in specific cross-border corridors.
Ultimately, the future of international payments will depend not only on technological innovation but also on political will, global cooperation, and the balance of power among major economies. The contest between SWIFT and CBDCs is not just about efficiency—it is about who controls the financial arteries of the 21st-century global economy.
Shipping, Freight, and Logistics Trading (Baltic Index)1. Foundations of Global Shipping and Freight
1.1 The Role of Shipping in Global Trade
Shipping is the engine of globalization. Over 80% of international trade by volume is carried by sea. Ships transport crude oil, natural gas, coal, iron ore, grains, fertilizers, automobiles, and countless other goods.
Without shipping, modern trade would collapse. It provides:
Cost efficiency: Shipping is the cheapest way to transport large quantities over long distances.
Accessibility: Oceans cover 70% of the earth, linking producers and consumers across continents.
Flexibility: Different vessel types (tankers, bulk carriers, container ships, LNG carriers) handle specific cargo needs.
1.2 Freight: The Price of Shipping
In simple terms, freight is the cost of transporting cargo from one point to another. Freight rates vary depending on:
Type of cargo (dry bulk, liquid, containerized)
Distance and route (short haul vs. long haul)
Vessel size and availability
Market conditions (supply of ships vs. demand for goods)
Freight costs are crucial because they directly affect commodity prices, corporate profits, and inflation worldwide.
1.3 Logistics and Its Broader Scope
While shipping focuses on transport, logistics covers the entire chain: storage, warehousing, customs clearance, last-mile delivery, and supply chain management. Logistics companies such as Maersk, DHL, FedEx, and MSC coordinate multi-modal transport systems that integrate shipping, trucking, rail, and air.
2. The Baltic Exchange and Baltic Index
2.1 History of the Baltic Exchange
The Baltic Exchange is a London-based institution founded in the mid-18th century. Initially, it provided a marketplace for shipowners and merchants to negotiate contracts. Today, it is the world’s leading source of maritime market information, freight assessments, and shipping benchmarks.
2.2 What is the Baltic Dry Index (BDI)?
The BDI is a composite index that tracks the cost of transporting raw materials by sea, specifically dry bulk commodities such as:
Iron ore
Coal
Grains (wheat, corn, soybeans)
Bauxite, alumina, and other minerals
It is published daily by the Baltic Exchange and reflects the average of freight rates on major shipping routes worldwide.
2.3 How the BDI is Calculated
The index is derived from assessments of freight brokers who provide daily estimates of charter rates for different ship sizes. It combines data from four main dry bulk carrier classes:
Capesize (largest ships, mainly carrying iron ore & coal, 150,000+ DWT)
Panamax (medium size, often for coal & grain, 60,000–80,000 DWT)
Supramax (40,000–60,000 DWT, flexible routes & cargoes)
Handysize (smaller vessels, 10,000–40,000 DWT, short routes, regional trade)
The weighted average of these daily rates produces the BDI value.
2.4 Why is the BDI Important?
Economic Indicator: It is considered a leading indicator of global trade activity. Rising BDI suggests strong demand for raw materials and growth, while falling BDI indicates slowing trade.
Price Benchmark: Used by miners, steelmakers, traders, and shipping companies to negotiate contracts.
Financial Market Tool: Hedge funds, analysts, and investors watch the BDI to forecast commodity cycles and global GDP trends.
3. The Economics of Freight Markets
3.1 Supply Side: The Shipping Fleet
The supply of vessels is relatively inelastic in the short term. It takes 2–3 years to build new ships, so when demand spikes, freight rates can rise sharply. Conversely, during downturns, excess ships push rates lower.
3.2 Demand Side: Global Commodity Trade
Demand for shipping depends on global consumption of raw materials:
China’s steel production drives iron ore imports.
Power plants drive coal shipments.
Food security drives grain exports from the US, Brazil, and Ukraine.
3.3 Freight Rate Cycles
The shipping industry is notoriously cyclical:
Boom: High demand, limited supply → skyrocketing freight rates.
Bust: Overbuilding of ships, economic slowdown → rates collapse.
This volatility makes freight trading attractive but risky.
4. Trading and Investment Using the Baltic Index
4.1 Physical Shipping Contracts
Shipowners lease vessels to charterers (traders, miners, commodity houses) through:
Voyage Charter: Hire for a single trip.
Time Charter: Hire for a specific time period.
Bareboat Charter: Hire vessel without crew/equipment.
Freight rates are negotiated based on BDI benchmarks.
4.2 Freight Derivatives and Forward Freight Agreements (FFAs)
To manage volatility, traders use FFAs, financial contracts that lock in freight rates for future dates.
Example: A steelmaker importing iron ore may buy FFAs to hedge against rising shipping costs.
Speculators also trade FFAs purely for profit, betting on future freight movements.
4.3 ETFs and Shipping Stocks
Investors gain exposure to freight and shipping through:
Shipping company stocks (Maersk, Cosco, Hapag-Lloyd, Frontline)
Exchange-traded funds (ETFs) that track shipping indices
Commodities like iron ore, coal, and grains, which correlate with freight rates
4.4 Role of Banks and Hedge Funds
Financial institutions use the BDI for forecasting, asset allocation, and even as a proxy for inflation and GDP. Hedge funds trade freight derivatives to profit from global trade cycles.
5. Logistics and Supply Chain Dynamics
5.1 Container Shipping vs. Bulk Shipping
Container Shipping: Handles manufactured goods (electronics, clothing, cars). Measured in TEUs (Twenty-foot Equivalent Units). Freight benchmark = Shanghai Containerized Freight Index (SCFI).
Bulk Shipping: Handles raw commodities (ore, coal, grain). Benchmark = BDI.
5.2 Supply Chain Bottlenecks
Events like the COVID-19 pandemic and Suez Canal blockage (2021) highlighted vulnerabilities:
Congested ports delayed shipments.
Container shortages raised freight prices.
Geopolitical tensions (Russia-Ukraine war) disrupted grain and oil transport.
5.3 Role of Technology
Digital platforms, blockchain, and AI are transforming logistics:
Real-time cargo tracking
Smart contracts for freight payments
Automated port operations
6. Case Studies
6.1 The 2008 Shipping Boom and Bust
Pre-2008: China’s rapid industrial growth caused freight rates to skyrocket (BDI hit 11,793 points in May 2008).
Post-2008: Global financial crisis slashed demand; oversupply of ships led to a crash (BDI dropped below 700 points in late 2008).
6.2 COVID-19 Pandemic
Early 2020: Demand collapsed, ships idled, freight rates fell.
Mid-2020 onward: Recovery + container shortages led to record high container freight prices.
6.3 Russia-Ukraine War (2022)
Disrupted Black Sea grain exports.
Increased insurance costs for vessels in conflict zones.
Re-routed trade flows reshaped freight markets.
Conclusion
Shipping, freight, and logistics are the hidden arteries of global trade. The Baltic Dry Index (BDI) stands as a critical barometer of world economic health, linking shipping costs to broader market cycles. Traders, investors, and policymakers watch it closely to gauge demand for raw materials, predict inflation, and assess the global growth outlook.
While the industry faces volatility, geopolitical risks, and environmental pressures, it is also entering a period of transformation driven by decarbonization, digitalization, and new trade patterns.
For anyone interested in global markets—whether a trader, economist, or policy planner—the Baltic Index remains one of the most powerful yet underappreciated indicators of where the world economy is heading.
Inflation & Interest Rate Impact on Global Markets1. Inflation: The Silent Force Driving Markets
1.1 What is Inflation?
Inflation refers to the sustained increase in the general price level of goods and services in an economy over time. It reduces the purchasing power of money and reflects imbalances between demand and supply.
Types of Inflation:
Demand-Pull Inflation: Caused by strong consumer demand exceeding supply.
Cost-Push Inflation: Triggered by higher production costs (e.g., rising wages, raw materials).
Built-In Inflation: Wage-price spirals where higher wages lead to higher prices.
Hyperinflation: Extremely rapid price increases, often due to monetary mismanagement.
1.2 Measurement of Inflation
Central banks and governments use indexes like:
Consumer Price Index (CPI)
Producer Price Index (PPI)
Personal Consumption Expenditure (PCE)
Each index provides a different angle on price changes affecting households, businesses, and producers.
1.3 The Global Relevance of Inflation
Inflation impacts nearly every financial market:
Equities: Erodes corporate profits unless firms pass costs to consumers.
Bonds: Fixed interest payments lose real value when inflation rises.
Currencies: High inflation weakens a nation’s currency.
Commodities: Often act as a hedge (gold, oil, agricultural products).
2. Interest Rates: The Monetary Lever
2.1 What are Interest Rates?
Interest rates represent the cost of borrowing money or the return on lending capital. Central banks set benchmark rates (e.g., the U.S. Federal Reserve’s Federal Funds Rate, ECB’s Main Refinancing Rate) to guide economic activity.
2.2 How Central Banks Use Interest Rates
Lowering Rates: Stimulates growth, encourages borrowing, raises asset prices.
Raising Rates: Controls inflation, curbs excessive lending, can cool overheated economies.
2.3 Real vs. Nominal Interest Rates
Nominal Rate: Stated percentage without inflation adjustment.
Real Rate: Nominal rate minus inflation. Investors care about real returns.
3. The Inflation–Interest Rate Nexus
The relationship between inflation and interest rates is central to market behavior. High inflation often prompts central banks to raise rates, while low inflation or deflation encourages rate cuts.
Phillips Curve Theory: Historically suggested an inverse relationship between inflation and unemployment, though its relevance is debated today.
Taylor Rule: A monetary policy guideline suggesting how central banks should adjust interest rates in response to inflation and output gaps.
This interaction affects everything from stock market valuations to cross-border capital flows.
4. Impact on Global Asset Classes
4.1 Equity Markets
High Inflation + Rising Rates: Compresses valuations, reduces consumer demand, and lowers corporate earnings. Growth stocks, especially in tech, often suffer.
Low Inflation + Low Rates: Favors risk assets, boosts valuations, supports speculative bubbles.
Historical Example: The 1970s stagflation period saw equities underperform due to high inflation and rising rates. In contrast, the 2010s "low-rate decade" fueled massive equity rallies.
4.2 Bond Markets
Rising inflation hurts bondholders since fixed payments lose real value. Yields rise to compensate for inflation, causing bond prices to fall.
Interest rate hikes directly impact yields, particularly on short-term government securities.
4.3 Currency Markets
Higher rates typically attract foreign capital, strengthening the domestic currency.
Inflation erodes currency value unless offset by aggressive monetary tightening.
Case Study: The U.S. dollar often strengthens during Federal Reserve hiking cycles, while emerging market currencies weaken due to capital flight.
4.4 Commodities
Commodities like gold, oil, and agricultural products are often seen as hedges against inflation.
Higher interest rates can reduce commodity demand since financing costs rise, but supply shocks may offset this.
4.5 Real Estate
Inflation raises construction costs, boosting property prices.
High interest rates increase mortgage costs, dampening housing demand.
4.6 Alternative Assets (Crypto, Private Equity, Venture Capital)
Cryptocurrencies gained popularity as “inflation hedges,” though their effectiveness is debated.
Low interest rates fuel venture capital and private equity booms, while higher rates reduce risk appetite.
5. Regional & Global Perspectives
5.1 United States
As the world’s largest economy, U.S. inflation and Fed policy significantly shape global markets. The Fed’s actions affect:
Dollar strength (USD as reserve currency)
Capital flows into emerging markets
Global bond yields and equity valuations
5.2 Eurozone
The European Central Bank balances inflation control with fragile growth. Its historically lower rates have influenced capital allocation globally.
5.3 Emerging Markets
Emerging economies are particularly sensitive to U.S. interest rate hikes:
Capital outflows occur as investors chase higher U.S. yields.
Currencies depreciate, making imports costlier and inflation worse.
Governments face debt repayment pressures on dollar-denominated bonds.
Example: Turkey, Argentina, and other EMs have repeatedly faced crises linked to inflation and external rate shocks.
5.4 Asia (China, India, Japan)
China: Inflation is less of a concern; focus is on growth management.
India: Sensitive to global oil prices and capital flows; RBI uses rate adjustments to maintain balance.
Japan: Longstanding deflationary pressures have led to ultra-low/negative rates. Rising global inflation creates challenges for the yen.
6. Historical Lessons
1970s Stagflation: High inflation and weak growth caused equity crashes and bond turmoil.
1980s Volcker Shock: U.S. Fed raised rates sharply, crushing inflation but triggering global debt crises.
2008 Financial Crisis: Ultra-low rates fueled recovery but sowed seeds for asset bubbles.
2020 Pandemic & Aftermath: Stimulus + supply chain disruptions caused inflation surges, forcing aggressive central bank tightening in 2022–23.
Investment Strategies in Inflation & Interest Rate Cycles
Inflation Hedging: Gold, commodities, inflation-linked bonds (TIPS).
Diversification: Across asset classes and geographies to manage volatility.
Sector Rotation: Moving capital into sectors resilient during high inflation (energy, financials).
Duration Management: Shorter-duration bonds during rising rate cycles.
Currency Hedging: Protecting portfolios from FX risks due to rate differentials.
Conclusion
Inflation and interest rates remain the twin pillars shaping global financial markets. Their interplay drives asset valuations, capital flows, and investor psychology. While moderate inflation and stable interest rates foster growth, extremes in either direction often destabilize economies and markets.
For policymakers, the challenge lies in navigating between controlling inflation and supporting growth. For investors, success depends on adapting strategies to different inflation and interest rate environments.
The coming decades may witness structural shifts—climate change, geopolitical realignments, and technological revolutions—that redefine inflationary pressures and interest rate dynamics. Yet, the central truth remains: understanding inflation and interest rates is essential to navigating the ever-evolving global markets.
ESG Investing & Green FinancePart I: Understanding ESG Investing
1. What is ESG?
ESG stands for Environmental, Social, and Governance. It is a framework used by investors to evaluate companies not just on financial performance, but also on how they manage sustainability, ethics, and accountability.
Environmental (E): Measures a company’s impact on the planet—carbon emissions, energy use, waste management, renewable energy adoption, water conservation, pollution control, etc.
Social (S): Assesses how a company treats people—its employees, customers, suppliers, and communities. Issues like labor rights, workplace diversity, data privacy, and community engagement fall here.
Governance (G): Evaluates how a company is managed—board diversity, executive pay, shareholder rights, transparency, anti-corruption policies, etc.
2. Origins of ESG Investing
The roots of ESG investing can be traced back to:
1960s–1970s: Socially Responsible Investing (SRI) emerged. Religious groups and ethical investors avoided companies linked to alcohol, tobacco, gambling, and weapons.
1980s–1990s: Activist investors started pressuring firms on issues like apartheid in South Africa. Many divested from companies operating there.
2000s: Climate change awareness grew, leading to greater focus on corporate environmental performance.
2015 onwards: The Paris Agreement, UN Sustainable Development Goals (SDGs), and growing public concern about climate change propelled ESG to mainstream finance.
3. ESG Investing vs. Traditional Investing
Aspect Traditional Investing ESG Investing
Focus Profit, ROI, growth Profit + sustainability + ethics
Metrics EPS, P/E ratio, ROE ESG scores + financial metrics
Time Horizon Short-to-medium term Long-term resilience
Risk Market risk, credit risk Market + climate + reputational risks
Part II: Key Drivers of ESG Investing
Climate Change and Sustainability Concerns
Rising global temperatures, extreme weather, and natural disasters highlight the risks of ignoring climate change.
Companies that fail to adapt may face legal, regulatory, and reputational risks.
Investor Demand
Millennials and Gen Z, who are more socially conscious, prefer investing in sustainable companies.
ESG-focused mutual funds and ETFs have seen record inflows.
Regulatory Pressure
Governments are mandating climate disclosures. For example, the EU’s Sustainable Finance Disclosure Regulation (SFDR) requires funds to disclose ESG risks.
Corporate Performance Data
Studies show that ESG-aligned companies often outperform peers in the long run due to lower risks, better brand image, and operational efficiency.
Part III: ESG Metrics and Ratings
1. ESG Rating Agencies
Several organizations provide ESG scores to companies, including:
MSCI ESG Ratings
Sustainalytics
Refinitiv
Bloomberg ESG Scores
Each agency uses different criteria, making ESG ratings inconsistent at times. For example, Tesla scores high on environment due to EV leadership, but lower on governance issues.
2. Key Metrics
Carbon emissions (CO2e per unit revenue)
Percentage of renewable energy use
Diversity of board and management
Employee turnover and satisfaction
Transparency in financial reporting
Part IV: Green Finance
1. What is Green Finance?
Green finance refers to financial activities, investments, and instruments specifically designed to support environmentally sustainable projects. Unlike ESG, which is broad, green finance is narrower and directly focused on environmental impact.
Examples include:
Green Bonds (funds raised for renewable energy, clean transport, or sustainable water projects).
Climate Funds (investments in climate change mitigation/adaptation).
Sustainable Loans (corporate loans linked to sustainability targets).
2. Evolution of Green Finance
2007: The European Investment Bank issued the first green bond.
2015: The Paris Climate Agreement boosted funding for green projects.
Today: Green finance is a $2 trillion+ market, with rapid growth in Asia, Europe, and North America.
3. Green Finance vs. ESG Investing
Aspect Green Finance ESG Investing
Scope Narrow (environmental projects only) Broad (environment, social, governance)
Instruments Green bonds, loans, climate funds ESG funds, ETFs, stocks
Purpose Financing climate-friendly initiatives Screening and investing in sustainable companies
Part V: Examples and Case Studies
1. Tesla Inc. (Environment & Social Impact)
Pros: Market leader in EVs, promotes clean energy, reduces carbon dependency.
Cons: Criticism on governance (CEO dominance, workplace safety, and labor issues).
2. Unilever (ESG Leader)
Pioneered Sustainable Living Brands initiative.
Invested heavily in eco-friendly packaging, supply chain ethics, and community programs.
3. Apple Inc.
Committed to becoming carbon neutral by 2030.
Invests in renewable energy for data centers and supply chain sustainability.
4. Green Bonds by Governments
India: Issued sovereign green bonds to finance solar and wind energy.
China: One of the largest issuers of green bonds globally.
EU: Launched “NextGenerationEU” recovery fund with a strong green finance focus.
Part VI: Benefits of ESG & Green Finance
Risk Mitigation – Companies with strong ESG practices face fewer legal and reputational risks.
Long-Term Value Creation – Sustainable companies build resilience against climate and market shocks.
Better Investor Returns – ESG funds often outperform benchmarks over long horizons.
Positive Brand Image – Firms adopting ESG gain consumer trust and loyalty.
Access to Capital – Green finance instruments often come with lower borrowing costs.
Conclusion
ESG investing and green finance are not just trends—they are reshaping global financial markets. By embedding environmental, social, and governance considerations into investment decisions, stakeholders can drive capital towards sustainable and ethical businesses.
While challenges like greenwashing and lack of standardization remain, the direction is clear: the future of finance will be green, responsible, and impact-driven.
Investors, policymakers, and companies who embrace this shift early are likely to reap long-term benefits—not just in profits, but in contributing to a more sustainable planet.

GOLD ROUTE MAP UPDATEHey Everyone,
Another PIPTASTIC day on the charts for us with our 1H chart playing out as analysed with our final target completed today.
After completing 3593, 3613 and then 3638, we stated that we would now look for ema5 cross and lock above 3638 to open 3658. We got the lock and confirmation followed with the target hit - PERFECTION!!
We are now seeing rejection on this level and will use the lower Goldturns for support and bounce. If the range above opens further please review our daily chart and weekly chart updates with higher range levels to continue to track the movement until we update a new 1h chart.
We will continue to buy dips using our support levels taking 20 to 40 pips. As stated before each of our level structures give 20 to 40 pip bounces, which is enough for a nice entry and exit. If you back test the levels we shared every week for the past 24 months, you can see how effectively they were used to trade with or against short/mid term swings and trends.
The swing range give bigger bounces then our weighted levels that's the difference between weighted levels and swing ranges.
BULLISH TARGET
3593 - DONE
EMA5 CROSS AND LOCK ABOVE 3593 WILL OPEN THE FOLLOWING BULLISH TARGETS
3613 - DONE
EMA5 CROSS AND LOCK ABOVE 3613 WILL OPEN THE FOLLOWING BULLISH TARGET
3638 - DONE
EMA5 CROSS AND LOCK ABOVE 3638 WILL OPEN THE FOLLOWING BULLISH TARGET
3658 - DONE
BEARISH TARGETS
3562
EMA5 CROSS AND LOCK BELOW 3562 WILL OPEN THE FOLLOWING BEARISH TARGET
3528
EMA5 CROSS AND LOCK BELOW 3528 WILL OPEN THE SWING RANGE
3492
3470
EMA5 CROSS AND LOCK BELOW 3470 WILL OPEN THE SECONDARY SWING RANGE
3438
3408
As always, we will keep you all updated with regular updates throughout the week and how we manage the active ideas and setups. Thank you all for your likes, comments and follows, we really appreciate it!
Mr Gold
GoldViewFX

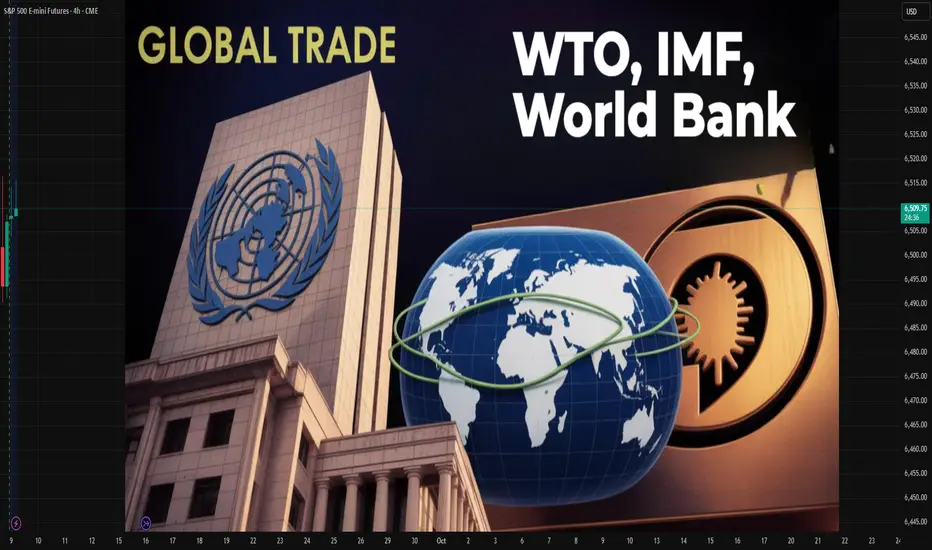
WTO, IMF, and World Bank in Global Trading1. Historical Background of Global Trade Institutions
1.1 The Bretton Woods Conference (1944)
In the aftermath of World War II, world leaders recognized the need for a stable international economic order.
The Bretton Woods Conference, held in New Hampshire, USA, in 1944, gave birth to two major institutions: the IMF and the World Bank.
Their purpose was to rebuild war-torn economies, stabilize currencies, and finance reconstruction.
1.2 The General Agreement on Tariffs and Trade (GATT) and WTO
In 1947, the General Agreement on Tariffs and Trade (GATT) was established to reduce tariffs and encourage trade liberalization.
GATT evolved over decades and was eventually replaced by the World Trade Organization (WTO) in 1995, which took on broader responsibilities in managing international trade rules.
Thus, the global economic framework today rests on three pillars: WTO (trade rules), IMF (financial stability), and World Bank (development financing).
2. World Trade Organization (WTO)
2.1 What is the WTO?
The WTO is the only global organization dealing with the rules of trade between nations. With over 160 member countries, it regulates trade agreements, monitors compliance, and settles disputes.
2.2 Core Objectives
Trade Liberalization – Reduce tariffs, quotas, and other barriers.
Predictability – Ensure stable trade policies through binding commitments.
Non-Discrimination – “Most-Favored Nation” (MFN) treatment, ensuring countries don’t discriminate among trade partners.
Fair Competition – Prevent unfair practices like dumping or subsidies.
Development – Provide special provisions for developing and least-developed countries.
2.3 WTO Functions in Global Trade
Negotiation Forum: Members negotiate trade deals (e.g., Doha Round).
Implementation and Monitoring: Ensures countries comply with trade agreements.
Dispute Settlement: Provides a legal framework to resolve trade conflicts.
Capacity Building: Assists developing nations with trade knowledge.
2.4 Impact of WTO on Global Trade
Dramatic reduction in average tariffs (from >30% in 1947 to <5% today).
Expansion of world trade, allowing developing countries like China, India, and Brazil to emerge as major players.
Legal dispute resolution prevents trade wars and supports stability.
2.5 Criticisms of WTO
Seen as favoring developed nations with stronger bargaining power.
Negotiation rounds often stall due to conflicting interests.
Critics argue WTO undermines national sovereignty by enforcing global rules.
3. International Monetary Fund (IMF)
3.1 What is the IMF?
The IMF is a global financial institution headquartered in Washington, D.C., with 190+ member countries. It ensures the stability of the international monetary system—exchange rates, payments, and cross-border capital flows.
3.2 Objectives of IMF
Exchange Rate Stability – Prevent currency crises and competitive devaluations.
Balance of Payments Assistance – Provide short-term loans to countries in crisis.
Policy Surveillance – Monitor global economic trends and provide policy advice.
Capacity Development – Offer training to strengthen economic institutions.
3.3 Functions in Global Trade
Financing Trade Deficits: Countries with shortages of foreign currency can borrow from IMF to finance imports.
Crisis Management: Provides emergency support during global shocks (e.g., Asian Financial Crisis 1997, Eurozone crisis, COVID-19 pandemic).
Exchange Rate Stability: Prevents destabilizing fluctuations that could disrupt trade.
Confidence Building: By backing countries with funds, IMF assures trading partners of stability.
3.4 IMF Tools
Lending Programs: Stand-By Arrangements, Extended Fund Facility, and Rapid Financing Instrument.
Special Drawing Rights (SDRs): International reserve asset to boost global liquidity.
Surveillance Reports: The World Economic Outlook and Global Financial Stability Report.
3.5 Impact of IMF on Global Trade
Prevents collapse of trade flows by ensuring liquidity.
Encourages trade-oriented reforms in developing countries.
Enhances investor confidence by stabilizing economies.
3.6 Criticisms of IMF
Conditionality: Loans often come with austerity measures, criticized for worsening poverty.
Western Dominance: Voting rights favor developed nations, especially the U.S. and Europe.
One-Size-Fits-All Policies: Structural adjustment programs have been criticized for imposing uniform economic models.
4. World Bank
4.1 What is the World Bank?
The World Bank Group (WBG) is a collection of five institutions, the most prominent being the International Bank for Reconstruction and Development (IBRD) and the International Development Association (IDA). Its primary mission is poverty reduction and long-term development.
4.2 Objectives
Reconstruction & Development – Initially focused on post-war rebuilding, now on infrastructure and growth.
Poverty Reduction – Promote inclusive and sustainable development.
Financing Trade Infrastructure – Ports, roads, digital connectivity, and energy supply that enable trade.
Knowledge Sharing – Research and technical expertise.
4.3 Functions in Global Trade
Financing Development Projects: Infrastructure, education, health, energy.
Trade Facilitation: Improves logistics, reduces transaction costs.
Capacity Building: Helps developing nations integrate into global trade.
Risk Mitigation: Provides guarantees to encourage private investment.
4.4 Impact of World Bank on Trade
Building infrastructure that directly supports trade flows (e.g., transport corridors, ports).
Reducing bottlenecks and making exports competitive.
Encouraging private investment and entrepreneurship in developing markets.
4.5 Criticisms of World Bank
Projects sometimes cause displacement or environmental harm.
Critics argue the Bank pushes neoliberal reforms (privatization, deregulation).
Dependence on debt financing can burden poor countries.
5. Interrelationship Between WTO, IMF, and World Bank
These three institutions are often referred to as the “Bretton Woods Twins + WTO” or the pillars of global economic governance.
WTO → Creates the rules of trade.
IMF → Provides monetary stability for trade.
World Bank → Finances development to enable trade participation.
5.1 Coordination
WTO, IMF, and World Bank hold joint meetings to harmonize policies.
During crises (e.g., 2008 financial crash, COVID-19), they collaborated on stimulus and debt relief.
5.2 Complementary Roles
IMF stabilizes economies so they can continue trade.
World Bank builds the infrastructure that enables countries to trade.
WTO provides the legal framework that governs trade relations.
6. Case Studies
6.1 Asian Financial Crisis (1997)
IMF provided emergency loans to South Korea, Thailand, and Indonesia.
WTO prevented protectionist measures that could have worsened the crisis.
World Bank financed structural reforms in affected economies.
6.2 Global Financial Crisis (2008)
IMF expanded lending and increased SDR allocations.
World Bank financed countercyclical projects in developing countries.
WTO helped prevent a rise in tariffs and trade wars.
6.3 COVID-19 Pandemic (2020–2021)
IMF mobilized trillions in emergency support.
World Bank financed health programs, vaccine distribution, and digital infrastructure.
WTO monitored export restrictions on medical supplies and promoted trade facilitation.
7. Criticism of Global Economic Governance
Despite their contributions, these institutions face criticism:
Power Imbalance: Rich nations have more influence.
Conditionality and Sovereignty: Loans often reduce national autonomy.
Unequal Benefits: Global trade benefits are not equally distributed.
Environmental Concerns: Development projects sometimes harm ecosystems.
8. The Future of WTO, IMF, and World Bank in Global Trade
8.1 Challenges Ahead
Rise of protectionism and trade wars (e.g., U.S.–China tensions).
Global inequality and debt crises in developing countries.
Climate change and sustainable development needs.
Digital trade and financial technology disrupting traditional models.
8.2 Possible Reforms
WTO: Reform dispute settlement system and include digital trade rules.
IMF: Greater representation for emerging economies, flexible conditionality.
World Bank: Stronger focus on climate resilience and sustainable infrastructure.
8.3 Long-Term Role
Together, these institutions will remain crucial in shaping the global trade system—balancing stability, growth, and inclusivity.
Conclusion
Global trade is the lifeblood of the interconnected world economy, but it requires strong institutions to ensure fairness, stability, and sustainability. The WTO provides the rules, the IMF ensures monetary stability, and the World Bank finances development that enables participation in trade.
Though criticized for inequities and structural biases, these institutions have prevented major global trade breakdowns, facilitated economic growth, and enabled developing nations to integrate into the global economy.
In the future, reforms are needed to make them more inclusive, transparent, and responsive to new challenges such as digital trade, climate change, and inequality. Yet, their centrality in global trading remains undisputed—without them, the world economy would be far more unstable, fragmented, and vulnerable to crisis.
Global Corporate Bond Trading1. What Are Corporate Bonds?
A corporate bond is a debt security issued by a corporation to raise money for various purposes such as expansion, acquisitions, refinancing, or working capital.
Issuer: The company borrowing money.
Investor: The buyer of the bond, lending money in exchange for fixed interest payments (coupons).
Maturity: The date when the company repays the bondholder’s principal.
Coupon: The fixed or floating interest paid to the bondholder.
Unlike equities (shares), bonds do not give ownership in the company. They represent a loan, with priority repayment rights if the company faces bankruptcy.
2. Evolution of the Corporate Bond Market
Early History
The first corporate bonds date back to the 19th century, with U.S. railroads raising funds through bonds.
By the 20th century, corporate bonds became a primary source of long-term financing for industrial and service companies.
Global Expansion
After World War II, the U.S. and European companies used corporate bonds heavily to rebuild industries.
In the late 20th century, Japan and emerging markets entered the global bond market.
21st Century Trends
Today, the corporate bond market is highly international. Companies issue bonds in multiple currencies to attract global investors.
Globalization, electronic trading, and credit derivatives (like credit default swaps, CDS) have transformed bond trading into a dynamic, interconnected market.
3. Types of Corporate Bonds
Corporate bonds vary widely. Some key categories are:
Investment-Grade Bonds
Issued by financially strong companies.
Rated BBB-/Baa3 or higher by credit rating agencies.
Lower risk, lower yield.
High-Yield (Junk) Bonds
Issued by riskier companies with lower credit ratings.
Higher yields to compensate investors.
Popular in leveraged buyouts, private equity financing.
Convertible Bonds
Can be converted into equity shares at a set price.
Offer lower coupons due to the equity upside potential.
Callable & Putable Bonds
Callable: Issuer can redeem before maturity.
Putable: Investor can demand early repayment.
Floating-Rate Notes (FRNs)
Coupons linked to benchmarks (LIBOR, SOFR, Euribor).
Protects investors from interest rate risk.
Green, Social, and Sustainability Bonds
Proceeds used for environmentally or socially responsible projects.
Gaining popularity with ESG (Environmental, Social, Governance) investors.
4. The Global Corporate Bond Market Structure
The global corporate bond market is over-the-counter (OTC), meaning most trades are negotiated privately rather than on exchanges.
Primary Market: Where companies issue new bonds (IPOs for debt).
Secondary Market: Where investors buy and sell existing bonds.
Key Centers
U.S.: Largest corporate bond market (over $12 trillion outstanding).
Europe: Active Eurobond market, allowing international issuances in multiple currencies.
Asia: Rapidly growing (China, Japan, India).
Emerging Markets: Corporates from Latin America, Africa, Middle East raising funds globally.
5. Key Participants in Global Corporate Bond Trading
Issuers: Corporations from all industries.
Investors:
Pension funds, insurance companies, sovereign wealth funds.
Banks, hedge funds, mutual funds, retail investors.
Intermediaries:
Investment banks (underwriters, dealers).
Bond traders and brokers.
Regulators:
SEC (U.S.), ESMA (EU), FCA (UK), SEBI (India).
They enforce transparency, fair trading, and investor protection.
Rating Agencies:
Moody’s, S&P, Fitch provide credit ratings.
Crucial in determining yields and investor appetite.
6. Trading Mechanisms
a. Primary Issuance Process
Company hires investment banks as underwriters.
Prospectus prepared and credit rating obtained.
Bonds are priced and distributed to institutional investors.
Listing may occur in global bond markets (Luxembourg, London, Singapore).
b. Secondary Market Trading
Mostly OTC via dealers.
Electronic platforms (MarketAxess, Tradeweb, Bloomberg) growing.
Price discovery less transparent than stocks, but improving with regulation.
c. Settlement
Clearing systems like Euroclear, Clearstream, DTC handle settlements.
Typically T+2 (two business days).
7. Pricing & Valuation
Bond prices depend on:
Interest Rates: Rising rates lower bond prices, and vice versa.
Credit Spreads: Extra yield over government bonds reflecting risk.
Liquidity: Easily tradable bonds fetch higher prices.
Currency Risk: Bonds issued in foreign currencies carry FX exposure.
Market Sentiment: Risk-on vs risk-off cycles influence spreads.
8. Risks in Global Corporate Bond Trading
Credit Risk: Issuer may default.
Interest Rate Risk: Bond values fall when rates rise.
Liquidity Risk: Some bonds hard to trade in secondary markets.
Currency Risk: For bonds issued in foreign currencies.
Event Risk: M&A, lawsuits, regulatory changes affecting issuers.
Systemic Risk: Global crises (e.g., 2008, 2020 COVID) trigger sell-offs.
9. Opportunities and Benefits
Diversification: Corporate bonds add balance to portfolios alongside equities.
Stable Income: Predictable coupon payments.
Capital Preservation: Safer than stocks (especially investment-grade).
Global Access: Investors can gain exposure to different economies and industries.
ESG Investing: Growth of green and sustainable bonds.
10. Global Corporate Bond Market Statistics (as of mid-2020s)
Global corporate bond market exceeds $40 trillion outstanding.
U.S. corporate bonds: ~60% of the global market.
Europe: ~25%, with the Eurobond market dominating.
Asia-Pacific: Fastest-growing, led by China’s state-owned enterprises.
Emerging markets: Increasingly active, especially in USD-denominated bonds.
Conclusion
Global corporate bond trading is the lifeblood of modern capital markets. It connects companies seeking financing with investors searching for income and diversification. The market has evolved from railroad bonds in the 19th century to trillion-dollar electronic platforms today.
For issuers, corporate bonds are a flexible, efficient way to raise capital globally. For investors, they offer income, relative safety, and exposure to global economies. However, the market carries risks—from credit defaults to interest rate shocks—that require careful management.
As technology, regulation, and ESG trends reshape the landscape, global corporate bond trading will continue to play a central role in global finance—bridging corporations and capital on an ever-expanding scale.
Global Government Bond Trading1. Fundamentals of Government Bonds
1.1 What Are Government Bonds?
A government bond is a debt security issued by a country’s treasury or finance ministry to raise money. When an investor buys a government bond, they are lending money to the government in exchange for periodic coupon payments (interest) and repayment of the principal at maturity.
Coupon Bonds: Pay regular interest plus principal at maturity.
Zero-Coupon Bonds: Sold at a discount, repay face value at maturity.
Inflation-Linked Bonds: Adjust coupon/principal with inflation rates.
Savings Bonds / Retail Bonds: Targeted at individual investors.
1.2 Key Features of Government Bonds
Issuer: Sovereign state.
Maturity: Short-term (T-bills), medium-term (notes), long-term (bonds).
Yield: Return investors expect, inversely related to bond price.
Credit Risk: Higher in emerging economies; lower in developed ones.
Liquidity: Developed market bonds (like U.S. Treasuries) are highly liquid, emerging markets less so.
1.3 Importance in Global Finance
Provide a risk-free benchmark rate (e.g., U.S. Treasury yields influence global lending rates).
Used as collateral in repo markets.
Serve as safe-haven assets during crises.
Act as tools for monetary policy (quantitative easing, open market operations).
2. Structure of the Global Government Bond Market
2.1 Primary Market
This is where governments issue new bonds via auctions or syndications. Investors bid for these securities, and the government raises capital.
Auction System: Used by the U.S., UK, Japan. Competitive and non-competitive bidding.
Syndicated Issuance: Banks underwrite and distribute bonds, common in Europe.
2.2 Secondary Market
Bonds are traded between investors after issuance. This provides liquidity and continuous price discovery.
Over-the-Counter (OTC): Majority of global bond trading occurs OTC via dealers.
Electronic Trading Platforms: Growing importance (e.g., Tradeweb, MarketAxess).
2.3 Major Bond Markets
U.S. Treasuries: World’s largest, deepest, and most liquid government bond market.
Eurozone Bonds: German Bunds are benchmark safe assets, Italian and Spanish bonds carry higher yields.
Japanese Government Bonds (JGBs): Very large market but often low yields.
UK Gilts: Highly liquid, influenced by Bank of England policy.
Emerging Market Bonds: Offer higher yields but with currency and default risks (Brazil, India, South Africa).
3. Key Participants in Global Government Bond Trading
3.1 Central Banks
Major holders and buyers of government debt.
Conduct monetary policy through bond purchases (QE) or sales.
Hold government bonds as foreign reserves.
3.2 Institutional Investors
Pension funds, insurance companies, and mutual funds allocate heavily to sovereign debt for predictable returns.
3.3 Hedge Funds & Proprietary Traders
Trade bonds to profit from interest rate changes, arbitrage opportunities, or global macro strategies.
3.4 Foreign Governments & Sovereign Wealth Funds
Invest in foreign government bonds for diversification and reserve management.
3.5 Retail Investors
Participate via government savings bonds, ETFs, and mutual funds.
4. Trading Mechanisms
4.1 Cash Market Trading
Direct purchase/sale of government bonds in the secondary market.
Prices fluctuate with interest rates, inflation expectations, and credit risk.
4.2 Derivatives Market
Futures, options, and swaps based on government bonds or yields.
Example: U.S. Treasury futures (CME), Bund futures (Eurex).
4.3 Repo Market
Repurchase agreements use government bonds as collateral.
Essential for liquidity in the global financial system.
4.4 Electronic Platforms & Algorithmic Trading
Rapid growth in e-trading platforms.
Algorithmic and high-frequency trading now account for a significant share.
5. Factors Affecting Government Bond Prices and Yields
5.1 Interest Rates
Bond prices move inversely with interest rates. Central bank policy shifts directly impact yields.
5.2 Inflation
High inflation reduces real returns, pushing yields higher. Inflation-indexed bonds mitigate this risk.
5.3 Economic Growth
Stronger growth can lead to higher yields due to expectations of rate hikes.
5.4 Fiscal Deficits & Debt Levels
Higher government borrowing can push yields upward due to increased supply and perceived risk.
5.5 Currency Movements
Foreign investors consider exchange rate risks; weaker local currency may deter bond purchases.
5.6 Geopolitical Risk
Wars, sanctions, and political instability drive safe-haven flows into bonds of stable nations.
6. Global Government Bond Trading Strategies
6.1 Buy and Hold
Conservative investors, like pension funds, hold bonds to maturity for stable income.
6.2 Yield Curve Strategies
Steepener: Betting long-term rates rise faster than short-term.
Flattener: Opposite bet.
Butterfly Trades: Exploiting mid-term vs short/long-term curve differences.
6.3 Relative Value / Arbitrage
Traders exploit mispricing between different government bonds.
Example: Spread between U.S. Treasuries and German Bunds.
6.4 Global Macro Plays
Hedge funds trade bonds based on global interest rate cycles, inflation, and geopolitical events.
6.5 Carry Trade in Bonds
Borrowing in low-yield currencies and investing in higher-yield government bonds elsewhere.
7. Risks in Government Bond Trading
7.1 Interest Rate Risk
Sharp changes in central bank policy can cause bond price volatility.
7.2 Inflation Risk
Unexpected inflation erodes real returns.
7.3 Credit Risk
Even sovereigns can default (examples: Argentina, Greece).
7.4 Liquidity Risk
Smaller bond markets may not provide adequate trading liquidity.
7.5 Currency Risk
Foreign bond investors face exchange rate fluctuations.
7.6 Geopolitical Risk
Trade wars, sanctions, and political instability can disrupt markets.
8. Role of Government Bond Markets in Global Economy
Benchmark Rates: Government bond yields influence corporate borrowing costs.
Safe-Haven Assets: During crises, investors flock to bonds like U.S. Treasuries.
Monetary Transmission: Central bank policies work through bond markets.
Fiscal Policy Financing: Governments rely on bonds for infrastructure and welfare spending.
Global Capital Flows: Sovereign bonds drive cross-border capital allocation.
9. Case Studies in Global Bond Markets
9.1 U.S. Treasury Market
Largest and most liquid in the world (~$25 trillion outstanding).
Yields serve as a global reference for risk pricing.
Highly responsive to Federal Reserve policies.
9.2 European Sovereign Debt Crisis (2010–2012)
Greek, Portuguese, Spanish, and Italian bonds saw yield spikes.
Investors demanded higher compensation for perceived default risk.
ECB intervention (OMT, QE) stabilized the markets.
9.3 Japanese Government Bonds (JGBs)
Extremely low or negative yields for decades due to deflationary pressures.
Bank of Japan’s Yield Curve Control (YCC) dominates the market.
9.4 Emerging Market Bonds
Offer higher yields but riskier (Argentina default, Turkey’s currency crisis).
Depend heavily on foreign investor confidence.
10. Future of Global Government Bond Trading
10.1 Digital Transformation
Rise of electronic trading platforms.
Algorithmic and AI-based trading strategies.
10.2 Green & ESG-Linked Sovereign Bonds
Growing issuance of “green bonds” by governments to fund climate projects.
10.3 Impact of Global Debt Levels
Post-pandemic debt burdens remain high.
Long-term sustainability of government borrowing under scrutiny.
10.4 Geopolitical Realignment
U.S.–China rivalry may reshape global bond investment patterns.
“De-dollarization” efforts could impact U.S. Treasury dominance.
10.5 Central Bank Balance Sheets
Unwinding QE will affect bond market liquidity.
“Higher for longer” interest rate regimes may redefine yield structures.
Conclusion
Global government bond trading is the foundation of modern financial markets. It balances risk and safety, yield and liquidity, domestic policy and international capital flows. From U.S. Treasuries as the world’s risk-free benchmark to the volatile sovereign bonds of emerging markets, this market reflects the health of economies, the credibility of fiscal policy, and the confidence of investors.
In times of crisis, investors flock to safe government bonds. In times of growth, they may chase higher yields elsewhere. But regardless of market cycles, government bond trading remains central to how money moves across borders, how interest rates are set, and how nations finance themselves.
As the world transitions into an era of high debt, climate financing, digital trading, and shifting geopolitics, global government bond markets will only grow in importance. Understanding their mechanics is crucial for traders, investors, policymakers, and anyone seeking to grasp the pulse of global finance.

Swap Trading in Foreign MarketsHistorical Background of Swaps
The concept of swaps emerged in the late 1970s and early 1980s. Their development was tied to globalization, deregulation of capital markets, and the increasing volatility of interest rates and exchange rates.
1970s Energy Crisis and Volatility: Rising oil prices and inflation led to volatility in both interest rates and currencies. Companies engaged in cross-border trade needed instruments to hedge risks.
1981 Milestone: The first widely recognized currency swap was executed between the World Bank and IBM. This transaction allowed IBM to access Swiss francs and German marks at lower costs, while the World Bank obtained U.S. dollars without issuing dollar-denominated debt directly.
1980s–1990s: Swaps grew in popularity, particularly interest rate swaps, as corporations and banks used them to restructure liabilities.
2000s and Beyond: The growth of global derivatives markets, along with sophisticated technology and clearing systems, pushed swaps into the mainstream. Today, the Bank for International Settlements (BIS) estimates that the notional amount of outstanding swaps runs into hundreds of trillions of dollars, making it one of the largest segments of the derivatives market.
What is a Swap?
A swap is a derivative contract in which two parties agree to exchange sequences of cash flows for a set period. The cash flows are typically tied to interest rates, currencies, or commodities.
Key features of swaps:
Over-the-Counter (OTC) Nature: Traditionally, swaps are negotiated privately between parties, not traded on exchanges (though post-2008 reforms introduced central clearing for some swaps).
Customizable Terms: Swaps can be structured to meet the specific needs of the parties involved.
No Initial Exchange of Principal (in most cases): Unlike loans, swaps typically involve only the exchange of cash flows, not principal.
Maturity Ranges: Swaps can range from short-term (less than a year) to very long-term (over 30 years).
Types of Swaps in Foreign Markets
1. Interest Rate Swaps (IRS)
An interest rate swap is an agreement where two parties exchange interest payments, typically one fixed rate for one floating rate, on a notional principal amount.
Example: Company A pays fixed 5% interest while receiving LIBOR + 0.5% from Company B.
Usage in foreign markets: Multinational corporations often issue bonds in foreign currencies and then use IRS to manage interest rate exposure.
2. Currency Swaps
A currency swap involves exchanging principal and interest payments in one currency for principal and interest in another currency.
Example: A U.S. company needing euros can swap U.S. dollar payments with a European firm needing dollars.
Significance: Currency swaps are crucial in international finance because they allow companies to obtain foreign currency funding without directly entering the bond markets.
3. Cross-Currency Interest Rate Swaps (CCIRS)
A hybrid form where both currency and interest rate exposures are swapped. It’s common for institutions engaged in global trade and investment.
4. Commodity Swaps
Although less directly linked to currencies, commodity swaps affect global markets. For example, an oil-importing country may hedge price fluctuations by engaging in swaps with oil exporters.
5. Credit Default Swaps (CDS)
These protect against default on debt obligations. While not currency-based, CDS became highly visible during the 2008 Global Financial Crisis and remain a significant global derivative.
Mechanics of Swap Trading
Negotiation and Agreement: Two parties agree on the notional amount, payment dates, interest rate benchmarks, and currencies involved.
Cash Flow Exchanges: On each payment date, cash flows are exchanged as per the agreement.
Settlement: Settlements may be netted (only differences exchanged) or gross (full payments made in respective currencies).
Duration and Termination: Swaps usually last several years but can be terminated early through mutual agreement or by entering into an offsetting swap.
Applications of Swaps in Foreign Markets
1. Hedging
Companies hedge against foreign currency fluctuations when repaying overseas loans.
Importers/exporters lock in favorable exchange rates to protect profit margins.
2. Speculation
Traders take positions on expected changes in interest rates or currency values.
Hedge funds often speculate using cross-currency swaps.
3. Arbitrage
Exploiting differences between interest rates or currency values in different markets.
4. Liquidity Management
Central banks use swaps to provide liquidity in foreign currencies during crises (e.g., Fed swap lines during 2008 and COVID-19 crises).
Global Examples of Swap Usage
U.S. and Europe: Major banks like JPMorgan, Deutsche Bank, and Barclays dominate swap markets.
Asia: Corporations in India, China, and Japan use swaps to manage cross-border investments and trade.
Emerging Markets: Swaps help governments manage external debt denominated in foreign currencies.
Risks in Swap Trading
Credit Risk (Counterparty Risk): If one party defaults, the other may face significant losses.
Market Risk: Movements in interest rates or exchange rates may turn against a party’s position.
Liquidity Risk: Difficulty in unwinding a swap position before maturity.
Operational Risk: Errors in valuation, settlement, or reporting.
Systemic Risk: As swaps are massive in scale, failures in this market can have global implications (e.g., Lehman Brothers’ collapse).
Regulatory Framework
After the 2008 Global Financial Crisis, regulators imposed stricter rules on swaps:
Dodd-Frank Act (U.S.): Mandated central clearing and trade reporting of certain swaps.
EMIR (EU): Similar framework requiring transparency and clearing obligations.
BIS and IOSCO Guidelines: Global bodies ensuring harmonization of rules.
Central clearing via institutions like the London Clearing House (LCH) reduces counterparty risk and increases transparency.
Benefits of Swaps in Foreign Markets
Cost Efficiency: Companies can borrow in favorable markets and swap to required currencies.
Flexibility: Highly customizable structures for specific needs.
Risk Management: Effective hedging against currency and interest rate risks.
Access to Capital: Enables smaller firms and emerging economies to access global funding.
Challenges and Criticisms
Complexity: Difficult for smaller firms to understand and manage.
Systemic Risk: Can amplify crises if misused.
Transparency Issues: OTC nature makes it harder to monitor exposures.
Dependence on Benchmarks: LIBOR scandals highlighted manipulation risks.
The Future of Swap Trading
Transition from LIBOR to SOFR and Other Risk-Free Rates (RFRs): This shift will reshape interest rate swaps globally.
Digital Transformation: Blockchain and smart contracts may increase transparency and reduce operational risks.
Growth in Emerging Markets: Rising global trade will expand demand for currency and cross-currency swaps.
Climate Finance: Green swaps may emerge to align with sustainability goals.
Conclusion
Swap trading in foreign markets is not just a financial innovation; it is the backbone of modern global finance. Whether it is a multinational corporation hedging currency exposure, a government managing external debt, or a central bank stabilizing markets, swaps provide the flexibility, efficiency, and liquidity needed in today’s interconnected world.
While they offer immense benefits, the risks and systemic challenges cannot be ignored. Strong regulation, transparency, and technological evolution will shape the next phase of swap trading. For traders, corporations, and policymakers alike, understanding swaps is essential to navigating the complexities of global finance.
GOLD 1H CHART ROUTE MAP UPDATE Hey Everyone,
Great start to the week with our 1h chart idea playing out, as analysed.
We started with our Bullish target hit at 3593 followed with ema5 cross and lock opening 3613, which was hit perfectly. We then got a further ema5 cross and lock above 3613 opening 3638, also completed today - beautiful!!
We will now look for ema5 cross and lock above 3638 to open the range above or failure to lock above here will follow with a rejection into the lower Goldturns for support and bounce.
We will keep the above in mind when taking buys from dips. Our updated levels and weighted levels will allow us to track the movement down and then catch bounces up.
We will continue to buy dips using our support levels taking 20 to 40 pips. As stated before each of our level structures give 20 to 40 pip bounces, which is enough for a nice entry and exit. If you back test the levels we shared every week for the past 24 months, you can see how effectively they were used to trade with or against short/mid term swings and trends.
The swing range give bigger bounces then our weighted levels that's the difference between weighted levels and swing ranges.
BULLISH TARGET
3593 - DONE
EMA5 CROSS AND LOCK ABOVE 3593 WILL OPEN THE FOLLOWING BULLISH TARGETS
3613 - DONE
EMA5 CROSS AND LOCK ABOVE 3613 WILL OPEN THE FOLLOWING BULLISH TARGET
3638 - DONE
EMA5 CROSS AND LOCK ABOVE 3638 WILL OPEN THE FOLLOWING BULLISH TARGET
3658
BEARISH TARGETS
3562
EMA5 CROSS AND LOCK BELOW 3562 WILL OPEN THE FOLLOWING BEARISH TARGET
3528
EMA5 CROSS AND LOCK BELOW 3528 WILL OPEN THE SWING RANGE
3492
3470
EMA5 CROSS AND LOCK BELOW 3470 WILL OPEN THE SECONDARY SWING RANGE
3438
3408
As always, we will keep you all updated with regular updates throughout the week and how we manage the active ideas and setups. Thank you all for your likes, comments and follows, we really appreciate it!
Mr Gold
GoldViewFX

Bitcoin Quick Buy Opportunity for Quick TradersBTC,
Currently, Bitcoin is trading within a tight consolidation range, caught between a descending trendline and an ascending trendline on the 1-hour chart.
The price is forming a potential compression pattern, which often precedes a breakout.
while volume spikes indicate active demand around the green zone.
Additionally, there are visible whale buy orders and volume confirmation near the ascending trendline shown in the chart, strong enough to potentially push the price higher.
These orders are clustered around 110,650.
I will follow a strategy and enter from the same level.
My plan is as follows:
✅ Entry: Buy if price retraces to green line 110,650
🎯 Target 1: 111,250
🎯 Target 2: 111,600
Please keep monitoring this setup, as I use strategies based on observing supply and demand flows.
I will update you with any changes in entry points, targets, or shifts in order book dynamics.
Important Note:
This is not financial advice.
I am only sharing my own trades and personal analysis, which reflect my individual perspective.
Please always do your own research.
Good luck in your trades.
Best Regards 🌹

Global Hard Commodity Trading1. Understanding Hard Commodities
Hard commodities are natural resources that must be mined, extracted, or produced through industrial processes. They are different from soft commodities, which include agricultural products like wheat, coffee, or cotton.
Examples of Hard Commodities:
Energy Commodities
Crude Oil (Brent, WTI)
Natural Gas
Coal
Uranium
Metals
Precious Metals: Gold, Silver, Platinum, Palladium
Base Metals: Copper, Aluminum, Zinc, Nickel, Lead, Tin
Rare Earth Elements (used in electronics, EVs, clean tech)
Characteristics of Hard Commodities:
Limited in supply, extracted from earth.
Prices are volatile, influenced by global demand and supply shocks.
Traded both physically and financially.
Often priced in US dollars, making them linked to global currency fluctuations.
Hard commodities are critical for energy, manufacturing, construction, defense, and technology sectors, making them a barometer of global economic health.
2. Evolution of Global Hard Commodity Trading
Commodity trading is not new—it dates back thousands of years when civilizations bartered metals, salt, and oil. However, the modern commodity trading system began in the 19th and 20th centuries with the rise of commodity exchanges like the Chicago Mercantile Exchange (CME) and the London Metal Exchange (LME).
Historical Milestones:
19th century: Industrial revolution created huge demand for coal, iron, and copper.
1900s: Oil became the world’s most important energy commodity.
1970s oil shocks: Highlighted the geopolitical importance of commodities.
2000s commodity super-cycle: Rapid demand from China and India fueled a massive rise in metal and energy prices.
Today: Hard commodities are not just traded physically but also heavily speculated on global futures markets.
3. Key Players in Hard Commodity Trading
Trading hard commodities involves a diverse range of participants:
Producers:
Oil companies (ExxonMobil, Saudi Aramco, BP)
Mining giants (Rio Tinto, BHP, Glencore)
Consumers:
Manufacturing companies, refineries, power plants, automakers, construction firms.
Traders & Intermediaries:
Global commodity trading houses like Vitol, Trafigura, Glencore, Gunvor.
These firms buy commodities from producers and sell them to consumers worldwide, often handling logistics, shipping, and financing.
Financial Institutions:
Investment banks (Goldman Sachs, JPMorgan, Morgan Stanley) actively trade in commodity derivatives.
Speculators & Investors:
Hedge funds, mutual funds, and retail traders participate in futures and ETFs for profit.
Governments & Regulators:
OPEC, IEA, WTO, and national regulators influence prices and rules.
4. Major Hard Commodity Markets
4.1 Energy Commodities
Crude Oil: Most traded commodity globally. Benchmarks: Brent (North Sea), WTI (US), Dubai/Oman.
Natural Gas: Key for heating, power generation, and industrial use. LNG (liquefied natural gas) has made gas a global trade.
Coal: Despite clean energy trends, coal still accounts for a major share of electricity generation in Asia.
Uranium: Fuels nuclear energy.
4.2 Metals
Gold & Silver: Precious metals for investment and jewelry. Also safe-haven assets during crises.
Copper: Known as “Dr. Copper” because it signals global economic health—widely used in construction and electronics.
Aluminum, Nickel, Zinc: Critical for cars, infrastructure, and batteries.
Rare Earths: Essential for EVs, wind turbines, semiconductors.
5. How Hard Commodities are Traded
5.1 Physical Trading
This involves the actual movement of goods—oil tankers, copper shipments, coal cargoes. Large trading houses dominate this space, dealing with storage, shipping, and financing.
5.2 Financial Trading
Financial markets allow traders to speculate, hedge, or invest without handling physical goods.
Futures Contracts (CME, LME, ICE)
Options & Swaps
Exchange-Traded Funds (ETFs) linked to commodities
Over-the-Counter (OTC) Derivatives
For example, an airline may hedge jet fuel prices through futures to lock in costs.
6. Price Drivers in Hard Commodity Trading
Hard commodity prices are influenced by a mix of economic, political, and natural factors:
Supply & Demand:
Strong global growth → higher demand for oil, metals.
Supply disruptions (strikes, wars, sanctions) → price spikes.
Geopolitics:
Middle East tensions → oil shocks.
Trade wars → disrupt commodity flows.
Currency Movements:
Most commodities priced in USD. A strong dollar makes them expensive for other countries.
Speculation & Investor Flows:
Hedge funds and ETFs influence short-term price swings.
Technological & Environmental Factors:
EV demand boosts lithium, cobalt, nickel.
Green energy transition reducing coal demand.
Natural Events:
Hurricanes disrupting oil production.
Mining accidents reducing metal supply.
7. Risks in Hard Commodity Trading
Price Volatility: Sharp swings make profits uncertain.
Political Risk: Sanctions, wars, and nationalization.
Credit Risk: Default by counterparties.
Logistics Risk: Shipping delays, storage costs.
Regulatory Risk: Changing government rules.
Environmental Risk: Climate policies reducing fossil fuel demand.
Traders use hedging strategies and risk management tools to minimize exposure.
8. Global Trade Hubs & Exchanges
London Metal Exchange (LME): Key center for base metals.
New York Mercantile Exchange (NYMEX): Crude oil, natural gas.
Intercontinental Exchange (ICE): Brent crude, energy futures.
Shanghai Futures Exchange (SHFE): China’s growing influence.
Dubai Mercantile Exchange (DME): Oil contracts for Middle East & Asia.
Physical hubs include Rotterdam (oil), Singapore (oil & LNG), Shanghai (metals), Dubai (gold).
9. Role of Technology in Hard Commodity Trading
Technology is transforming commodity trading:
AI & Algorithms for price forecasting.
Blockchain for trade finance and supply chain transparency.
Big Data & IoT to track shipments and consumption trends.
Digital platforms replacing traditional paper-based contracts.
10. Future of Hard Commodity Trading
Energy Transition:
Demand for oil may peak in coming decades.
Growth in renewables and metals like lithium, cobalt, nickel.
Green Commodities:
Carbon credits becoming tradable assets.
ESG (Environmental, Social, Governance) shaping investment choices.
China & India’s Role:
Asia will remain the biggest consumer of hard commodities.
Geopolitical Fragmentation:
Sanctions, supply chain shifts, and regional alliances may create “commodity blocs.”
Digitalization:
More algorithm-driven and blockchain-powered commodity trading.
Conclusion
Global hard commodity trading is more than just an economic activity—it is the heartbeat of the world economy. Energy, metals, and minerals not only determine industrial growth but also shape geopolitics, financial markets, and future technologies.
While the industry faces challenges of volatility, climate change, and regulatory shifts, it is also evolving rapidly with digitalization, green energy, and new demand sources.
For traders, investors, and policymakers alike, understanding hard commodity markets is essential—not just to profit, but also to anticipate global economic and political shifts.
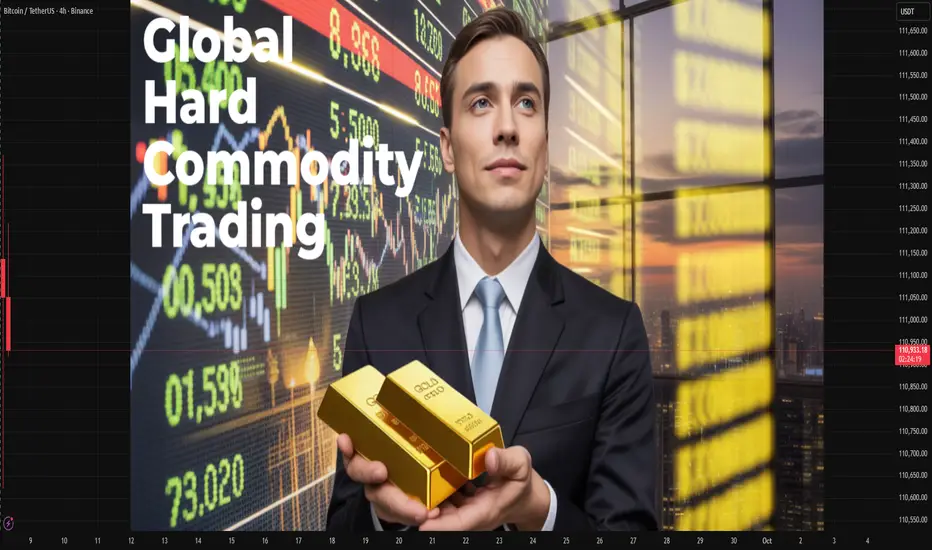
Options in Forex Trading1. Introduction to Forex Options
Foreign exchange (Forex or FX) is the largest and most liquid financial market in the world, where currencies are traded around the clock. Beyond spot trading, which involves buying one currency against another for immediate delivery, there exists another powerful derivative instrument: Forex Options.
Forex Options allow traders and investors to speculate on or hedge against the future movement of currency exchange rates without the obligation to actually buy or sell the currency. This flexibility makes them a popular tool among global corporations, hedge funds, institutional investors, and even sophisticated retail traders.
In simple terms: a Forex Option gives you the right, but not the obligation, to buy or sell a currency pair at a specific price before or on a specific date.
This guide explores Forex Options in detail—how they work, their types, strategies, pricing, risks, benefits, and real-world applications.
2. What Are Forex Options?
A Forex Option is a contract that gives the holder the right (but not the obligation) to exchange money in one currency for another at a pre-agreed exchange rate (strike price) on or before a specific date (expiry date).
Unlike spot or forward forex contracts, where transactions are binding, options give the trader a choice: they can either exercise the option or let it expire worthless, depending on market conditions.
Buyer of an option → Pays a premium upfront for the right.
Seller (writer) of an option → Receives the premium but assumes the obligation if the buyer exercises the contract.
This asymmetry in risk and reward is what makes options unique and powerful.
3. Basic Terminologies in Forex Options
Before diving deeper, it’s essential to understand some key terms:
Call Option – Right to buy a currency pair at the strike price.
Put Option – Right to sell a currency pair at the strike price.
Strike Price (Exercise Price) – The agreed exchange rate at which the option can be exercised.
Expiration Date – The last date on which the option can be exercised.
Premium – The price paid by the buyer to the seller for the option.
In-the-Money (ITM) – Option has intrinsic value (profitable if exercised now).
Out-of-the-Money (OTM) – Option has no intrinsic value (not profitable if exercised).
At-the-Money (ATM) – Current spot rate equals strike price.
European Option – Can only be exercised at expiry.
American Option – Can be exercised anytime before expiry.
4. How Do Forex Options Work?
Let’s take an example:
You believe that the EUR/USD (Euro vs US Dollar) pair, currently trading at 1.1000, will rise in the next month.
You buy a 1-month EUR/USD call option with a strike price of 1.1050, paying a premium of $500.
Possible outcomes:
If EUR/USD rises to 1.1200 → Your option is In-the-Money. You can exercise and buy euros cheaper than the market price. Profit = Gain – Premium.
If EUR/USD stays below 1.1050 → The option expires worthless. Loss = Premium paid ($500).
This example shows the limited risk (premium only) but unlimited upside potential for option buyers.
5. Types of Forex Options
There are multiple types of Forex Options available in global markets:
5.1 Vanilla Options (Standard Options)
The most common type.
Includes call and put options.
Available in both European and American styles.
5.2 Exotic Options
More complex and tailored contracts, often used by corporations and institutions. Examples:
Binary Options – Pay a fixed amount if the condition is met, otherwise nothing.
Barrier Options – Activated or deactivated if the currency reaches a certain level.
Digital Options – Similar to binary but with different payoff structures.
Lookback Options – Payoff depends on the best or worst exchange rate during the contract period.
Exotics are less common for retail traders but popular in corporate hedging.
6. Why Trade Forex Options?
6.1 Benefits
Hedging tool – Protect against adverse currency moves.
Leverage with defined risk – Premium is the maximum loss.
Flexibility – Traders can profit from bullish, bearish, or neutral markets.
Non-linear payoffs – Unlike forwards/futures, options have asymmetric risk-reward.
6.2 Limitations
Premium cost can be high, especially during volatile markets.
Complexity in pricing and strategies.
Not as liquid as spot forex for retail traders.
7. Pricing of Forex Options (The Greeks & Black-Scholes)
Pricing options is complex because many factors affect the premium:
Spot exchange rate
Strike price
Time to expiration
Volatility of the currency pair
Interest rate differential between two currencies
The most common pricing model is the Black-Scholes Model, adapted for currencies.
Traders also use The Greeks to measure risks:
Delta – Sensitivity of option price to currency movement.
Gamma – Sensitivity of delta to price changes.
Theta – Time decay (loss of value as expiry approaches).
Vega – Sensitivity to volatility.
Rho – Sensitivity to interest rates.
Understanding these helps traders manage risk effectively.
8. Forex Option Trading Strategies
8.1 Single-Leg Strategies
Buying Calls – Bullish view on a currency pair.
Buying Puts – Bearish view on a currency pair.
8.2 Multi-Leg Strategies
Straddle – Buy a call and put at the same strike/expiry to profit from volatility.
Strangle – Buy OTM call and put (cheaper than straddle).
Butterfly Spread – Limited-risk strategy betting on low volatility.
Collar Strategy – Combine a protective put and covered call to limit risk.
8.3 Corporate Hedging
Exporters may buy put options to protect against a falling foreign currency.
Importers may buy call options to hedge against rising foreign currency costs.
9. Risks in Forex Options
Premium Loss – Buyers can lose the entire premium.
Unlimited Loss for Sellers – Option writers face potentially large losses.
Liquidity Risk – Some exotic options may not have an active secondary market.
Complexity – Advanced strategies require deep knowledge.
Market Volatility – Unexpected events (e.g., central bank interventions) can drastically alter outcomes.
10. Real-World Applications of Forex Options
10.1 Corporate Hedging
A US company expecting payment in euros may buy a put option on EUR/USD to protect against euro depreciation.
10.2 Speculation
Hedge funds may use straddles around major events (like US Fed announcements) to profit from volatility.
10.3 Arbitrage
Traders exploit mispricings between spot, forwards, and options.
10.4 Risk Management
Central banks and large financial institutions sometimes use options to stabilize foreign reserves.
Conclusion
Forex Options are a sophisticated financial instrument that combines flexibility, leverage, and risk management. Unlike spot and forward contracts, they provide the right but not the obligation to trade currencies, making them a versatile tool for hedgers and speculators alike.
While options can protect businesses from currency risk and provide retail traders with powerful speculative opportunities, they require deep knowledge of pricing, volatility, and strategies. Misuse or lack of understanding can lead to significant losses, especially for option writers.
In the ever-evolving forex market, where geopolitical events, economic policies, and global trade dynamics influence currency prices, Forex Options remain one of the most effective instruments for managing uncertainty and capitalizing on opportunities.
Forward & Futures Forex TradingChapter 1: Basics of Forex Derivatives
1.1 What are Forex Derivatives?
A derivative is a financial instrument whose value depends on the price of an underlying asset. In forex, derivatives derive their value from currency exchange rates.
Common forex derivatives include:
Forwards – customized OTC contracts.
Futures – standardized exchange-traded contracts.
Options – rights but not obligations to exchange currencies.
Swaps – agreements to exchange cash flows in different currencies.
1.2 Why Use Forex Derivatives?
Hedging: To protect against adverse currency movements.
Speculation: To profit from expected exchange rate movements.
Arbitrage: To exploit price discrepancies across markets.
Chapter 2: Forward Forex Contracts
2.1 What is a Forward Contract?
A forward contract is a private agreement between two parties to buy or sell a specified amount of currency at a predetermined exchange rate on a future date.
Example:
A U.S. importer agrees today to buy €1 million from a bank in three months at an agreed exchange rate of 1.10 USD/EUR. Regardless of the spot rate in three months, the importer must pay at that rate.
2.2 Key Features of Forward Contracts
Customization: Amount, maturity date, and settlement terms are negotiable.
Over-the-Counter (OTC): Not traded on exchanges, but arranged between banks, institutions, and corporations.
Obligation: Both buyer and seller are bound to fulfill the contract.
No upfront payment: Typically requires no premium, though banks may ask for collateral.
2.3 Types of Forward Contracts
Outright Forward – standard agreement for a fixed amount and date.
Flexible Forward – allows settlement within a range of dates.
Non-Deliverable Forward (NDF) – cash-settled in one currency, often used for restricted currencies (e.g., INR, CNY).
Window Forward – permits multiple drawdowns during a period.
2.4 Participants in Forward Contracts
Corporations – hedge imports/exports.
Banks – provide liquidity and quotes.
Hedge Funds – speculate on currency movements.
Central Banks – occasionally use forwards to manage reserves.
Chapter 3: Forex Futures
3.1 What are Futures Contracts?
A forex futures contract is a standardized agreement traded on an exchange to buy or sell a currency at a predetermined price on a specified future date.
Example:
A trader buys a EUR/USD futures contract expiring in December at 1.1050. If the euro strengthens, the futures price rises, and the trader profits by selling the contract later.
3.2 Key Features of Futures Contracts
Standardization: Contract size, maturity, and tick value are fixed by the exchange.
Exchange-Traded: Offered on platforms like CME (Chicago Mercantile Exchange).
Daily Settlement: Marked-to-market each day, with gains/losses credited/debited.
Margin Requirement: Traders must deposit initial and maintenance margins.
Liquidity: High in major currency pairs like EUR/USD, GBP/USD, and JPY/USD.
3.3 Common Forex Futures Contracts
EUR/USD futures
GBP/USD futures
JPY/USD futures
AUD/USD futures
Emerging market currency futures (less liquid but growing).
3.4 Participants in Futures Contracts
Speculators – retail and institutional traders betting on price moves.
Hedgers – corporations, exporters, and importers.
Arbitrageurs – exploit mispricing between spot, forward, and futures.
Chapter 4: Forwards vs Futures – Key Differences
Feature Forwards Futures
Market OTC (private contracts) Exchange-traded
Standardization Fully customized Standard contract sizes/dates
Settlement On maturity Daily mark-to-market
Counterparty Risk Higher (depends on bank/party) Low (exchange clearinghouse guarantees)
Liquidity Varies by bank relationship High in major pairs
Flexibility High Low
Usage Hedging (corporates) Hedging & speculation (traders/investors)
Chapter 5: Pricing and Valuation
5.1 Forward Pricing Formula
Forward exchange rate = Spot rate × (1 + interest rate of base currency) / (1 + interest rate of quote currency).
Example:
Spot EUR/USD = 1.1000
USD interest rate = 5% p.a.
EUR interest rate = 3% p.a.
1-year forward = 1.1000 × (1.05 / 1.03) ≈ 1.1214
5.2 Futures Pricing
Futures pricing is similar but adjusted for:
Daily settlement (mark-to-market).
Exchange trading costs.
Slight deviations from theoretical parity due to liquidity.
Chapter 6: Strategies with Forwards & Futures
6.1 Hedging Strategies
Importer Hedge: Lock in forward rate to avoid rising costs.
Exporter Hedge: Lock in forward to protect against falling revenues.
Futures Hedge: Use standardized contracts to offset exposure.
6.2 Speculation Strategies
Directional Trades: Bet on EUR/USD rising or falling using futures.
Carry Trade via Forwards: Exploit interest rate differentials.
Spread Trading: Trade differences between spot and futures.
6.3 Arbitrage Opportunities
Covered Interest Arbitrage: Lock in risk-free profits by exploiting discrepancies between forward rates and interest rate differentials.
Cash-and-Carry Arbitrage: Use spot and futures price mismatches.
Chapter 7: Risks in Forward & Futures Trading
7.1 Risks in Forwards
Counterparty Risk – the other party may default.
Liquidity Risk – difficult to unwind before maturity.
Regulation Risk – OTC contracts less transparent.
7.2 Risks in Futures
Margin Calls – sudden volatility can wipe out traders.
Leverage Risk – high leverage amplifies losses.
Market Risk – currency volatility due to geopolitical or economic shocks.
Chapter 8: Real-World Applications
8.1 Corporate Hedging Example
Airline Company: A U.S. airline buying aircraft from Europe may use a forward to lock in EUR/USD exchange rate for payment due in six months.
8.2 Speculator Example
Futures Trader: A hedge fund expects USD to weaken against EUR and buys EUR/USD futures contracts. If EUR rises, profits are made without ever handling physical currency.
8.3 Emerging Market Case
Indian IT Exporter: Uses USD/INR forward contracts to protect revenue from U.S. clients.
Chapter 9: Regulatory Environment
Forwards: Governed by ISDA agreements in OTC markets.
Futures: Regulated by exchanges (CME, ICE) and oversight bodies (CFTC in the U.S., ESMA in Europe).
Basel III Framework: Requires banks to hold capital for counterparty risks in derivatives.
Chapter 10: The Future of Forward & Futures Forex Trading
Digitalization: Rise of electronic platforms for forward trading.
Crypto Futures: Growing demand for crypto/forex hybrid products.
AI & Algo Trading: Automated strategies dominating futures markets.
Emerging Market Growth: Increasing use of forwards in Asia and Latin America.
Conclusion
Forward and futures forex contracts are cornerstones of global currency trading, serving hedgers, speculators, and arbitrageurs alike.
Forwards provide customized, flexible solutions for corporations to hedge currency risk.
Futures offer standardized, liquid, and transparent trading instruments for both hedging and speculation.
Both carry risks—from counterparty risk in forwards to leverage and margin risks in futures—but they remain indispensable tools in managing the uncertainties of currency markets.
In today’s interconnected economy, where exchange rate volatility is influenced by central bank policies, geopolitical events, and global trade flows, forward and futures forex trading will continue to be critical for risk management and investment strategies worldwide.
Real Estate Market Trading (Global Property Investments)Chapter 1: The Evolution of Global Real Estate
1.1 From Land Ownership to Investment Vehicles
Historically, real estate was limited to direct ownership—buying a plot of land or a house. Over time, as capital markets developed, new vehicles like real estate funds, REITs, and securitized mortgages emerged, democratizing access to property investments.
Pre-20th Century: Land was tied to agriculture and feudal wealth.
Post-WWII Era: Rapid urbanization and industrialization led to housing booms worldwide.
1980s–2000s: Financial innovation enabled securitization of mortgages and global property funds.
2008 Crisis: Highlighted risks of over-leveraged real estate trading (subprime mortgage collapse).
2020s: Rise of proptech, tokenization, and cross-border property investments via digital platforms.
1.2 The Shift to Globalization
Earlier, real estate was local in nature. Today, with international capital mobility, investors in Singapore can own shares of an office building in New York or a luxury resort in Dubai. Sovereign wealth funds, pension funds, and hedge funds now treat real estate as a core part of global portfolios.
Chapter 2: Types of Global Property Investments
2.1 Direct Real Estate Investments
Residential Properties: Apartments, villas, and multi-family housing.
Commercial Properties: Office towers, co-working spaces, retail malls.
Industrial Properties: Warehouses, logistics hubs, data centers.
Hospitality & Tourism: Hotels, resorts, serviced apartments.
Specialty Real Estate: Senior housing, student accommodation, hospitals.
2.2 Indirect Investments
REITs (Real Estate Investment Trusts): Publicly traded companies that own income-generating property.
Property Funds & ETFs: Diversified funds that invest in global or regional properties.
Private Equity Real Estate: Institutional funds targeting high-value projects.
Securitized Real Estate Products: Mortgage-backed securities (MBS).
2.3 New Age Investments
Fractional Ownership: Platforms enabling small-ticket investments in high-value properties.
Tokenized Real Estate: Blockchain-based ownership shares, allowing cross-border property trading.
Green Real Estate Funds: Focus on sustainable buildings and energy-efficient assets.
Chapter 3: Key Drivers of the Global Real Estate Market
3.1 Economic Growth & Income Levels
A strong economy boosts demand for housing, office spaces, and retail outlets. Conversely, recessions often lead to property price corrections.
3.2 Interest Rates & Monetary Policy
Real estate is heavily credit-dependent. When interest rates are low, borrowing is cheaper, encouraging investments. Rising rates often dampen demand and lower valuations.
3.3 Demographics & Urbanization
Young populations drive housing demand.
Aging populations create demand for healthcare and senior housing.
Rapid urban migration boosts infrastructure and property markets in developing nations.
3.4 Technology & Infrastructure
Digital transformation (proptech, AI-driven valuations, blockchain).
Smart cities with IoT-based energy-efficient buildings.
Infrastructure like airports, metros, and highways pushing property values higher.
3.5 Globalization of Capital
Cross-border investments have increased, with Asia-Pacific, Middle East, and European investors pouring capital into North American and emerging-market properties.
3.6 Geopolitical & Environmental Factors
Wars, sanctions, and political instability impact property flows.
Climate change increases demand for resilient, green buildings.
Government housing policies and tax incentives drive local markets.
Chapter 4: Global Real Estate Market Segments
4.1 Residential Real Estate
The backbone of real estate, influenced by population growth, income levels, and mortgage availability. Trends include:
Affordable housing demand in emerging markets.
Luxury housing in global hubs like London, Dubai, and New York.
Vacation homes and short-term rental platforms (Airbnb model).
4.2 Commercial Real Estate (CRE)
Includes offices, malls, and business parks. Post-pandemic trends show:
Hybrid work models reducing demand for traditional office space.
E-commerce boosting logistics and warehousing investments.
Retail shifting from malls to experiential centers.
4.3 Industrial Real Estate
A rising star due to global supply chain realignment:
Warehouses and cold storage facilities.
Data centers (digital economy backbone).
Renewable energy sites (solar and wind farms).
4.4 Hospitality & Tourism Properties
Tourism recovery post-COVID has reignited hotel investments. Countries like UAE, Thailand, and Maldives remain hotspots.
Chapter 5: Real Estate Trading Mechanisms
5.1 Traditional Trading
Direct purchase and sale of land or property.
Long holding periods with rental income.
5.2 Listed Market Trading
Buying and selling REITs, property ETFs, and securitized debt instruments on stock exchanges.
High liquidity compared to physical property.
5.3 Digital & Tokenized Trading
Blockchain enables fractional trading of global assets. For example, an investor in India can purchase a $100 token representing part ownership of a Manhattan office tower.
Chapter 6: Global Hotspots for Property Investment
6.1 North America
United States: Largest REIT market; strong demand in tech hubs like Austin, Miami, and San Francisco.
Canada: Rising immigration boosting residential demand in Toronto and Vancouver.
6.2 Europe
UK: London remains a luxury real estate hub.
Germany: Berlin attracting investors due to stable rental yields.
Spain & Portugal: Tourism-driven real estate and golden visa programs.
6.3 Asia-Pacific
China: Slowdown due to debt-laden developers, but still massive market.
India: Affordable housing, commercial hubs (Bengaluru, Hyderabad), and REITs gaining traction.
Singapore & Hong Kong: Financial hubs attracting global property capital.
6.4 Middle East
UAE (Dubai, Abu Dhabi): Tax-free status, global expat community, and luxury real estate boom.
Saudi Arabia: Vision 2030 fueling mega infrastructure projects.
6.5 Emerging Markets
Africa (Nigeria, Kenya, South Africa): Urbanization and infrastructure push.
Latin America (Brazil, Mexico): Tourism and housing demand.
Chapter 7: Risks in Global Property Trading
7.1 Market Risks
Price volatility due to economic cycles.
Oversupply in certain regions leading to price corrections.
7.2 Financial Risks
Rising interest rates increasing borrowing costs.
Currency fluctuations impacting cross-border investors.
7.3 Political & Regulatory Risks
Changes in property laws, taxes, or ownership rights.
Political instability reducing foreign investment appetite.
7.4 Environmental & Climate Risks
Properties in flood-prone or disaster-prone zones losing value.
Higher costs of compliance with green regulations.
Chapter 8: Future of Global Property Investments
8.1 Technology Transformation
AI for predictive property valuations.
Metaverse real estate and digital land ownership.
Smart contracts automating property transactions.
8.2 Green & Sustainable Real Estate
Global shift toward ESG investing is pushing developers to build carbon-neutral buildings. Green bonds tied to real estate are gaining momentum.
8.3 Institutional Dominance
Pension funds, sovereign funds, and insurance companies will continue to dominate large-scale global property deals.
8.4 Democratization via Tokenization
Retail investors gaining access to billion-dollar properties through blockchain-powered fractional ownership.
Chapter 9: Strategies for Investors
Diversification – Spread across geographies and property types.
Long-Term Vision – Real estate rewards patience.
Leverage Smartly – Avoid overexposure to debt.
Follow Macro Trends – Urbanization, interest rates, and technology adoption.
Risk Mitigation – Use insurance, hedging, and local partnerships.
Conclusion
Real estate market trading and global property investments represent one of the most dynamic and resilient avenues of wealth creation. While challenges exist—such as rising rates, geopolitical uncertainty, and climate risks—the fundamental demand for land and property is eternal. The shift toward digital ownership, sustainability, and cross-border capital flows ensures that the real estate sector will continue to evolve as a global marketplace.
For investors, success lies in combining local insights with global perspectives, diversifying portfolios, embracing technology, and staying agile to adapt to changing market conditions.
In many ways, real estate is no longer just about “location, location, location”—it’s about innovation, globalization, and sustainability.
Global Index TradingIntroduction
Global financial markets are deeply interconnected. From the bustling streets of New York to the trading floors in Tokyo, stock markets react not just to domestic events but also to global developments. Investors often find it overwhelming to track thousands of individual stocks across different countries. This is where global indices come in.
Global indices—such as the S&P 500, Dow Jones, NASDAQ, FTSE 100, Nikkei 225, Hang Seng, and DAX—act as benchmarks that represent the performance of a basket of leading companies in a region or sector. Instead of focusing on a single stock, traders can participate in the performance of an entire economy, sector, or region by trading indices.
Global index trading has grown rapidly due to its simplicity, diversification benefits, and ability to capture worldwide economic movements. Whether through futures, ETFs, CFDs, or options, traders can speculate or hedge using indices.
This article explores what index trading is, how it works, its strategies, risks, advantages, and future trends, giving you a complete 360° understanding.
What is an Index?
An index is a statistical measure that tracks the performance of a group of assets. In financial markets, stock indices track a basket of company stocks.
For example:
S&P 500 → Tracks 500 largest US-listed companies.
Nikkei 225 → Represents 225 blue-chip companies listed in Japan.
FTSE 100 → Covers 100 top UK companies listed on the London Stock Exchange.
DAX 40 → Represents 40 major German companies.
By trading these indices, investors gain exposure to entire markets instead of picking individual stocks.
Why Trade Global Indices?
Diversification → Instead of betting on one company, you’re trading the collective performance of many.
Global Exposure → Access to markets worldwide (US, Europe, Asia).
Liquidity → Indices are highly traded, ensuring smooth entry and exit.
Transparency → Indices reflect real-time global economic conditions.
Opportunities in Both Directions → Traders can go long (buy) when bullish or short (sell) when bearish.
Hedging Tool → Investors hedge their portfolios against global uncertainties using index futures and options.
Major Global Indices
1. United States
Dow Jones Industrial Average (DJIA) → Tracks 30 blue-chip companies.
S&P 500 → Broadest and most followed US index (500 companies).
NASDAQ Composite → Tech-heavy index with over 3,000 companies.
2. Europe
FTSE 100 (UK) → UK’s top 100 companies.
DAX 40 (Germany) → German giants like BMW, Siemens, Allianz.
CAC 40 (France) → French market benchmark.
3. Asia-Pacific
Nikkei 225 (Japan) → Japan’s premier stock index.
Hang Seng (Hong Kong) → Reflects China’s corporate strength.
Shanghai Composite (China) → Mainland Chinese companies.
ASX 200 (Australia) → Australia’s top companies.
4. Emerging Markets
Nifty 50 (India) → India’s top 50 companies.
Bovespa (Brazil) → Brazil’s leading stock index.
RTS Index (Russia) → Russia’s blue-chip stocks.
These indices act as economic barometers, and traders worldwide monitor them daily.
How Global Index Trading Works
Trading indices isn’t about buying the index itself (since it’s just a number). Instead, traders use financial instruments tied to the index’s value:
Index Futures
Standardized contracts to buy/sell the index at a future date.
Example: S&P 500 futures.
Used by institutional investors for speculation and hedging.
Index Options
Provide the right (not obligation) to buy/sell indices at specific levels.
Useful for hedging against sudden market drops.
Exchange-Traded Funds (ETFs)
Funds that replicate index performance.
Example: SPY (S&P 500 ETF).
Suitable for long-term investors.
Contracts for Difference (CFDs)
Popular in retail trading.
Allow traders to speculate on index price movements without owning underlying assets.
Factors Influencing Global Indices
Index values fluctuate based on:
Economic Data
GDP growth, inflation, employment data.
Corporate Earnings
Quarterly earnings of large companies drive indices.
Central Bank Policies
Interest rate hikes or cuts (Fed, ECB, BOJ).
Geopolitical Events
Wars, trade disputes, elections.
Global Sentiment
Risk-on (bullish) vs. risk-off (bearish) moods.
Currency Movements
Strong/weak currencies affect export-driven companies.
Popular Strategies in Global Index Trading
Trend Following
Identify long-term trends and ride momentum.
Example: Buying NASDAQ during a tech boom.
Swing Trading
Capturing medium-term moves within global index cycles.
Day Trading / Scalping
Taking advantage of small intraday price fluctuations.
Hedging Strategies
Using index futures to protect portfolios during uncertainty.
Pairs Trading
Trade two correlated indices (e.g., long S&P 500 and short FTSE 100).
Arbitrage
Exploiting price inefficiencies between futures, ETFs, and spot indices.
Benefits of Global Index Trading
Simplicity: No need to analyze thousands of individual stocks.
Lower Volatility: Compared to single stocks, indices move more steadily.
Cost Efficiency: ETFs and CFDs allow exposure at low costs.
24-Hour Opportunities: With different time zones, global indices provide nearly round-the-clock trading.
Risks in Global Index Trading
Market Volatility
Events like COVID-19 caused sharp global index crashes.
Leverage Risk
Futures/CFDs use leverage, magnifying losses.
Systemic Risks
Global crises (2008 Financial Crash, 2020 Pandemic) affect all indices simultaneously.
Currency Risk
Non-domestic traders face forex risks.
Overexposure
Heavy index positions without proper diversification may backfire.
Case Studies of Global Index Movements
1. 2008 Global Financial Crisis
US housing bubble burst → Dow Jones & S&P 500 crashed 50%.
Global indices (Nikkei, FTSE, DAX) followed suit.
2. COVID-19 Pandemic (2020)
Panic selling → Dow fell 3,000 points in a day.
Stimulus packages → Strong rebound across all indices.
3. US Tech Boom (2010s)
NASDAQ outperformed due to Apple, Amazon, Google, Microsoft.
Tech indices became global growth drivers.
Tools & Platforms for Index Trading
MetaTrader (MT4/MT5)
Thinkorswim
Interactive Brokers
TradingView (for charting)
Bloomberg & Reuters (for news updates)
Future of Global Index Trading
Increased ETF Popularity → More passive index investments.
AI & Algo Trading → Automated strategies dominating global index flows.
Thematic Indices → ESG, clean energy, tech-focused indices growing.
Crypto Indices → Crypto-linked index trading gaining traction.
24/7 Trading → Expansion of round-the-clock index trading.
Tips for Beginners
Start with major indices (S&P 500, NASDAQ, DAX).
Use demo accounts before live trading.
Avoid over-leverage.
Follow global news & central bank updates.
Combine technical and fundamental analysis.
Conclusion
Global index trading offers a powerful, diversified, and accessible way to participate in financial markets. Instead of picking individual winners, traders can ride the economic waves of entire regions. While opportunities are vast, one must remain cautious of risks like leverage, volatility, and systemic crises.
For long-term investors, global index ETFs provide steady growth aligned with global economic progress. For traders, futures, options, and CFDs open doors to both speculative profits and hedging strategies.
In today’s interconnected world, global index trading is no longer optional—it’s essential for anyone looking to understand and profit from international financial markets.
GOLD 1H CHART ROUTE MAP UPDATE & TRADING PLAN FOR THE WEEKHey Everyone,
Please see our updated 1h chart levels and targets for the coming week.
We are seeing price play between two weighted levels with a gap above at 3593 and a gap below at 3562. We will need to see ema5 cross and lock on either weighted level to determine the next range.
We will see levels tested side by side until one of the weighted levels break and lock to confirm direction for the next range.
We will keep the above in mind when taking buys from dips. Our updated levels and weighted levels will allow us to track the movement down and then catch bounces up.
We will continue to buy dips using our support levels taking 20 to 40 pips. As stated before each of our level structures give 20 to 40 pip bounces, which is enough for a nice entry and exit. If you back test the levels we shared every week for the past 24 months, you can see how effectively they were used to trade with or against short/mid term swings and trends.
The swing range give bigger bounces then our weighted levels that's the difference between weighted levels and swing ranges.
BULLISH TARGET
3593
EMA5 CROSS AND LOCK ABOVE 3593 WILL OPEN THE FOLLOWING BULLISH TARGETS
3613
EMA5 CROSS AND LOCK ABOVE 3613 WILL OPEN THE FOLLOWING BULLISH TARGET
3638
EMA5 CROSS AND LOCK ABOVE 3638 WILL OPEN THE FOLLOWING BULLISH TARGET
3658
BEARISH TARGETS
3562
EMA5 CROSS AND LOCK BELOW 3562 WILL OPEN THE FOLLOWING BEARISH TARGET
3528
EMA5 CROSS AND LOCK BELOW 3528 WILL OPEN THE SWING RANGE
3492
3470
EMA5 CROSS AND LOCK BELOW 3470 WILL OPEN THE SECONDARY SWING RANGE
3438
3408
As always, we will keep you all updated with regular updates throughout the week and how we manage the active ideas and setups. Thank you all for your likes, comments and follows, we really appreciate it!
Mr Gold
GoldViewFX

GOLD DAILY CHART ROUTE MAPDaily Chart Update
Range Break, Gap Confirmation & Next Target Achieved
As anticipated in our previous update, price finally pushed through for a test of 3433, confirming the strength of the upside momentum we discussed. This test produced a candle body close gap open for 3564, which has now been successfully achieved just as projected.
The close above 3564 further unlocks 3683 as the next long-term upside target. An EMA5 lock will serve as added confirmation for continuation toward this zone. Meanwhile, both 3564 and 3433 now transition into key support levels for this chart idea.
Current Outlook
🔹 3564 Target Reached
Our gap target has now been completed with a decisive candle body close above. This confirms bullish continuation and shifts focus to the next zone.
🔹 Next Objective – 3683
The successful 3564 break opens a fresh long-term target at 3683. EMA5 lock confirmation will strengthen the case for this move.
Updated Key Levels
📉 Support – 3272 (pivotal floor)
📉 Short Term Supports – 3433 & 3564
📈 Resistance / Next Upside Objective – 3683
Thanks as always for your continued support,
Mr Gold
GoldViewFX
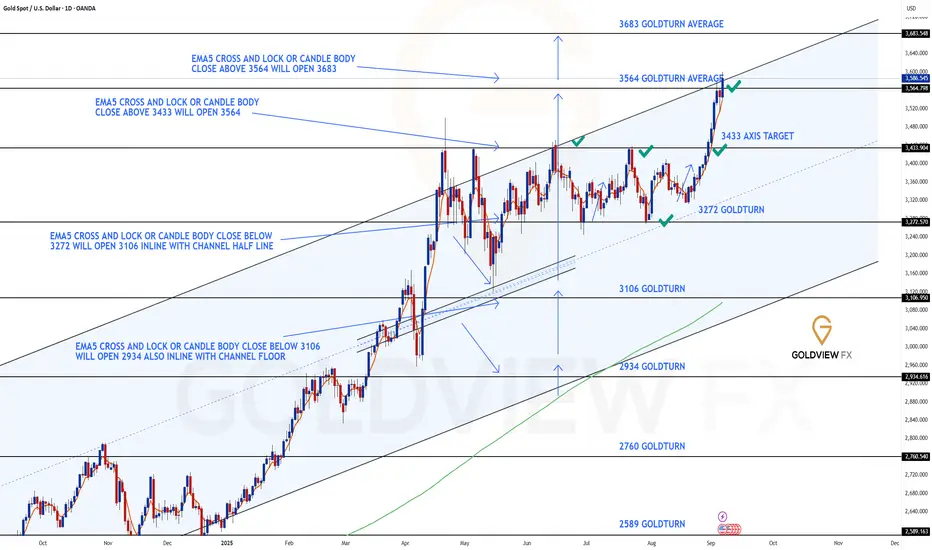
GOLD WEEKLY CHART MID/LONG TERM ROUTE MAPWeekly Chart Update
As anticipated, we got the 3482 gap target hit just as projected. Momentum carried further into the final channel top target at 3576, completing the upper channel move.
Current Outlook
🔹 Gap Targets Achieved
Both 3482 and 3576 have now been met. Price action delivered cleanly into these objectives, validating the prior bullish structure.
🔹 Candle Body Close Above 3576
The weekly body close above the channel top at 3576 has now opened the door to the larger 3659 long-term gap target. EMA5 would provide further confirmation if momentum sustains.
🔹 Channel Top Now Key Test
We need to see 3576 - 3482 (channel top) hold as support to confirm the new range zone play. If it holds, the 3659 - 3732 range becomes the next bullish zone. Failure to provide support above 3482 - 3576 will mean the breakout is short-lived, with risk of a swift correction back down.
🔹 Range Support Levels
3576 and 3482 now act as layered support levels to keep the bullish case intact within this range.
Updated Levels to Watch
📉 Support – 3482 & 3576
Key supports for this new range. Holding above 3576 strengthens the case for continuation toward 3659. A failure back below 3576 puts 3482 into play as the next defensive level.
📈 Resistance – 3659
The newly opened long-term gap target. This becomes the next upside objective if structure holds above 3576.
Plan
With 3482 and 3576 achieved, focus shifts to the 3659 gap. The bullish continuation depends on 3576 holding as support. If buyers defend it, the range extends upward into new territory. If not, expect a sharp corrective move back into the prior range.
Thanks as always for your support,
Mr Gold
GoldViewFX
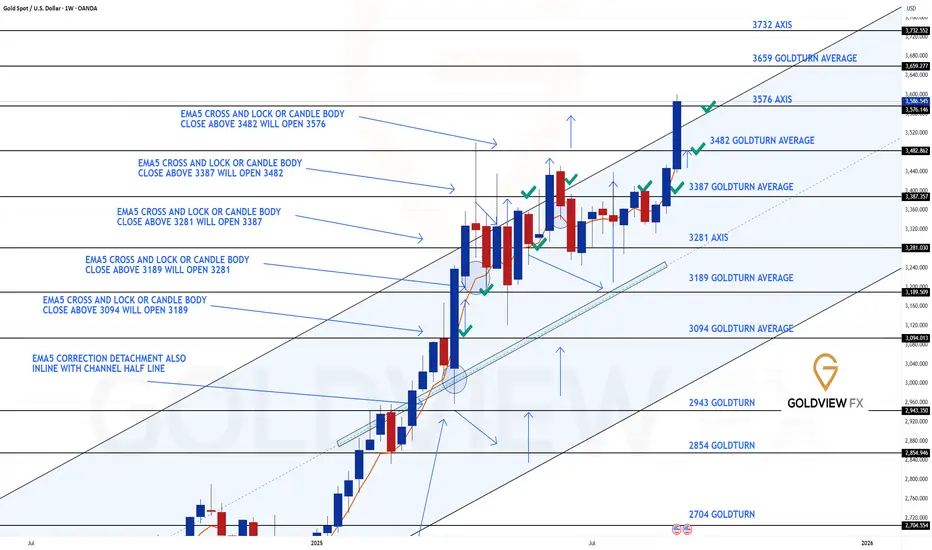
Role of Technology in Global Markets 1. Historical Evolution of Technology in Markets
a. Early Communication Systems
In the 1800s, financial markets were largely local. Traders depended on physical meetings or handwritten letters to exchange market information.
The invention of the telegraph (1837) and later the telephone (1876) dramatically reduced the time it took to transmit financial information across cities and countries. For example, stock prices could be sent from New York to London in minutes instead of weeks.
b. Electronic Trading Emergence
The 20th century saw the development of electronic ticker systems, allowing near real-time updates of market prices.
By the 1970s and 1980s, exchanges began experimenting with electronic order-matching systems. NASDAQ, founded in 1971, became the world’s first electronic stock exchange.
c. The Internet Revolution
The 1990s introduced the internet into global markets. Online trading platforms allowed retail investors to directly access markets without relying solely on brokers.
E-commerce platforms like Amazon and Alibaba transformed global consumer markets, while digital communication allowed businesses to operate internationally with ease.
d. 21st-Century Transformations
Today’s markets are dominated by high-frequency trading (HFT), artificial intelligence (AI)-driven strategies, blockchain technologies, cloud computing, and mobile financial services.
Cross-border investing is instantaneous, and global markets operate nearly 24/7 with technology as their backbone.
2. Key Roles of Technology in Global Markets
a. Enhancing Market Efficiency
Technology reduces information asymmetry by providing real-time access to prices, news, and economic data.
Algorithms match buyers and sellers instantly, narrowing bid-ask spreads and improving liquidity.
b. Democratization of Access
Earlier, only wealthy institutions could access sophisticated markets. Now, mobile apps and online brokerages allow small retail investors across the world to trade with minimal costs.
Platforms like Robinhood, Zerodha, and eToro have expanded participation, enabling global capital flows.
c. Speed and Automation
High-frequency trading systems can execute thousands of trades per second, exploiting micro-price differences across exchanges.
Automation has also entered settlement systems. For example, blockchain-based smart contracts can settle cross-border payments instantly, reducing costs and delays.
d. Integration of Global Trade and Supply Chains
Technology supports global commerce through logistics software, digital supply chain management, and e-commerce.
Platforms like Amazon, Alibaba, and Shopify connect producers in one country directly with consumers worldwide.
e. Data and Analytics
Markets today thrive on data. Artificial intelligence and machine learning analyze billions of data points—from satellite images to social media sentiment—to predict economic and financial trends.
Big data tools allow investors and companies to manage risks better, anticipate market shifts, and optimize operations.
f. Financial Innovation
Technology has given rise to new asset classes such as cryptocurrencies, NFTs, and tokenized securities.
Decentralized Finance (DeFi) platforms now allow global lending, borrowing, and investing without intermediaries.
3. The Role of Technology Across Market Segments
a. Stock Markets
Stock exchanges globally, like NYSE, NASDAQ, London Stock Exchange, and NSE India, operate through highly advanced trading platforms.
Investors across the world can place trades in milliseconds, and order books are updated in real-time.
AI-driven portfolio management tools (robo-advisors) help retail investors diversify globally at low costs.
b. Foreign Exchange (Forex) Markets
The forex market is the world’s largest, trading over $7 trillion daily. Technology enables real-time currency trading across time zones.
Electronic Communication Networks (ECNs) match global buyers and sellers, improving liquidity and reducing barriers.
Mobile apps allow individuals to hedge against currency risk or speculate, regardless of location.
c. Commodities and Energy Markets
Technology enables smart logistics, digital commodity trading platforms, and automated hedging strategies.
For oil, metals, and agricultural products, satellite data and IoT devices provide real-time production and supply information, improving transparency.
d. Cryptocurrency and Digital Assets
Blockchain technology has created entirely new forms of global markets.
Bitcoin, Ethereum, and other cryptocurrencies trade on global exchanges accessible 24/7.
DeFi protocols allow people to lend, borrow, and earn interest globally without banks.
e. E-commerce and Consumer Markets
Global consumer markets are dominated by digital platforms. Amazon, Alibaba, Flipkart, and Mercado Libre connect sellers and buyers worldwide.
Payment technologies like PayPal, UPI, and digital wallets facilitate seamless cross-border transactions.
4. Benefits of Technology in Global Markets
Accessibility: Investors and businesses worldwide can participate, regardless of geography.
Efficiency: Faster transactions, lower costs, and transparent processes.
Liquidity: Electronic platforms ensure deep pools of buyers and sellers.
Innovation: Emergence of new asset classes and financial instruments.
Transparency: Real-time reporting and monitoring reduce fraud and insider advantages.
Inclusivity: Small investors and businesses gain entry into markets once dominated by large institutions.
5. Risks and Challenges of Technology in Global Markets
a. Cybersecurity Threats
Global markets face risks of hacking, data breaches, and fraud.
High-profile exchange hacks (like Mt. Gox in 2014) show how vulnerable digital markets can be.
b. Market Volatility
Algorithmic trading sometimes amplifies volatility, as seen in the “Flash Crash” of May 2010 when the Dow dropped nearly 1,000 points within minutes.
c. Digital Divide
While technology democratizes access, millions worldwide remain excluded due to lack of internet, devices, or digital literacy.
d. Regulatory Challenges
Cross-border digital markets are hard to regulate uniformly. For example, cryptocurrency regulations differ drastically between countries, creating uncertainty.
e. Over-Reliance on Technology
System failures, outages, or glitches can halt global trading. For instance, NYSE and NSE India have both faced trading halts due to technical issues.
6. The Future of Technology in Global Markets
a. Artificial Intelligence (AI) and Machine Learning
AI will further automate trading, risk management, and fraud detection.
Predictive analytics will become central to investment decisions.
b. Blockchain and Decentralization
Blockchain has the potential to eliminate intermediaries in global markets, reducing costs and improving efficiency.
Tokenization may allow fractional ownership of real-world assets like real estate and art.
c. Quantum Computing
Quantum technology could revolutionize market modeling, encryption, and trading strategies, offering new levels of computational power.
d. Sustainable and Green Technology
Technology will enable carbon credit markets, renewable energy trading platforms, and ESG-focused investing.
Blockchain can track supply chain sustainability and ethical sourcing.
e. Global Financial Inclusion
Mobile banking and fintech will bring billions of unbanked individuals into the global financial system, especially in developing nations.
7. Case Studies
Robinhood and Gamestop (2021): Showed how technology and social media democratize access but also create risks of market manipulation.
Alibaba Singles’ Day Sales: A showcase of how e-commerce technology creates global consumer demand, with billions in sales in a single day.
Cryptocurrency Boom: Bitcoin’s rise to a trillion-dollar asset class highlights the disruptive role of blockchain in global finance.
Tesla’s Global Supply Chain: Use of AI, automation, and digital logistics to manage global production and delivery networks.
Conclusion
Technology is not just an enabler but the backbone of modern global markets. It drives speed, efficiency, innovation, and inclusivity, ensuring that capital, goods, services, and information flow seamlessly across borders. However, its power also comes with risks—cyber threats, volatility, inequality, and regulatory challenges—that must be managed carefully.
As we look ahead, technology’s role will only deepen, with AI, blockchain, and fintech shaping the next wave of market evolution. The ultimate challenge will be to harness technology’s benefits while creating safeguards that ensure global markets remain fair, stable, and inclusive for all.

Shaping Global Trade & Currencies1. Historical Evolution of Trade & Currencies
1.1 Early Trade Systems
Ancient civilizations engaged in barter-based trade, exchanging goods like grains, spices, and metals.
The Silk Road connected Asia, the Middle East, and Europe, becoming one of the earliest global trade routes.
Precious metals such as gold and silver became the first universally accepted currencies for trade.
1.2 Emergence of Modern Currencies
With the rise of kingdoms and empires, coins and paper money replaced barter.
Colonialism reshaped trade routes, with European powers dominating maritime trade.
The gold standard (19th century) linked currencies to gold, bringing stability to global exchange.
1.3 Bretton Woods System
After World War II, the 1944 Bretton Woods Agreement established the US dollar as the anchor currency, pegged to gold.
Institutions like the International Monetary Fund (IMF) and World Bank were created to stabilize trade and finance.
The system collapsed in 1971 when the US abandoned the gold standard, leading to today’s system of floating exchange rates.
2. The Dynamics of Global Trade
2.1 Drivers of Global Trade
Comparative advantage: Countries trade based on their strengths (e.g., oil-rich Middle East, tech-driven US, manufacturing hub China).
Global supply chains: Modern production spans multiple countries (e.g., iPhones designed in the US, assembled in China, components from Japan, Korea).
Technology: Digital platforms, container shipping, and logistics efficiency made cross-border trade faster and cheaper.
Trade liberalization: Free trade agreements (FTAs), regional blocs like EU, NAFTA, ASEAN, and the role of the WTO facilitated tariff reduction.
2.2 Trade Balances & Deficits
Countries with trade surpluses (exports > imports) accumulate foreign reserves (e.g., China, Germany).
Trade deficits (imports > exports) often weaken currencies (e.g., US, India at times).
Persistent imbalances create currency tensions and trade wars.
2.3 Role of Multinational Corporations
MNCs control global supply chains, influence trade volumes, and hedge against currency risks.
Companies like Apple, Toyota, and Amazon shape currency demand through cross-border transactions.
3. The Role of Currencies in Global Trade
3.1 Currency as a Medium of Exchange
Trade requires settlement in common units of value—currencies like USD, Euro, Yen, Yuan.
The US Dollar dominates, accounting for ~60% of global reserves and ~80% of trade invoicing.
3.2 Exchange Rate Systems
Fixed Exchange Rates – pegged to another currency (e.g., Hong Kong Dollar to USD).
Floating Exchange Rates – determined by supply-demand in forex markets (e.g., Euro, Yen).
Managed Exchange Rates – central banks intervene to stabilize value (e.g., Indian Rupee, Chinese Yuan).
3.3 Impact of Currency Fluctuations on Trade
A strong currency makes exports expensive but imports cheaper.
A weak currency boosts exports but makes imports costlier.
Example: Japan often benefits from a weaker Yen, aiding its export-driven economy.
4. Key Institutions Shaping Trade & Currencies
4.1 International Monetary Fund (IMF)
Provides financial stability and currency support.
Monitors exchange rate policies and prevents currency manipulation.
4.2 World Trade Organization (WTO)
Regulates global trade rules.
Resolves trade disputes between nations.
4.3 World Bank
Provides development financing to support trade infrastructure.
Helps emerging economies integrate into global trade.
4.4 Central Banks
Influence currency values via interest rates, monetary policies, and interventions.
Examples: US Federal Reserve, European Central Bank, Reserve Bank of India.
4.5 Regional Trade Blocs
EU (single market, Eurozone).
ASEAN, NAFTA/USMCA.
African Continental Free Trade Agreement (AfCFTA).
5. Geopolitics & Trade-Currency Relations
5.1 Currency Wars
Nations sometimes deliberately devalue currencies to gain export advantage.
Example: China accused of “currency manipulation” by the US.
5.2 Trade Wars
Tariffs, sanctions, and restrictions reshape global flows.
Example: US-China trade war disrupted supply chains and currency stability.
5.3 Sanctions & Currency Power
Dominance of USD allows the US to enforce sanctions by restricting access to its financial system.
Russia, Iran, and others explore alternative settlement systems to bypass USD dominance.
6. Technology & the Future of Trade and Currencies
6.1 Digital Trade
E-commerce and digital platforms enable small businesses to participate globally.
Services trade (software, fintech, education) grows faster than goods trade.
6.2 Fintech & Payments
SWIFT, blockchain, and digital payment networks revolutionize settlements.
Cryptocurrencies like Bitcoin challenge traditional currency systems.
Central Bank Digital Currencies (CBDCs) are emerging as official digital currencies (China’s e-CNY, India’s Digital Rupee).
6.3 Automation & AI
AI-powered logistics and predictive analytics optimize global supply chains.
Digital platforms reduce transaction costs and improve cross-border efficiency.
7. Risks & Challenges in Trade & Currencies
7.1 Exchange Rate Volatility
Currency swings create uncertainty for exporters and importers.
Companies hedge risks via futures, forwards, and options.
7.2 Protectionism
Rise of nationalism and tariffs disrupt free trade principles.
Example: Brexit altered EU-UK trade dynamics.
7.3 Global Inequality
Developed nations often dominate trade benefits, leaving poorer economies vulnerable.
Currency crises in emerging markets (Argentina, Turkey, Sri Lanka) highlight fragility.
7.4 Climate Change & Sustainability
Green trade policies and carbon taxes affect global competitiveness.
Currency values may shift as nations transition to renewable energy.
8. Case Studies
8.1 US Dollar Dominance
Despite challenges, USD remains the global reserve currency.
Stability of US institutions, deep financial markets, and global trust sustain its dominance.
8.2 China’s Yuan Strategy
China pushes Yuan internationalization through Belt & Road projects, trade invoicing, and currency swaps.
Inclusion of Yuan in IMF’s Special Drawing Rights (SDR) basket strengthened its global role.
8.3 Eurozone & Euro
Euro became the second-most traded currency.
But crises like Greece’s debt problems revealed structural weaknesses.
8.4 Emerging Markets
India, Brazil, and others promote local currency trade settlements.
Reduces reliance on USD and improves currency stability.
9. The Future of Global Trade & Currencies
9.1 Multipolar Currency World
Rise of Yuan, Euro, and digital currencies may reduce US dollar dominance.
Regional blocs may settle trade in local currencies.
9.2 Digital Transformation
CBDCs and blockchain-based trade finance could replace traditional banking channels.
Smart contracts may automate trade settlements.
9.3 Sustainable Trade
Carbon-neutral policies, green financing, and ESG compliance will reshape trade.
Currencies of nations leading in green technology may gain strength.
9.4 Resilient Supply Chains
Post-COVID-19, countries diversify supply chains to reduce dependency on one region (e.g., China+1 strategy).
Trade and currency flows adapt to new production hubs (Vietnam, India, Mexico).
Conclusion
Global trade and currencies are inseparable forces driving the world economy. Trade enables nations to leverage comparative advantages, while currencies facilitate exchange and measure competitiveness. Over centuries, from barter to digital currencies, both systems evolved alongside geopolitics, technology, and institutional frameworks.
Today, challenges like protectionism, exchange rate volatility, and sustainability shape the future. At the same time, opportunities such as digital transformation, multipolar currencies, and green trade create new pathways.
Ultimately, the shaping of global trade and currencies reflects a balance between cooperation and competition, tradition and innovation, stability and disruption. The future will likely witness a hybrid world—where digital currencies coexist with traditional systems, regional trade complements global flows, and sustainability becomes a defining factor.
Global trade and currencies, therefore, are not just economic concepts but also mirrors of human progress, resilience, and interconnected destiny.
