Gold clings to gains around $2,000 amid softer US Dollar, focus
Gold price is holding its steady ascent in the European session. The bright metal retakes the HKEX:2 ,000 mark, helped by a defensive US Dollar but the upside remains capped due to the renewed advance in the US Treasury bond yields. US GDP awaited.
Tradingpatterns

Wealth Unleashed: Wedge Pattern Power - Hidden Gem Revealed!Introduction : Are you looking to skyrocket your trading profits? Look no further! Today, we will uncover the hidden gem of trading patterns: the Wedge Pattern. This powerful tool has the potential to transform your trading strategy and help you achieve financial success. Let's dive into the world of wedge patterns and explore how you can capitalize on their power.
What are Wedge Patterns?
Wedge patterns are popular among traders due to their high probability of forecasting trend reversals. These patterns appear when the price of an asset consolidates between converging support and resistance lines. There are two primary types of wedge patterns: the rising wedge and the falling wedge.
Rising Wedge:
In an upward trend, the rising wedge is considered a bearish pattern. It forms when the price consolidates between an upward-sloping support line and an upward-sloping resistance line that are converging. As the price approaches the apex of the wedge, the upward momentum weakens, signaling a potential trend reversal to the downside.
Falling Wedge:
Contrary to the rising wedge, the falling wedge is a bullish pattern. It appears in a downward trend when the price consolidates between a downward-sloping support line and a downward-sloping resistance line that are converging. As the price nears the apex of the wedge, the downward momentum loses strength, indicating a possible trend reversal to the upside.
Trading Strategies:
To capitalize on the power of wedge patterns, follow these steps:
✅Identify the pattern: Observe the chart for converging support and resistance lines to spot a rising or falling wedge pattern.
✅Confirmation: Wait for a breakout from the wedge pattern, either above the resistance line (for falling wedges) or below the support line (for rising wedges).
✅Entry point: Open a long position after a breakout above the resistance line in a falling wedge, or a short position after a breakout below the support line in a rising wedge.
✅Stop-loss and take-profit: Set your stop-loss order below the breakout level (for falling wedges) or above the breakout level (for rising wedges). Establish your take-profit target at a level that aligns with your risk-reward ratio and trading plan.
Conclusion:
The wedge pattern is a hidden gem that can potentially boost your trading profits when used correctly. By mastering the art of identifying and trading wedge patterns, you can strengthen your technical analysis skills and increase your chances of success in the market. Remember, no single tool guarantees success, so always use additional technical indicators and maintain a disciplined approach to risk management. Happy trading!


USDCAD: W for Wendetta, Another Short is ComingAfter our successful USDCAD short trade using the "Flag" pattern as a bearish continuation, we have another opportunity slowly but steadily forming in the kitchen. If we zoom out, we can see that this is all a part of the W (double bottom pattern) that has been formed due to recent USD weakness. The common misconception here is that, people sometimes expect bullish continuation after this pattern as they think it's a ranging box. The reality is usually quite opposite. Don't get caught in this. The box is usually has a few more uniform length touches on both sides. On the other hand..
The W trading pattern, also known as the double bottom pattern, is a popular trading pattern used in TA. It is a bullish reversal pattern that occurs after a downtrend, signaling a potential change in trend direction.
The W pattern consists of two low points, or "troughs," separated by a peak in the middle. The price drops to the first trough, then rises to the peak, and then drops again to form the second trough, which is approximately at the same level as the first trough. The two troughs should be spaced relatively equally apart, with the peak forming a "W" shape.
Our plan is to let the price retrace a little (potentially to the most recent 0.618 Fib level), gain more momentum, so we can break the lower barrier and continue our downtrend further on.

HELIUM 4 hr hidden bull divHeres another idea .....
this time Helium on the 4 hr chart, it caught my eye as this is one of the coins with the 4 hr stoch rsi low,
Hidden Bull Div gives some probability to the upside.
Looks to me like a V shape recovery Adam and Eve played out.
It has already ripped through the 200 SMA and now in a bull flag.
Could it be a huge cup and now in the handle for a huge pump, or was the cup and handy before the pump through the 200 SMA.
The golden cross zipped through and price action responded.
Measured move upto 2.2 range with a bit of resistance around 1.9
Moving averages look like they want to curl up nicely
Money flow does look a little bearish with it moving down but could flip,
4 hour rsi wants to rip in my opinion :)
Peace and love everyone :)


GBP/USD strong breakout expectedIf the lower level of range breaks move till 1.20500 can be seen in short term and if the upper range breaks than upper target of 1.22600 can be achieved

USD/JPY 1 hr analysis Price is trading between two important lavel on hourly timeframe if break below 131.721 good trade can be made on short side and if it break above 133.76 than a long trade is activated
Scalping trade on lower timeframe is also possible below 132.311 with proper risk management


BTC Short 1:11I'm seeing a lot of resistance, and ascending wedge and possible H&S. TP point for the short are on the chart.

EOS : INCREASE VIEWEOS seems to make a new exciting increase view on a low time frame.
We will follow it coming 24H to see if it can gain.

GBPCAD chart analysisHey everyone,
In this analysis, price is showing us a slight bullish correction after the sharp impulse. which indicate the phase is about to complete impulse>correction>impulse.
Now my bias for this is a buy on possible touch on trendline.
WHAT ARE WE EXPECTING:
# a lower time frame bullish continuation pattern to form/break of trendline
HOW DO WE ENTER:
# rejections candles for risky entry
# for reduce risk entry we need to see a break of trendline followed by a retest or a lower time frame correction
INVALID SETUP
# when you see a sharp impulse followed by a bearish continuation correction which means trend change
TARGET:
# top of slight correction
THANKS FOR READING
AS ALWAYS TRADE SAFE AND STAY SAFE!!

Bitcoin is now expected to reach levels 23.8K - K22.4 - K21.5The first target was reached by Bitcoin yesterday, by a slight difference, and the price bounced from it, and it is expected to return to touching this level, and it is considered a minor and weak support, and it can be broken easily
Today, it is expected to break 22.8K, and head towards the second support levels at 22.4K, and it is likely to be broken if the rise continues on Dominance Tether..

How to Become a Top Trader ?(1)
Hello everyone, I will publish an article on how to become a top trader on the platform recently, and it will be updated continuously. This is the first article. The first thing I need to teach you is how to establish a correct investment psychology.
It is easy for novice investors to fall into a misunderstanding, especially wanting to make a profit in this market quickly, but in fact, trading is a very long process. Only through your continuous learning and a deeper understanding of the market, your wealth will increase , instead of treating trading as a gamble, and only relying on luck to make short-term profits, but as time goes by, due to lack of knowledge of the market, it will eventually lead to continuous losses.
Why do I talk about investment psychology in the first article, because I think that if the mentality of entering the market at the beginning is wrong, it will be difficult to have a good result, so I hope that after reading this article, you can have A correct investment psychology is to put our investment route on a longer-term basis, instead of hoping that a wave of market prices will make you rich overnight. You must know that Bitcoin has been an extremely long process from its release to now.
If you agree with my investment philosophy, then I hope you can pay attention to my follow-up articles. In addition to daily market analysis, I will also tell you what good habits you need to have to become a top trader. Any questions, you can comment below the article, thank you for your support and love.

Five things every beginner must know
Many people enter because they know that this market can make people rich, but if you don't know these five things, you will only be ruthlessly harvested by the market.
First: When all the analysis of the market and retail investors are firm that the market will go in a certain direction, you need to be vigilant, don't follow blindly, always believe that the truth is often in the hands of a few people, follow the "Eighty-Twenty" rule in the market, and keep a calm head.
Second: Understand the importance of stop loss. No one can guarantee that every transaction is profitable, so when the direction is wrongly judged, you must stop the loss in time. Sometimes a small loss can be considered a profit. A real master has the courage to face himself If you make a mistake, you can keep your principal to have a chance to come back..
Third: Understand the importance of stop profit, never think about earning the last copper plate in the market, because the market is changing rapidly, only the money earned in your own pocket is real, otherwise it is just a jumping number.
Fourth: Don't enter the market against the trend. When the overall market trend is one-sided, you can choose to wait and see if you don't enter the market ahead of time. Don't choose to go against the trend or enter the market forcefully. You know, the market will happen every day, you only need to catch one or two waves, and entering the market at an inappropriate time will only make you passive.
Fifth: Don’t treat trading as a gamble, and don’t take heavy positions. I personally recommend keeping the position at one-third to better resist risks. Blindly increasing your position will only make your situation more passive.
Each of the above points needs to be experienced slowly. If you can strictly implement them, then congratulations, you are considered an entry-level trader, but if you still want to continue to advance, there is still a long way to go. In addition to analyzing the market, I will also share more trading experience with my friends.
If you encounter any problems in the current transaction, you can leave me a message at any time, and I will reply to you. Thank you for your attention and let us make progress together

AUD.NZD rising wedgeHello Traders,
AUD.NZD daily seems to be forming a rising wedge.
Usually when there's a rising wedge, price seems to break to the downside.
I'm definitely watching this pair to see where price will break!
What do you think about this chart? Do you think it will break to the downside? thoughts?
Have a great day!
Samantha

The most common mistakes in trading
Today, I will share a practical secret that I have learned for many years. Don’t hesitate when trading. If you hesitate, then don’t trade in the short term.
Many people also have the habit of making trading plans. For example, I will enter the market at any position today, but when the opportunity really arises, I hesitate to make a decision. After the market ends, I find that I have made a profit, but I did not enter the market, and wait until the opportunity appears again. At that time, I thought to wait a little longer, but it turned out to be profitable again, and I still didn’t enter the market. Finally, I finally made up my mind that the next time I was in this position, I would definitely enter the market. As a result, when he entered the market, what he ushered in was a loss.
In fact, in the trading market, good entry opportunities are fleeting and will not come often. If frequent entry opportunities appear, it must be a trap. When you have made a plan, all you need to do is Strictly implement, if you have no confidence when you enter the market, then I suggest that you do not make any transactions in the short term, because your plan has been disrupted, and the market likes to confuse your eyes and challenge your bottom line. It's also a psychological game.
I make my trading plan every day and strictly implement it, so friends who follow me can receive my plan as soon as possible, which can be used as a reference, but I will choose to enter the market at the first time, if you hesitate, choose the second The second or third chance to enter the market, the probability of loss will increase a lot, so don’t do this, you can consult me to get the latest plan.
❤️Please, support my work with like, thank you!❤️

How to become a master trader?
First:Making Plans
Before trading every day, make a trading plan, so how to make a good plan?
Take XAUUSD for example,If you mainly focus on short-term operations, focus on the key support and key resistance within the day, buy up at the support level, buy down at the resistance level, sell high and buy low, if you cannot accurately determine where the support and resistance are , you can see my daily analysis articles.
In addition, when making a plan, you must set the stop profit and stop loss points. The stop profit must be greater than the stop loss. The reason for this is that even if your accuracy rate does not reach 50%, you can still make profits in the long run.
Second:Implement
After making a trading plan, what you have to do is to strictly implement it. You need to have confidence in your plan and don’t doubt your judgment because of the turmoil in the market. You need to know that the truth is often in the hands of a few people.
Third:review
Regardless of whether you are making a profit or a loss in today's transaction, you need to review the market. When you make a profit, you need to consider whether the take-profit position set this time is reasonable, and whether the profit can be enlarged next time. Of course, you also need to learn how to stop in moderation.
Of course, we can’t avoid the situation where we misjudged the direction. At this time, we need to consider whether we have strictly implemented the stop loss operation. In many cases, small losses are out, and keeping the principal is also a very correct operation. More people They will stop profit, but they can’t accept the loss, which leads to a mistake and loses the whole game. Therefore, it is said that those who can buy are apprentices, and those who can sell are masters.
Fourth:Summarize
Making a trading plan is a good habit, and it will accompany you throughout your life. Don’t think it’s a good habit just because you’ve made money for several days in a row, and you’ll feel that making a plan is useless because you’ve lost money for a few days in a row. The meaning, a simple summary is to make a good plan, strictly implement it, review it many times, and believe in yourself.
I will formulate my trading plan every day, and then share it with you, hoping to make progress together with you. At any time, we are in awe of the market and let ourselves go further through planning. This market will always eliminate some people. Don’t believe it Luck, that kind of thing will run out sooner or later, friends are welcome to discuss with me.
❤️Please, support my work with like, thank you!❤️

EURUSDHello Traders, here is the full analysis on EURUSD , let me know in the comment section below if you have any questions, the entry will be taken only if all rules of the strategies will be satisfied. Kindly tap on like and follow button l.. Please also refer to the Important Risk Management

Sylo Altcoin Price ForecastThe current market conditions for Sylo suggest a positive trend over the next few weeks. With the current price of Sylo, many analysts are optimistic about the potential of this altcoin, driven by its focus on privacy and security in the decentralized space.
In the short term, expect the price of Sylo to reach .003 expected price within the next few weeks, driven by new partnerships and development progress in their technology. In addition, increased demand from investors looking for privacy-focused investments may also drive the price higher.
"In the short term, expect the price of Sylo to experience a bearish trend, potentially reaching low as .0017.
Looking further ahead, expect the price of Sylo to continue its upward trajectory and reach .01 cents. This is based on the growing demand for privacy-focused solutions in the market and the increasing awareness of Sylo's capabilities in this area.
It is important to note that the cryptocurrency market is highly volatile, and any number of factors could impact the price of Sylo, including regulatory developments, changes in investor sentiment, and market competition. As such, this forecast should be viewed as a rough estimate and is not a guarantee of future performance.
In conclusion, the short-term outlook for Sylo is positive, with a strong likelihood of continued price increases over the next few weeks. However, as with any investment, it is important to consider your own risk tolerance and conduct your own research before making any investment decisions.
#CryptoWhale100Billion
"I hope this analysis has helped provide some insight into the potential of Sylo. If you found this information valuable, please don't hesitate to give us a thumbs up and follow us for more free crypto analysis and insights. My goal is to help educate and inform the community and I couldn't do it without your support. Thanks for reading, and we'll see you at the next one!"

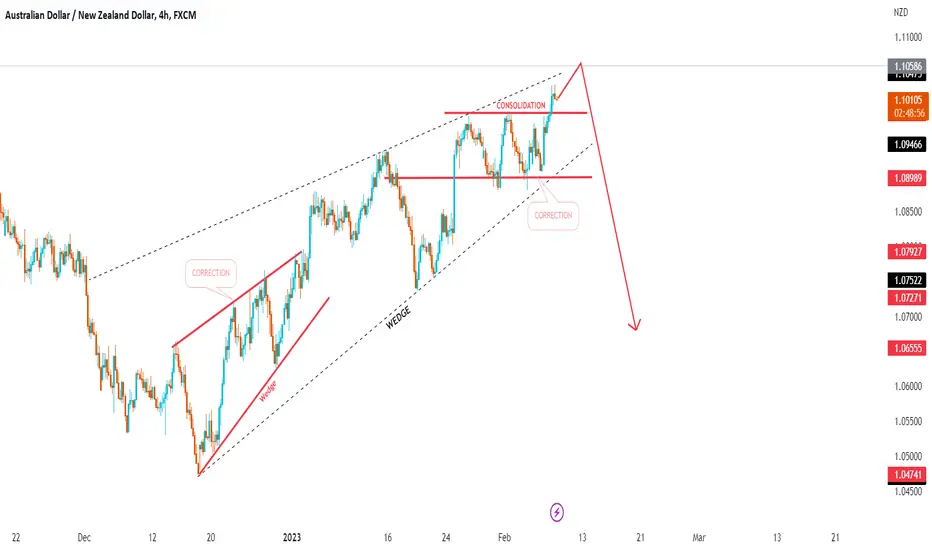
AUDNZD Next Move ? Breakout or RejectPair : AUDNZD ( Australian Dollar / New Zealand Dollar )
Description :
Rising Wedge as a Corrective Pattern in Long Term and Short Term
We have Consolidation Phase and Breakout the Upper Trend Line and Completing the Retracement
S / R Level
Divergence
Fibonacci
OXY - Great setup
NYSE:OXY - Elliott wave Analysis
Warren Buffet bought OXY in Q1,Q2 and Q3 of 2022. We can't all be Buffets but a a good setup might be in place right now.
A clear upward impulse wave starting in October 2020, with an extended third wave that reached its peak on May 31, 2022.
Since then, we have been witnessing a period of consolidation in the form of a retracement wave (4). The sideways movement of the price is characteristic of a triangle pattern.
Triangles are a slow and sideways movement that indicate a balance in the convictions between bulls and bears. They are only present in waves 4, B, and X, preceding the final wave of a sequence.
The eventual outcome of a triangle pattern is a wave 5 of the impulse sequence, also know as the post triangle thrust. The good part is that we can calculate this post triangle thrust.
In terms of Fibonacci retracements, the current retracement of 0.236 in wave 3 aligns with the second most common Fib retracement for wave 4.
It is important to note that triangle patterns can be difficult to trade. Why because in this case the triangle can take the form of a B wave at a larger degree than fall in wave C finishing the correction. than moving up in wave 5 of the larger impulse wave. This may not be relevant in the current situation, however, it is important to exercise caution and keep this in mind."
When they conclude though, they result is the post triangle thrust.
ConclusionGood upside potential at least to $74 level 13% increase from the current level. There is also another energy stock with the same wave count NYSE:PXD this time with a dividend yield of 11 %.
Legal Disclaimer: The information presented in this analysis is solely for informational purposes and does not serve as financial advice.

XRP LONG TRADE SETUP IDEA XRP long setup with an entry in the orange circle. Price is bouncing off trendline, S/R level, and added fixed range profile for confirmation.
POSSIBLE TARGETS AT FIB LEVEL/POC.
