Improving My Win Loss Ratio In Forex TradingWell, Some good news, actually great news. The experiment worked and in this video I show how I am improving my win loss ratio in Forex trading.
From a disastrous Win Loss ratio using only SMC now with combining the classical school along with the Stochastic I have been nailing it for the past 20 days with 22 trades and 8.6% increase on my balance.
In many cases, especially with advantageous RRR, it is Ok to have the win loss ratio in favor of the Loss, as the RRR will compensate and the balance would increase, but in this case I have the win rate higher and the RRR if it was calculated is also higher.
I depend on opening multiple trades and closing them all at once once they hit an acceptable percentage. In the video I said I will close them around 2%, but to tell you the truth, even if it was 1% I would close because no business I know of would bring 1% profit in a day.
The concern now with this Forex Trading Plan is that it does not use Stop Loss nor Take Profit. I feel that I am hanging in the air, which is not a good feeling and this might get me inside an emotional imbalance in the long run.
Still, the test is going on to evaluate all that.
Trading Plan

Zulu PrincipleJim Slater beat the market for decades by systematizing quality + reasonable price + momentum—first via a 1960s “earning situations” turnaround playbook, then (1992+) via the Zulu Principle: small/mid caps with fast EPS growth, efficient capital use, cheap vs growth (low PEG), and RS strength, managed by strict quarterly rebalances.
The two playbooks
1) “Capitalist” (1960s turnaround)
Yield ≥ 4%, EPS up in ≥4 of 5 years, EPS ≥ 2× in 4 years
Optimistic chairman’s statement, sound liquidity, no exceptional vulnerabilities
Reasonable asset value, not family-controlled, voting shares
Spirit: early GARP before it had a name—cash-generative, improving earners with robust balance sheets.
2) Zulu Principle (1990s, refined & timeless)
PEG < 0.75 (value vs growth in one metric)
P/E < 20
EPS growth > 15%
12-mo Relative Strength > 0% (price momentum)
ROCE > 12% (quality/efficiency)
Market cap £20M–£1B (small–mid where “elephants don’t gallop”)
Quarterly full rebalance: buy all qualifiers; sell anything that drops off; no in-between adds.
Why it still works
Aligns with the three empirically robust factors: Quality, Value (vs growth), Momentum.
Captures post-earnings-announcement drift by favoring positive EPS surprises and upgrades.
Rules ≫ opinions: removes emotion, enforces discipline via scheduled rebalances.
When few names qualify (tight markets)
Relax one notch (e.g., PEG < 1.0, P/E < 25, ROCE > 10%).
Widen geography (apply the same screen across EU/US/ROW).
Layer news filters (earnings beats, trading updates) on top of the screen.
Ready-to-run screen: www.tradingview.com
Universe: your domestic market + optional global small/mid
PEG (1y forward EPS growth) < 0.75
P/E (TTM or forward) < 20
EPS growth (TTM or forward) > 15%
Relative Strength (12m vs market) > 0%
ROCE > 12%
Market Cap , 1.1x USD
Liquidity guardrails: £5k ~ £20k Daily Volume
Sanity Check: Golden Cross, Price above 50/200 DMA
Portfolio construction & rules
Quarterly rebalance (strict): equal-weight all qualifiers; sell anything that no longer qualifies.
Max names: 20–40 (equal weight); if >40, rank by lowest PEG → highest RS → highest ROCE.
Risk: position size so any single name ≤ 5% weight; optional 15–25% stop from entry if you want overlays.
Costs/slippage: use liquid names (ADV filter) and quarterly cadence to keep friction low.
Upgrades you can test
Replace RS>0% with 6-Month RS > 5% or 12-Month RS > 10%.
Add Net debt/EBITDA < 10× (quality balance sheet).
Require positive estimate revisions in the last 3 months.
Momentum overlay: require price above 50/200-DMA to avoid value traps.

Value to Price Contraction PatternVPC Overview
What to Watch During Corrections
Stay engaged. Corrections are when future leaders reveal themselves.
Breadth divergence = danger. If indexes rise while the percentage of stocks above the 200-DMA is less than 50% (especially in the 30s), expect a pullback; rallies are narrow and fragile.
Look beyond cap-weighted indexes. Check equal-weight S&P, S&P 400 (midcaps), and Russell 2000; if they lag, leadership is thin.
Distribution vs. accumulation. Clusters of distribution days with few/brief accumulation days = risk-off regime.
How Leaders Reveal Themselves (3 Phases)
Predictive (during the correction):
Stocks hold up the best, often within ~25% of 52-week highs while the market is weak.
The RS line makes new highs even if the price is flat/down. Keep them on the A-list.
Right off the lows (post-FTD):
Explosive moves straight from lows, first into new high ground.
These often become the cycle’s monsters; wait for the first tight add-on/base if the initial thrust is extended.
Confirming (after the turn):
Breadth broadens; more proper bases are complete; opportunities are more obvious but still fruitful.
Entry Playbook
Require a Confirmed Uptrend: A follow-through day (FTD) + real setups. FTD alone is not a buy signal.
Focus on VCP bases (Volatility Contraction Pattern): successively tighter swings, drier volume, and right-side strength; buy as it clears the pivot with power.
RS Line New Highs into/at Breakout = Green Light.
Recent IPOs: prime “magnitude plays”; catch early primary bases coming out of corrections.
Progressive Exposure (when trades work)
Start with ~25% exposure (e.g., 4–5 x 5% “pilot” positions or one 20–25%).
If pilots gain traction, move quickly to ~50%, concentrating on the best names (add to winners).
If strength persists, scale to 75–100%.
Do not scale up if pilots aren’t working; reduce instead.
Selling & Timeframe
Define intent up front: trade (harvest faster, lower drawdown) vs campaign (accept drawdowns for bigger targets).
Sell into strength when the extension vs. key MAs is wide and the downside is greater than the upside.
For developing skill: take partials at 2–3× your initial risk (R) to “free-roll” the position; trail the rest.
Never raise cash just because the index is red; raise cash when your stocks show deterioration or hit stops.
Risk & Stops
Enter with a tight risk (Minervini style: often 3–5% below a well-defined pivot/low).
Position size so a stop hit costs ~1–2% of equity per idea.
Don’t average down. Cut quickly; the strategy is better than you—your job is to execute it.
Five Fast Filters for New Leaders
Shallow corrections from highs (ideally ≤25%) and quick recoveries.
Bases forming within long-term uptrends; VCP tightenings.
Fastest back to new highs after the market low; frequent up-days > down-days (“ants”: ≥12 up in 15).
The RS line is making new highs before/at breakout.
Recent IPOs with real growth.
Mindset
Commit to one sound strategy and master it; discipline is greater than prediction.
Trust the stocks, not the headlines. When the market confirms and the leaders set up, act.
Scanner:
www.tradingview.com
CANSLIM Overview📘 CANSLIM Overview — The 7 Traits of Big Stock Winners
CANSLIM is an acronym developed by William J. O’Neil, founder of Investor’s Business Daily (IBD) and author of How to Make Money in Stocks.
It describes the seven common characteristics shared by the biggest winning stocks before their major price moves.
The system blends fundamental growth, institutional behavior, and market timing—and is grounded in historical quantitative studies dating back to the 1800s.
🧩 The Acronym:
Letter Stands For Core Concept
C Current Quarterly Earnings Explosive short-term earnings growth
A Annual Earnings Growth Multi-year compounding of profits
N New Product, Service, or Management Innovation driving market leadership
S Supply and Demand Stock’s float size and institutional accumulation
L Leader vs. Laggard Relative strength and group leadership
I Institutional Sponsorship Quality fund ownership and buying pressure
M Market Direction Aligning with the general market trend
1️⃣ C — Current Quarterly Earnings: Big Growth, Not Modest Growth
“The biggest winners showed three consecutive quarters of 25%+ growth, but the best averaged 70%+ before their runs.”
Measure this quarter vs. the same quarter last year, not sequentially. This avoids seasonal distortions.
Ideal Growth Rate:
Minimum: +25% YoY EPS growth for 3+ quarters
Stronger filter: +70–100% or even triple-digit earnings growth
Combine with revenue growth of 30–50% or more.
Stocks with massive EPS and sales growth attract institutional attention early.
Modern Adjustment:
Today’s growth leaders (e.g., NVDA, TSLA, PANW) still show these patterns, though some use non-GAAP EPS or adjusted metrics. The concept—explosive profitability inflection—remains identical.
2️⃣ A — Annual Earnings Growth: Sustained Profitability
“Look for at least three years of annual earnings increases.”
Consistency is key. Accelerating growth adds conviction.
Avoid one-time spikes or negative earnings trends.
Favor firms with 3+ years of 20%+ annual EPS growth and positive forward analyst estimates for continuation.
Analyst Upward Revisions are particularly powerful—funds often buy on these changes.
Interpretation:
Multi-year profit acceleration shows management execution, competitive edge, and strong demand.
Example: O’Neil’s model studies (1952–2001) showed 73% of winners had +70% EPS growth the quarter before their breakout and 3+ years of rising annual profits.
3️⃣ N — New Product, Service, Management, or Market Catalyst
“You want the next Apple, not the next RCA.”
Innovation is the engine of multiple expansion. The “new” can take many forms:
Breakthrough product or service
Transformative business model
New leadership or management
Market share disruption
Examples (then and now):
Apple (iPhone), Tesla (EVs), Nvidia (AI GPUs), Uber (gig economy)
Earlier eras: IBM, Home Depot, Microsoft
Psychological angle: Human nature craves novelty. The market rewards perceived future dominance, not current stability.
4️⃣ S — Supply and Demand: The Float Matters (Less Now)
Originally, O’Neil favored smaller floats (≤50–70M shares) since limited supply + strong demand = sharp price moves.
“It’s less critical today—large caps can still double or triple. Focus on quality, earnings, and leadership over share count.”
The principle still holds but is muted due to:
ETFs, passive flows, and massive institutional liquidity
Widespread retail access and option leverage
The core idea remains: price rises when demand exceeds supply, visible via volume surges.
Modern adaptation:
Monitor volume spikes, accumulation/distribution, and relative volume ratios over absolute float size.
5️⃣ L — Leader vs. Laggard: The Power of Relative Strength (RS)
“Buy the strongest stocks in the strongest groups during a confirmed uptrend.”
O’Neil found each bull cycle is led by 2–3 dominant industry groups (e.g., semiconductors, software, solar).
Within those, only the top few names outperform meaningfully.
Key Filters:
Relative Strength (RS) Rating: 85–99 (top 15% of market)
Leading groups by RS, EPS growth, and fund buying
Avoid laggards even within strong sectors.
Modern context:
Institutional algorithms still chase relative momentum. RS-based filters would be Ideal.
“When you have the strongest stocks, in the strongest sectors, in an uptrend—and you use disciplined stop-losses—it’s very hard not to make money.”
6️⃣ I — Institutional Sponsorship: The Smart Money Footprint
“70% of market volume comes from institutions—follow their footprints.”
Institutions (mutual funds, hedge funds, pension plans) create sustained demand that drives major trends.
Key things to watch:
Rising number of institutional holders quarter-over-quarter
Presence of high-quality funds (e.g., Fidelity Contra, Vanguard Growth)
Volume patterns on charts confirming accumulation
Quantitative Significance:
Example: Zoom (ZM)—278 funds → 1,413 funds within 7 quarters (5× increase)
Enphase (ENPH)—160 → 1,008 funds in 8 quarters
Such surges often precede parabolic price advances.
7️⃣ M — Market Direction: The Most Critical Factor
“If you don’t get the M right, nothing else matters.”
O’Neil’s data showed:
3 out of 4 stocks follow the general market trend.
Even perfect fundamentals fail in bear markets.
Core Rule: Only buy aggressively during a confirmed market uptrend.
The signal is the Follow-Through Day (FTD)—a +1.5% or greater gain on strong volume, typically 4–10 days after a market low.
When the Market Is Choppy or Bearish:
Reduce exposure or move to cash (cash is a position).
Focus on capital preservation over prediction.
⚠️ Risk Management — The “Eighth Principle”
“You can be right 1 out of 3 times and still make a fortune—if you cut losses fast.”
O’Neil borrowed from Jesse Livermore and Bernard Baruch’s philosophy:
Max loss per trade: 7–8% (ideally 5%)
Never average down; if it fails the breakout, sell immediately.
Emotional capital matters as much as financial capital.
Risk Math:
Loss Required Gain to Break Even
7% +7.5%
20% +25%
50% +100%
→ The deeper the drawdown, the harder recovery becomes — and the worse your discipline gets.
Cutting losses early keeps both capital and confidence intact.
Advanced Discipline:
Always use stop-losses near pivot points
Size positions so that total portfolio risk ≤1–2% per trade, and the Reward is 3x your risk.
Expect that most trades won’t work; winners will more than offset losers
🔢 Practical CANSLIM Checklist
Step Criterion Target Metric
C Current quarterly EPS growth ≥25%, ideally 70%+
A Annual EPS growth 3 consecutive years ≥20%
N Innovation or catalyst New product/service/management
S Supply-demand imbalance Volume > average, low float optional
L Leadership RS ≥85; top 3 names in top sector
I Institutional ownership Increasing QoQ, ≥2 top-tier funds
M Market trend Confirmed uptrend via FTD
Risk Stop loss 5–8% below entry, always enforced
🧠 Psychological Cornerstones
Human nature never changes. Fear and greed drive every cycle—from 1800s railroads to 2020s AI stocks.
Discipline beats prediction. Entry precision is less important than loss limitation.
Conviction comes from quality. Big winners are clear leaders with strong fundamentals.
Cash is a position. Avoid trading in “cold decks” (sideways or down markets).
Emotion control = longevity. Protect your confidence as much as your capital.
🧩 Modern CANSLIM Adaptations
While CANSLIM’s DNA remains timeless, modern quantitative investors integrate:
Relative Volume & RS Ranking (machine-scored)
EPS revision momentum (analyst upgrades)
Institutional rotation data (13F filings, ETF flows)
Macro context: liquidity cycles, Fed policy, credit spreads
Technical refinements: base patterns, volume dry-ups, and volatility contraction setups (VCP).
💬 Summary Insight
“Nothing has changed since the 1800s—only the tools.
Human nature and crowd behavior are constants.”
CANSLIM is a structured behavioral framework for spotting institutional accumulation of fundamentally superior companies at the right time in the market cycle.
Its greatest edge lies not in stock-picking, but in discipline—knowing what not to touch, when to cut, and when to press.
Here is the Screener I use.
www.tradingview.com
Screener SystemThe Gabriel Quantitative Screener Series transforms the way traders approach technical and fundamental confluence.
Each filter was designed not just to identify market opportunities but to model institutional behavior, where volume, efficiency, and volatility compression merge into repeatable, high-conviction setups.
By mastering these tools, traders can adapt dynamically across multiple environments:
From high-growth rotations and momentum squeezes to value recoveries and fundamental leadership trends.
From swing trades that capture early rotations to short-term intra-day bursts driven by liquidity spikes.
Each screener operates independently, but together they provide a panoramic framework of market rhythm and capital flow dynamics—helping you trade in harmony with institutional footprints rather than noise.
⚙️ 1. Gabriel’s TTM Squeeze—Volatility Compression and Momentum Ignition
Credit to John Carter from Simpler Trading.
Concept:
The TTM Squeeze identifies moments when volatility contracts to its tightest levels, signaling a buildup of market energy before a potential breakout. Gabriel’s version refines this principle by combining EMA structure alignment, Stochastic crossovers, liquidity thresholds, and volatility gating to isolate high-probability expansion phases.
Core Technical Framework:
EMA (8), EMA (21), EMA (34), EMA (55), and EMA (89) create a layered exponential trend structure that reveals directional stacking.
Bullish alignment: EMAs stacked upward (momentum acceleration).
Bearish alignment: EMAs inverted (momentum exhaustion).
Bollinger Bands (20) within Keltner Channels (20)—defines volatility compression and the "squeeze" zone.
Stochastic (5,3,3), (8,3.3), (14,3,3)—ensures that it's ready and primed.
ADR > 2% & ATR (14) ≥ 0.5—ensures range expansion potential.
Volume ≥ 500K—confirms institutional-grade activity.
Market Cap ≥ $2B—eliminates illiquid small caps.
How It Works:
Detects volatility contraction as BBs narrow inside KCs.
Confirms directional alignment using multi-EMA structure and R.A.F. proxy.
Screens for expansion-ready setups where energy release often follows compression.
Ideal Use Case:
Perfect for swing and intraday traders who capitalize on volatility transitions. Best applied before earnings or major news catalysts when institutional positioning drives breakout volatility.
🚦2. Gabriel’s TRW Squeeze—Trend Rotation Wave Screener
Credit to Aayush Sharma from Stock Campus.
Description:
The Gabriel’s TRW Squeeze screener identifies trend rotation wave setups using volatility compression signals combined with multi-SMA alignment. It is designed to detect the moment when price, volatility, and structure synchronize—signaling a potential momentum release after a quiet consolidation phase.
While Gabriel’s TTM Squeeze focuses on exponential momentum acceleration, the TRW Squeeze emphasizes smoothed trend strength, ideal for swing traders and portfolio rotations.
Core Framework
🔹 Moving Average Structure
SMA(9), SMA(21), SMA(50), SMA(200) define the multi-horizon trend.
Alignment of these SMAs reveals institutional rotation and trend maturity.
Bullish Bias: price above SMA(9) > SMA(21) > SMA(50) > SMA(200).
Bearish Bias: reverse order or price below all SMAs.
🔹 Volatility Compression
Bollinger Bands (20) contracting inside Keltner Channels (20) marks the volatility “squeeze.”
This condition reflects a market equilibrium about to shift—the “coiling spring” pattern.
Once Bollinger Bands expand beyond the Keltner Channel, momentum is likely to surge.
🔹 Liquidity & Volatility Filters
Market Cap ≥ 2 B USD—avoids microcaps and ensures institutional-grade volume.
Volume ≥ 500 K—screens only actively traded stocks.
ATR(14) ≥ 0.5—ensures sufficient daily range for tradeable volatility.
ADR ≤ 2%—filters excessive overnight risk.
How It Works
Compression Detection—The screener finds assets where Bollinger Bands are inside the Keltner Channel, signaling low volatility.
Trend Alignment—SMA structure confirms the directional bias of the underlying trend.
Expansion Trigger—A breakout from the squeeze with aligned SMAs marks a high-probability trend continuation or reversal wave (TRW).
⚡ 3. Gabriel’s Low Float Mover—High-Volatility Momentum Screener
Credit to Ross Cameron from Warrior Trading.
Description:
Gabriel’s Low Float Mover is engineered to detect high-momentum, low-float stocks exhibiting abnormal volume surges, strong pre-market strength, and breakout behavior. It filters for equities within the $2.5–$25 range, making it ideal for traders targeting parabolic intraday and swing moves driven by speculative rotation, news catalysts, or short squeezes.
Core Filters
⚙️ Liquidity & Market Cap
Price: $2.50–$25 Focuses on the sweet spot for retail and small-float momentum plays.
Market Cap: $300M–$2B Captures low- to mid-float tickers with enough liquidity to run but small enough to move violently on volume.
🔥 Momentum & Volume Criteria
Relative Volume ≥ 5× Ensures today’s activity is at least 5× higher than normal—confirming crowd participation or news-based rotation.
New High (1 Month) Filters for fresh breakouts or stocks reclaiming momentum from consolidation.
Pre-Market Change ≥ 2%— Detects early strength before the open, a key tell for potential runners.
⚖️ Risk Control
ADR ≥ 2% Limits overnight tracking error and ADR volatility, focusing on domestic tickers with cleaner price action.
How It Works
Identifies low-float, mid-cap stocks within the preferred retail volatility range.
Confirms momentum ignition using relative volume, recent highs, and pre-market confirmation.
Highlights tickers most likely to experience intraday breakouts, halts, or squeezes.
Use Case
Built for day traders, momentum scalpers, and swing traders who thrive in fast-moving markets. The screener surfaces potential runners before market open, allowing early preparation and pre-market watchlist building.
⚖️ 4. Gabriel’s VPC—Value-to-Price Compression Screener
Credit to Mark Minervini.
Concept:
The Value-to-Price Compression (VPC) model identifies stocks transitioning from deep value recovery to early momentum, trading between their 52-week extremes.
It captures the “middle zone” where institutional accumulation typically begins—not too oversold, not too overbought.
Core Framework:
Price ≥ 30% above 52W Low—signals strength recovery from a value base; the more the better, preferably higher than 100%.
Price ≤ 30% below 52W High—leaves headroom for continued upside; the closer to the 52-week high, the better.
SMA (50), SMA (150), and SMA (200) measure long-term compression and potential golden-cross structure.
Market Cap ≥ $300M, Volume ≥ 2M, ATR ≥ 0.5, ADR ≤ 2%—ensure clean, tradeable liquidity profiles.
How It Works:
Detects stocks recovering from lows but not yet overextended.
Confirms trend compression via SMA alignment.
Highlights candidates basing or consolidating before major continuation.
Ideal Use Case:
Best for swing and position traders aiming for sustained mid-cycle entries—the sweet spot between growth investing and technical momentum.
💹 5. Gabriel’s CANSLIM—Fundamental Growth & Institutional Leadership Screener
Credit to William O'Neil.
Description:
Gabriel’s CANSLIM identifies elite growth stocks that exhibit accelerating earnings, strong sales expansion, operational efficiency, and improving institutional interest—while still trading within 30% of their 52-week highs.
This screener merges O’Neil’s original CANSLIM principles with modern quantitative filters, designed to surface leaders emerging from consolidations with robust fundamentals and liquidity.
Core Framework
📈 C – Current Quarterly & Annual Earnings
EPS Growth (Quarterly YoY ≥ 25%)—highlights recent earnings acceleration.
EPS Growth (TTM YoY ≥ 15%)—confirms consistency across annual cycles.
Operating Margin (TTM ≥ 4.25%)—ensures profitable, scalable business models.
💰 A – Annual Earnings Growth
Revenue Growth (TTM YoY ≥ 25%)—sustained top-line expansion validates structural growth.
Net Margin (TTM ≥ 3%)—filters out low-quality revenue growth with poor conversion efficiency.
🧭 N – New Highs, Products, or Market Leadership
Price ≤ 30% below 52-week high—positions within breakout range of institutional accumulation.
ROCE (TTM ≥ 12%)—indicates strong capital efficiency and competitive advantage.
🏦 S / L / I / M – Supply, Leadership, Institutional Demand, Market Direction
Market Cap ≥ $300 M USD—ensures institutional-grade tradability.
Volume ≥ 5 M—screens for active institutional participation, the RS indicator.
Net Debt / EBITDA ≤ 17—avoids over-leveraged names that can’t scale efficiently.
ATR (14) ≥ 0.5 & ADR ≤ 2%—ensures both volatility for momentum and manageable risk.
How It Works
Filters fundamentally strong companies growing earnings and sales ≥ 20 % with efficient capital allocation.
Targets those near technical breakout zones—above institutional support but below euphoria.
Surfaces leaders capable of multi-quarter momentum continuation during strong market cycles.
💬 6. Gabriel’s Zulu Principle — Undervalued Growth with Technical Precision
Description:
Gabriel’s Zulu Principle is inspired by Jim Slater’s legendary small-cap investment philosophy — focusing on “niche growth at a reasonable price.” This screener merges the value discipline of fundamental analysis with technical alignment, surfacing emerging growth companies before institutional recognition.
It’s designed to identify small- and mid-cap stocks that are growing earnings rapidly yet remain undervalued by traditional metrics, sitting quietly in volatility contraction zones — the perfect setup for asymmetric upside.
🔥7. Stocks In Play, ORB — Opening Range Breakout Momentum Screener
Description:
“Stocks In Play, ORB” is a high-momentum liquidity screener built to identify intraday breakout candidates showing explosive activity around the Opening Range Breakout (ORB) window.
It focuses on high relative volume, strong ATR expansion, and clean volatility structure to surface equities with enough participation and range for active day trading.
This is your go-to pre-market and intraday watchlist generator for finding the tickers that matter today.
The Formula to Make $10000 Daily👋 Hello traders!
If you’re looking for a real way to make $10000 every day from the markets, forget about the so-called magic strategies or secret expert tricks.
The truth is simple: there’s no overnight success formula. But there is a realistic path built on probability, discipline, and time — and that’s what I call The Formula to Make $10000 Daily .
⚙️ Step 1: Build a High-Probability Trading System
📊 This is your foundation.
A good trading system doesn’t have to be complex, but it must have clear rules and consistent logic .
You should always know:
✅ When to enter a trade
✅ When to stay out
✅ And most importantly — why you’re entering
Choose a strategy you can truly master and apply consistently — such as Break & Retest , Supply & Demand , or Market Structure Shift .
Every trade should have a Risk-to-Reward ratio (R:R) of at least 1:2 or higher.
💡 Example:
If you risk $2000 per trade and win just two out of three trades daily, you’ll make $4000.
Increase your lot size gradually and stay consistent — $10000 a day becomes a realistic outcome.
💼 Step 2: Capital Management – The Key to Survival
🧠 You can’t make $10000 daily if you lose $10000 in one bad trade.
Capital management isn’t just about protecting your balance — it’s about protecting your mindset and system.
Follow these golden rules:
💰 Risk only 1–2% per trade
🛑 Always use a stop loss
🎯 Set a clear take-profit target
With a $50,000 account, risking 1% equals $5000.
If your R:R ratio is 1:3, one winning trade a day earns $15000.
That’s not luck — that’s mathematics working in your favor .
🧘♂️ Step 3: Master the Trader’s Mindset
Once you have a solid system and money management plan, the final piece — and the most important — is your psychology .
Most traders don’t fail because their system is bad. They fail because they can’t control themselves .
Keep these principles close:
🚫 Don’t trade when emotions take control
🚫 Don’t revenge trade after losses
🚫 Don’t increase lot size out of greed
🚫 Don’t force yourself to take trades every day
A professional trader doesn’t aim to win every trade — they aim to lose less and lose smart .
🧩 The Real Formula
💎 (High-Probability System + Strict Risk Management + Strong Psychology) × Time = Sustainable Profit
There are no shortcuts.
No magic indicators.
Only you and your discipline .
📖 Real Story
One of my students, Ken, started with a $10,000 account.
He didn’t try to go big — instead, he aimed to earn 1% a day , or $1000.
After six months, by slowly increasing his trade size and staying disciplined, his average daily profit reached $10000 .
He told me:
“I didn’t need to change my system. I just needed to change myself.”
🎯 Final Thoughts
The formula to make $10000 daily doesn’t come from any special indicator, signal, or secret course.
It comes from understanding your system deeply, managing your capital wisely, and staying disciplined every single day .
💬 The market doesn’t reward the fastest traders. It rewards the most patient, consistent, and focused ones.
If you’re on your journey to becoming a professional trader, start today.
🔥 Build your own formula — and practice it every single day until it becomes second nature.

Quantitative TradingThere are two main approaches to seeking consistent profits through the study of price history: the discretionary approach, based on experience and logical reasoning, and the quantitative approach, focused on identifying and exploiting behavioral patterns under specific market conditions.
Contrary to what’s usually thought, neither approach is exclusively intuitive or mechanical. Discretionary traders don’t operate solely on intuition, and quantitative ones don’t lack reasoning when building their systems. Both share fundamental elements: they rely on analyzing price history, spotting repetitive patterns, and applying statistical knowledge and risk management.
The main difference lies in flexibility. Discretionary traders enjoy greater freedom to make decisions, which can be harmful for inexperienced investors but a huge advantage for seasoned ones. Quantitative traders, on the other hand, follow strict rules, which reduces emotional influence and often allows automating processes to generate profits consistently.
This article is dedicated to exploring some vital concepts and ideas for developing solid and effective quantitative trading.
Key concepts about systems
• Quantitative systems require strict entry and exit rules
A quantitative system must be based on clear and objective rules for trade entries and exits. Though it seems obvious, many educational resources highlight metrics like win rates without considering the subjectivity in the systems they present, making reliable calculations impossible. Before evaluating a system’s stats, the investor must ensure all parameters are quantifiable and precisely defined.
• Trading systems are not universal
Each market has its own nature, which can be studied based on its historical record. For example:
• Trending markets , like SPY or Tesla, are driven by factors such as economic growth or market sentiment, making them ideal for systems that aim to capture directional moves.
• Range-bound markets , like Forex, are influenced by central banks promoting stability, limiting extreme moves and favoring ranges under normal conditions.
Applying a trending system to a pair like EUR/USD, which tends to consolidate, can lead to disappointing results. Similarly, using a mean-reversion system in a strongly directional market like the SPY ETF is illogical and usually ineffective. Plus, traditional markets have a structural bias favoring bulls over bears, which can significantly impact the performance of certain strategies.
On the other hand, timeframe is a critical factor when developing and evaluating quantitative systems. In lower timeframes, volatility from news, emotions, or high-frequency trading makes it hard to apply trending systems. Instead, higher timeframes (H4, D, W) offer more stability, improving the performance of many systems by reducing market noise.
• An effective quantitative trading system must be backed by a broad and detailed historical record
The larger the volume of data analyzed, the greater the confidence in the system’s ability to produce predictable results in the future.
A key aspect in developing quantitative trading systems is ensuring consistency in results. Consistency in a system’s performance across different timeframes (D, H4, H1) is an indicator of its robustness and adaptability. For example, a system that generates solid and stable returns across multiple timeframes shows greater reliability than one that only works well in a specific timeframe.
• We should avoid trading systems with unstable equity curves or large drawdowns
A quantitative trading system must be designed to generate consistent profits with controlled risk. That’s why it’s essential to avoid systems with unstable equity curves (erratic fluctuations in gains) or large drawdowns (maximum accumulated losses). These issues indicate a lack of robustness and can jeopardize the system’s long-term viability.
• A high win rate doesn’t guarantee consistent profitability
A common mistake among investors is assuming a high win rate ensures high and sustainable profitability. However, a quantitative trading system’s profitability depends on multiple factors beyond the win rate, such as the risk-reward ratio, market exposure, and operational costs.
For example, trending systems can generate larger profits but often have lower win rates due to greater market exposure, while systems with high win rates may offer limited returns because of shorter exposure and accumulated costs from high trade volume.
• Commissions and the number of trades must be factored into system testing
Failing to include these costs in the analysis can create a misleading perception of the system’s profitability, artificially inflating results.
Even a system with a stable and consistent equity curve doesn’t guarantee success if commissions aren’t considered, especially in strategies with low win rates or high trade volume.
• The risk-reward ratio must be adapted to the system
There’s no universal formula that guarantees profitability in all scenarios based solely on this parameter. However, using an inappropriate risk-reward ratio for the chosen system can lead to costly mistakes.
For example, applying a tight (low) risk-reward ratio in trending systems, or a high risk-reward ratio in mean-reversion systems or those exploiting small patterns, is an inconsistency that often results in significant losses for traders.
• About backtesting in TradingView
When a system is quantified on the TradingView platform, by default, profits and losses are calculated relative to the percentage of volatility. This means our margin per trade will generate losses or gains based on price movement.
For example, if our entry occurs on a bullish engulfing candle that closes above the EMA 20, and our SL is placed at the candle’s low, the losses from the entry point to the SL will be highly variable and depend on the volatility percentage, not on solid position management (like setting a 20% SL per entry, which would mean adjusting leverage). We could get three trades right in a row, and it’d only take the entry candle of the fourth trade to be huge for the losses to be disproportionate if the SL triggers.
This is especially important to keep in mind when backtesting systems on low timeframes, where volatility is extremely low. Without accounting for leverage and fixed loss percentages per trade, we might discard highly profitable systems, since the platform—calculating gains and losses based on volatility percentage—will always show poor profitability.
An inexperienced investor might face a system with a 60% win rate and a 1:1 risk-reward ratio, but if the backtesting is done on a 5-minute chart (where volatility is low), they’ll likely discard it due to the apparent poor profitability.
Conclusions
Developing effective quantitative systems requires an approach that integrates clear rules, rigorous testing, and a deep understanding of market dynamics. In upcoming articles, I’ll dive deeper into the topic, plus share my views and experience on other investment approaches.

Old Wounds, New Trades - Echoes of the Past... “I don’t know what’s wrong with me. Every time I take a loss, even a small one, I freeze. It’s like a switch flips and I feel off, I just can’t explain why”
If you’ve ever felt that sudden wave of tension, self-doubt, or urgency that doesn’t quite fit the size of the trade… You’re not alone.
Follow along. I hope this helps.
BUT FIRST
NOTE – This is a post on mindset and emotion.
It’s not a trade idea or system designed to make you money.
My intention is to help you preserve your capital, focus, and composure so you can trade your own system with calm and confidence.
HERE’S WHAT HAPPENS
You’re trading normally.
Nothing dramatic.
Then price moves against you.
The heart rate spikes, breathing shortens, the body tenses.
You hesitate or you overreact.
Logically, it makes no sense.
It’s just one trade.
But the emotion feels bigger than the moment.
That’s because it’s not just the market you’re responding to.
It’s memory.
WHAT’S REALLY GOING ON UNDERNEATH
Your nervous system stores emotional imprints, moments of uncertainty, criticism, fear, failure.
They don’t disappear; they get filed under “avoid this feeling.”
When something in the present, like a losing trade hits a similar emotional frequency, the old file reopens.
And you find yourself reacting. Not just to the market in the here and now but to an echo from the past.
That echo might sound like:
🔹 “I can’t mess this up again.”
🔹 “I should’ve known better.”
🔹 “What if this proves I’m not cut out for it?”
It’s not the trade that’s hurting.
It’s the part of you that once felt unsafe, unseen, or not enough.
HOW TO CATCH IT BEFORE IT RUNS YOU
1️⃣ Notice the size of your reaction.
If it feels disproportionate, too intense for what just happened, that’s your cue.
2️⃣ Name the echo.
Say quietly: “This is an old memory, not a new threat.”
It separates the past from the present.
3️⃣ Ground your body.
Unclench the jaw.
Drop the shoulders.
Breathe out longer than you breathe in.
Remind your nervous system that this moment is safe.
4️⃣ Reframe the signal.
The intensity isn’t weakness, it’s information.
Your system is showing you where an old wound still seeks resolution.
Trading doesn’t just reveal your skill.
It reveals your history.
And every emotional flashback you meet with awareness,
is one less echo shaping your next trade.

Copy Trading Made Me 60% Profit… Then Destroyed EverythingHave you ever heard about copy trading — that magic button promising you can earn profits just by following someone else’s trades?
I’d heard it a hundred times, but I was skeptical. Still, I decided to test it myself — because if it really worked, it would mean there’s a shortcut to success in trading, right?
My Real Experience in the Crypto Copy Trading World
At first, I started small — just a test with a tiny amount of money.
After one week, I couldn’t believe what I saw: +60% profit.
That’s the kind of return some professional traders don’t make in an entire year.
So I added more capital. And again — more profit.
It was so consistent that for a short moment, I started thinking:
“Maybe I don’t need to trade manually anymore… maybe this is it.”
Until one random day, everything changed.
Within hours, 60% of the total capital vanished.
Not only the profits — but the entire account took a massive hit.
Why Copy Trading Fails (Even When It Works for a While)
After this happened, I started studying how professional traders approached this topic — including Ross Cameron’s own test of multiple copy-trade alert services.
The conclusion was almost identical to my experience.
1. You’re Always Late
By the time you receive the alert or your account copies the trade, the entry price has already changed. If the trade goes up, your profit is smaller. If it goes down, your loss is bigger. Latency kills consistency.
2. You Have No Control
You can’t decide the risk per trade, the stop-loss, or the position size. Someone else does — and that means you’re exposed to risks you didn’t choose.
3. Liquidity and Spread Issues
In crypto, when someone opens a large position on a low-cap coin with thin order books, the copy trades that follow open at much worse prices — higher if it’s a buy, lower if it’s a sell. In other words, their exit point becomes your entry point.
4. False Confidence and Dependence
Even if the system makes money for a while, it teaches you nothing. You’re not becoming a better trader — you’re just outsourcing your decisions. And when it stops working, you have no skills to fall back on.
5. High-Risk Behavior of “Top” Traders
Many of the accounts behind copy systems take massive risks and show extremely poor Sharpe ratios. They might look profitable short-term, but their equity curves often end the same way — a crash.
Lessons Learned
Copy trading gives you the illusion of control — the dream that someone else can do the hard work for you.
But the truth is, you’re not participating in trading — you’re observing someone else’s gamble.
The only sustainable way forward is independence:
Learn the strategy
Practice on a simulator
Understand risk
Build your own discipline
That’s how you trade with confidence — not by copying trades, but by owning your decisions.
Choosing Your Path in Futures TradingThere’s more than one way to participate in the futures markets. Whether you're hands-on or prefer a more passive approach, selecting the right method depends on your trading goals, risk tolerance, and available time. Here’s a breakdown of the most common approaches used by active and aspiring futures traders.
1. Self-Directed Trading
If you like full control over your trades, this approach is for you. It requires staying up to date on market news, analyzing charts, and executing your own trades according to a plan and framework which can be referred to as your “strategy.” Experienced traders may prefer this model for its flexibility and transparency.
Past performance is not indicative of future results.
2. Automated Trading Systems
These systems use predefined rules to analyze data and execute trades without manual intervention. They can be ideal for traders who want to capitalize on algorithmic speed and logic while minimizing emotional decision-making, or for traders who might not have the time to dedicate to self-directed trading.
EdgeClear offers connectivity to a handful of automated programs, if you are interested in learning more please contact us.
3. Managed Futures
For a more passive route, managed futures allow you to invest in futures contracts through a Commodity Trading Advisor (CTA) or Commodity Pool Operator (CPO). The advisor handles the trading, using their expertise to manage risk and seek opportunity.
4. Broker-Assisted Trading
Prefer to have a trusted guide by your side? With broker-assisted trading, a professional helps execute trades, manage risk, and offer support—all tailored to your preferences.
Key Takeaway
Every trader’s journey in the futures markets looks different. Whether you thrive on taking full control of your trades, prefer automated systems, or rely on professional guidance, the key is to find the approach that aligns with your goals, risk tolerance, and lifestyle.
Understanding the options available self-directed, automated, managed, or broker-assisted empowers you to trade more confidently and effectively.
Call to Action
At EdgeClear, we’re dedicated to helping traders at every level find the tools, guidance, and support they need to succeed. Explore our platforms, connect with our expert brokers, or follow us on TradingView to discover more Trade Ideas and educational content to refine your edge.
Release the Pressure: Why Relaxed Traders Win MoreOne of the most overlooked psychological factors in trading is pressure — the silent force that makes you enter trades too early, exit too late, and misread what’s actually happening on the chart.
The truth is simple:
When you relax, you trade better.
The Illusion of “Always Doing Something”
Many traders feel that if they’re not in a trade, they’re missing out.
The market becomes a constant test of patience — and silence between trades feels unbearable.
That’s when poor decisions appear: forced entries, revenge trades, and overtrading to “feel productive.”
But the market doesn’t reward effort; it rewards timing.
Trading well often looks like doing nothing most of the time.
You wait, you observe, and you strike when the setup aligns.
This is where the relaxed mindset beats the pressured mindset every single time.
Example: Gold (XAUUSD) Between 3960 and 4030
Let’s take gold as an example.
As explained in my recent analysis, we have two clear levels to watch — 3960 and 4030.
Price is currently trading in between.
Even though it may look like it’s pressing upward and could form an ascending triangle, clarity only comes with a real breakout, not with anticipation.
A pressured trader will often feel the urge to predict — to “get in early” before confirmation.
But the calm trader simply waits.
They know that between levels, price action is noise, not opportunity.
And when clarity comes — either through a clean breakout or a rejection — the decision is obvious and stress-free.
This is what “releasing the pressure” looks like in practice:
You don’t force a trade. You let the market reveal the next step.
Why Pressure Kills Performance
Pressure doesn’t just come from the charts — it comes from expectations.
The trader who needs to make x$ per day will subconsciously search for confirmation that a trade exists.
Charts suddenly look clearer than they actually are.
Bias replaces logic.
And objectivity, which is the foundation of good trading, fades away.
In reality, the more you need to make money from trading, the harder it becomes to do so.
That’s not because the market is cruel — it’s because the human brain under stress stops processing probabilities correctly.
The Paradox of Ease
Every trader eventually experiences this paradox:
The less you try to “make something happen,” the more naturally good trades appear.
This isn’t mystical — it’s psychological.
When the mind is calm, your ability to notice quality setups improves dramatically.
You stop trying to control the market and start aligning with it.
It’s the difference between chasing a wave and surfing one.
Creating Space to Breathe
The professional approach to trading is not about constant activity — it’s about creating the conditions where clarity thrives.
That means reducing pressure in three ways:
1. Detach from daily profit goals.
The market doesn’t care about your personal targets. Focus on setups, not outcomes.
2. Allow financial breathing room.
When your rent, bills, and daily life depend on your next trade, emotional clarity disappears.
Build a secondary income or savings buffer — not for luxury, but for mental freedom.
3 . Redefine success.
A good trading day is not one with profit — it’s one with discipline.
When you measure success by process, not by dollars, you take power back from the market.
Final Thought
Most traders lose not because they lack skill, but because they trade under pressure.
The weight of expectation distorts perception, and the market punishes impatience.
Release the pressure — mentally, financially, and emotionally.
When you do, trading starts to flow the way it was meant to:
Quietly, naturally, profitably.

You Don’t Need a New Strategy—You Need a System (Here’s Proof)This week’s trade recap isn’t just about the winning setup — it’s about understanding why it worked and what that means for your long-term edge as a trader.
Most traders spend years chasing “the perfect strategy,” but strategy alone is just the product. Think of trading like business — McDonald’s and Burger King both sell burgers, but only one built a system that scales, duplicates, and dominates globally. The same applies to trading: your real edge isn’t the setup, it’s the structure behind it — your discipline, consistency, and process.
In this video, we break down:
The winning trade of the week and how the setup developed
Why edges are built through process, not predictions
How business thinking creates stronger traders
The mindset shift from “what to trade” to “how to operate”
Whether you’re trading forex, indices, or crypto, this session will help you think beyond entries and exits — and start building a business-level edge that lasts.
Tags: trading edge, trading psychology, weekly trade recap, trading mindset, how to build consistency in trading, forex strategy, trader discipline, trading process, profitable trading habits, business mindset for traders

Psychology of Execution — The Discipline Behind ProfitabilityThe trader’s work is not to predict, but to identify and repeat statistical edges.
We are not paid for time or effort — trading is not a conventional job where more work means more income.
We are compensated for analytical precision and disciplined execution.
Every trading system lives or dies by its risk management.
Capital protection is not defensive; it is strategic — because only preserved capital can compound.
Patience is not passivity; it is the highest expression of confidence in one’s own method.
There is no consistent profit outside of a system with proven positive expectancy.
The Stop Loss is not a punishment, but the technical boundary where an idea loses validity — respecting it preserves both capital and clarity.
The Take Profit is not greed; it is discipline in harvesting the statistical payoff that maintains long-term profitability.
Risk–Reward asymmetry is one of the most important principles of professional trading.
However, it must be calibrated: win rate and R:R are inversely correlated in most systems.
High R:R setups can be profitable even with low accuracy,
but the real question is whether the trader’s psychology can endure long sequences of losses without emotional erosion.
Market rumors and sentimental analysis are traps — they feed volatility, not precision.
Professional traders operate from objective data, structure, and impartial interpretation,
letting probability — not emotion — dictate the outcome.
Trading is a craft of asymmetry, probability, and restraint.
Profit is the by-product of method — not the reward for effort.

Building Rock-Solid Confidence: The Trader’s Unshakable EdgeConfidence is the foundation of every great trader — not because it guarantees wins, but because it guarantees consistency. In this session, we break down the psychology of self-belief and how to build confidence that doesn’t crumble when the market tests you.
Learn why confidence isn’t built from profits but from disciplined execution. We’ll cover how to stop second-guessing your trades, rebuild trust in your system, and detach your self-worth from your results. This episode shows you how professional traders use repetition, reflection, and recovery to stay calm, clear, and confident — even in drawdowns.
You’ll learn:
The difference between ego and true confidence
How to rebuild trust in your trading plan
Why the market manipulates your confidence and how to protect it
The 3-step framework for building self-trust in trading
If you’ve ever felt anxious before pressing “Buy” or “Sell,” or you constantly question your setups, this discussion will help you develop the rock-solid mindset needed to execute with precision and confidence.
Tags: trading psychology, trading confidence, self-belief for traders, trading mindset, forex psychology, discipline in trading, consistency in trading, emotional control, trader development, performance mindset

How to Analyze Your Trading Performance ScientificallyBy Skeptic – Founder of Skeptic Lab
Most traders know how to analyze charts — but few know how to analyze themselves.
A professional trader doesn’t just look at last month’s profit or loss; they examine consistency , volatility , and long-term stability.
Earlier today, as part of my usual routine, I was reviewing my trading performance and reflecting on my recent results. That’s when I decided to share my analysis process with you :) — a framework built from personal study and research that might help others turn raw data into real improvement.
In this tutorial , we’ll walk through a data-driven framework to evaluate your trading performance like a portfolio manager — using metrics such as cumulative return, volatility, Sharpe ratio, and trend analysis.
1. Data Collection: Turning Trades into Monthly Returns
Instead of focusing on single trades, record your monthly returns in percentage terms.
It can look as simple as this:
This structure helps you see the bigger behavioral pattern behind your system — not just isolated results.
“If you can’t describe what you’re doing as a process, you don’t know what you’re doing.” – W. Edwards Deming
2. Cumulative Return: The Power of Compounding
Your total return isn’t the average of each month — it’s compounded over time:
This shows whether your trading system has truly grown across time, not just fluctuated.
A positive total means your system is resilient; a negative one signals structural issues.
3. Key Statistical Metrics
Once your data is ready, calculate the following metrics — the backbone of every professional performance review:
4. Coefficient of Variation (CV) – Stability Indicator
A CV below 1 implies your returns are stable and predictable.
Above 1.5 suggests your system’s risk-to-reward profile is unstable — and may need adjustment.
5. Sharpe-like Ratio – Measuring Efficiency
Assuming a zero risk-free rate, the Sharpe ratio measures how much return you generate per unit of volatility:
Sharpe > 0.5 → healthy performance
Sharpe > 1 → professional-level consistency
Sharpe < 0.3 → the system needs review
“It’s not about being right, it’s about being consistent.” – Mark Douglas
6. Trend Analysis – Detecting Growth or Decay
Run a simple linear regression between time (month number) and return.
Positive slope: system improving
Negative slope: decline in edge or discipline
Positive slope with high variance: profitable but unstable behavior
Combining this with the Sharpe ratio gives a complete health check of your strategy.
📝Summary Table
Data without action is noise.
Use these insights to correct weaknesses and scale strengths:
Identified Issue: High volatility
→ Practical Fix: Reduce position size in range-bound markets
Identified Issue: Consecutive drawdowns
→ Practical Fix: Add trailing stops or break-even adjustments
Identified Issue: Low average return
→ Practical Fix: Reassess position sizing or strategy fit
Identified Issue: Overconfidence after wins
→ Practical Fix: Apply daily or weekly risk caps
🧩 Final Thoughts
Analyzing your performance is not just about profits — it’s about understanding your patterns .
By measuring Sharpe, CV, and trend, you can answer three crucial questions:
Is my growth consistent or random?
Is my risk proportional to my return?
Can I replicate this performance?
If the answer is yes, you’re not just improving your system —
you’re evolving as a trader :)
🩵If you found this tutorial helpful, give it a boost and share it with your fellow traders. Let’s grow together, not alone!
Happy trading, and see you in the next tutorial ! 💪🔥
The Billy Big Balls MomentA trader reached out to me by direct message here on Trading View highlighting a challenge that many of us face from time to time. We’re talking about self sabotage. That moment you know what to do - but do something entirely different and get a result that frustrates the **** out of you.
Follow along, I hope this helps.
BUT FIRST
NOTE – This is a post on mindset and emotion. It’s not a trade idea or strategy designed to make you money. My intention is to help you preserve your capital, focus, and composure so you can trade your own system with calm and confidence.
Here's a scenario you might be familiar with...
You nail a sequence of trades.
Precision. Flow. Everything lines up.
And then something flips.
You start pushing harder, sizing up, breaking your own rules.
A few minutes later, you’re staring at a screen wondering,
“What the hell just happened?”
It’s not lack of discipline nor is it a technical problem.
You have an emotional pattern that hasn’t been mapped out yet.
This pattern has roots into your subconscious and it’s sabotaging your efforts.
WHATS REALLY HAPPENING AND WHERE DOES THE DRIVER REALLY COME FROM
When you start winning, your brain gets flooded with dopamine , the chemical of reward and anticipation.
If your nervous system has ever learned that success leads to loss, losing control, losing safety, losing connection it quietly associates “winning” with risk .
The mind says, “Let’s keep this going.” Deeper down though is the silent warning … “This isn’t safe.”
Doesn’t sound logical right? It’s not. It’s emotional. Deeply embedded in your psyche and activated whenever the mind feels that familiar feeling again.
The mind wants to go forward - the body wants to intervene. And so you get an internal split. A moment of pressure that your mind just has to resolve. And the fastest way the subconscious knows to relieve that pressure… is to end the win.
So you do something impulsive, not because you want to fail,
but because deep down, you're trying to protect yourself or believe or not, you might be even trying to punish yourself.
Weird stuff happens in the subconscious.
That’s why the sabotage happens right after a run of success.
It’s not logic breaking down.
It’s the mind trying to restore an emotional equilibrium.
HOW TO CATCH IT BEFORE IT HAPPENS
Listen. The moment you size up impulsively is not random.
It’s a repeatable signal that your emotional system has been triggered.
You can’t fix what you can’t see - so start tracking it.
1. Notice your signature cue.
For some, it’s tension in the chest or a fidgety feeling of restlessness.
For others, it’s the need to “just check one more chart.”
For you it might be something else. Pay attention and start to become aware of what comes up for you.
2. Map the pattern
Keep a short log : what happens right before you go rogue?
Notice the time of day, physical tension, thoughts.
You are looking for a repeatable sequence.
3. Identify your threshold
There’s always a tipping point where clarity narrows: your breath shortens, attention tunnels or you start fantasising about bigger gains.
That’s your signal.
4. Interrupt the pattern and create a recovery plan (as you notice the cues)
Physically step away from the desk.
Exhale through the mouth long, slow, 6 seconds.
Let your eyes rest on something still . This shifts the nervous system out of fight-or-flight and back into focus.
This isn’t about controlling emotion.
Its about expanding your capacity so emotion doesn't control you.
Next time you’re on a hot streak, notice where focus ends and thrill begins.
That’s the edge that makes or breaks the run.

Banishing Greed From Trading: Why Wanting More Keeps You LosingGreed is one of the most destructive emotions in trading — it convinces you to ignore your plan, hold too long, and overleverage after a win. In this session, we break down how greed quietly sabotages traders and how to build the mental discipline needed to trade with clarity.
This episode of The Trader’s Therapist explores the psychological roots of greed, how it distorts decision-making, and how professional traders use stoic principles to detach from the outcome and focus purely on execution.
You’ll learn:
The real psychology behind greed and overtrading
How to spot greed before it costs you
Why the “enough” mindset is key to long-term consistency
Practical tools to eliminate emotional trading habits
If you’ve ever turned a winning trade into a loss because you wanted just a little more, this discussion will hit home.
Tags: trading psychology, greed in trading, emotional control, trading discipline, forex mindset, risk management, stoic trading, consistency in trading, mindset for traders, professional trading habits

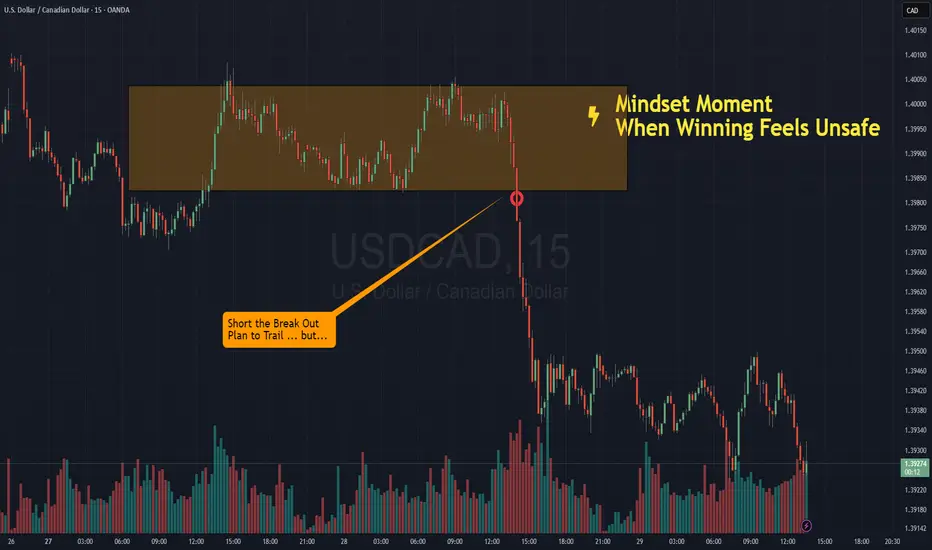
When Winning Feels UnsafeNOTE – This is a post on mindset and emotion. It is not a trade idea or strategy designed to make you money. My intention is to help you preserve your capital, focus, and composure so you can trade your own system with calm and confidence.
You’re in profit.
The trade’s working.
Your system’s doing exactly what it should.
But instead of ease, something tightens.
A flicker of doubt.
You can hear that inner voice: “Don’t mess this up. You wouldn’t want to give this back now would you? How much is enough anyway?”
You scan the chart again.
Check your unrealized PnL.
Move the stop closer.
Start managing… what doesn’t need managing.
Here’s what’s really happening:
Your subconscious is remembering what happened the last time you saw success…
The time you relaxed and it reversed.
The time you felt proud and someone cut you down.
The time you won and it didn’t last.
So even when the market moves in your favour, part of you braces.
Waiting for the other shoe to drop.
So that voice saying, don’t mess this up - is actually a memory trying to protect you.
And in so doing, never really lets you feel safe
The point here is that your work as a trader is to be in the here and now. Not in the past.
Be cognisant to the cues of your memory and body that don’t work in your favour.
So when you notice tension rising,
Take one slow breath. Feel your feet on the floor. And repeat. ‘Right here, right now’.
And then …
Follow your trade plan.
Stay true to your trading plan.
Manage your risk
And let the market do what it does.
A few important steps for creating robust and winning StrategiesAs the title says, I want to share knowledge & important insights into the best practices for creating robust, trustworthy and profitable trading Strategies here on TradingView.
These bits of information that my team I have gathered throughout the years and have managed to learn through mostly trial and error. Costly errors too .
Many of these points more professional traders know, however, there are some that are quite innovative for all levels of experience in my opinion. Please, feel free to correct me or add more in the comments.
There are a few strategic and tactical changes to our process that made a noticeable difference in the quality of Strategies and Indicators immediately.
Firstly and most importantly, we have all heard about it, but it is having the most data available. A good algorithm, when being built NEEDS to have as many market situations in its training data as possible. Choppy markets, uptrends, downtrends, fakeouts, manipulations - all of these are necessary for the strategy to learn the possible market conditions as much as possible and be prepared for trading on unknown data.
Many may have heard the phrase "History doesn't repeat itself but rhymes well" - you need to have the whole dictionary of price movements to be able to spot when it rhymes and act accordingly.
The TradingView Ultimate plan offers the most data in terms of historical candles and is best suited for creating robust strategies.
___
Secondly, of course, robustness tests. Your algorithm can perform amazingly on training data, but start losing immediately in real time, even if you have trained it on decades of data.
These include Monte-carlo simulations to see best and worst scenarios during the training period. Tests also include the fundamentally important out-of-sample checks . For those who aren’t familiar - this means that you should separate data into training sets and testing sets. You should train your algorithm on some data, then perform a test on unknown to the optimization process data. It's common practice to separate data as 20% training / 20% unknown / 20% training etc. to build a data set that will show how your algorithm performs on unknown to it market movements. Out of sample tests are crucial and you can never trust a strategy that has not been through them.
Walk-forward simulations are similar - you train your algorithm on X amount of data and simulate real-time price feeds and monitor how it performs. You can use the Replay function of TradingView to do walk-forward tests!
When you are doing robustness tests, we have found that a stable strategy performs around 90% similarly in terms of win rate and Sortino ratio compared to training data. The higher the correlation between training performance and out of sample performance, the more risk you can allocate to this algorithm.
___
Now lets move onto some more niche details. Markets don’t behave the same when they are trending downward and when they are trending upwards. We have found that separating parameters for optimization into two - for long and for short - independent of each other, has greatly improved performance and also stability.
Logically it is obvious when you look at market movements. In our case, with cryptocurrencies, there is a clear difference between the duration and intensity of “dumps” and “pumps”. This is normal, since the psychology of traders is different during bearish and bullish periods. Yes, introducing double the amount of parameters into an algorithm, once for long, once for short, can carry the risk of overfitting since the better the optimizer (manual or not), the better the values will be adjusted to fit training data. But if you apply the robustness tests mentioned above, you will find that performance is greatly increased by simply splitting trade logic between long and short. Same goes for indicators.
Some indicators are great for uptrends but not for downtrends. Why have conditions for short positions that include indicators that are great for longs but suck at shorting, when you can use ones that perform better in the given context?
___
Moving on - while overfitting is the main worry when making an algorithm, underoptimization as a result of fear of overfitting is a big threat too . You need to find the right balance by using robustness tests. In the beginning, we had limited access to software to test our strategies out of sample and we found out that we were underoptimizing because we were scared of overfitting, while in reality we were just holding back the performance out of fear. Whats worse is we attributed the losses in live trading to what we thought was overfitting, while in reality we were handicapping the algorithm out of fear.
___
Finally, and this relates to trading in general too, we put in place very strict rules and guidelines on what indicators to use in combination with others and what their parameter range is. We went right to theory and capped the values for each indicator to be within the predefined limits.
A simple example is MACD . Your optimizer might make a condition that includes MACD with a fast length of 200, slow length of 160 and signal length of 100. This may look amazing on backtesting and may work for a bit on live testing, but these values are FUNDAMENTALLY wrong (Investopedia, MACD). You must know what each indicator does and how it calculates its values. Having a fast length bigger than the slow one is completely backwards, but the results may show otherwise.
When you optimize any strategy, manually or with the help of a software, be mindful of the theory. Mathematical formulas don’t care about the indicator’s logic, only about the best combination of numbers to reach the goal you are optimizing for - be it % Return, Profit Factor or other.
Parabolic SAR is another one - you can optimize values like 0.267; 0.001; 0.7899 or the sort and have great performance on backtesting. This, however, is completely wrong when you look into the indicator and it’s default values (Investopedia, Parabolic SAR).
To prevent overfitting and ensure a stable profitability over time, make sure that all parameters are within their theoretical limits and constraints, ideally very close to their default values.
Thank you for reading this long essay and I hope that at least some of our experience will help you in the future. We have suffered greatly due to things like not following trading theory and leaving it all up to pure mathematical optimization, which is ignorant of the principles of the indicators. The separation between Long / Short logic was also an amazing instant improvement.
View the linked idea where we explain the psychology of risk management and suggest a few great ways to calculate and manage your risk when trading - just as important as the strategy itself!
What do you think? Do you use any of these methods; Or better ones?
Let us know in the comments.
The Phantom TradeThe Phantom Trade .... In the spirit of Halloween ...
NOTE – This is a post on mindset and emotion. It is not a trade idea or strategy designed to make you money. My intention is to help you preserve your capital, focus, and composure — so you can trade your own system with calm and confidence.
You missed it.
The setup you’d been watching for days, maybe weeks finally played out.
Clean. Precise. Exactly as planned.
But you weren’t in it.
Maybe you hesitated.
Maybe the trigger didn’t line up perfectly.
Or maybe you just weren’t at your desk.
Either way, it’s done.
But your mind doesn’t let it go.
You replay it.
Frame by frame.
You check where you would have entered, where you would have exited.
You tell yourself it’s “reviewing.”
But it’s not.
It’s rumination.
A mental loop that feels productive but keeps you stuck in what can’t be changed.
You’re not trading the market anymore… you’re trading your memory of it.
And every replay reinforces the belief that you should’ve done better.
The body joins in too.
Tight chest. Restless legs.
An urge to make it back .
That’s the real danger.
Because the next trade isn’t about opportunity, it’s about redemption.
And redemption trades rarely end well.
The skill isn’t in ignoring the regret.
It’s in recognising it for what it is: the echo of unmet expectation.
Ask yourself: what am I actually trying to fix here?
The missed trade… or the feeling of not being enough?
The point here is:
Reflection helps you grow.
Rumination keeps you stuck.
Learn to tell the difference.
That’s where real mastery begins.

Understanding Margin & Mechanics in Futures MarketsBefore you trade Futures, it’s essential to understand how these markets operate, especially how margin, leverage, and settlement work. This insight helps you manage risk, stay capital-efficient, and avoid unnecessary surprises.
Margin Basics
Every future position requires margin. It’s important to note margin is not an added cost per contract, margin is a good-faith deposit or can be thought of as a “performance bond” to ensure you can meet your obligations. There are three main types:
Initial Margin: The exchange sets this as a percentage of the contract’s notional value based on a wide variety of factors including volatility, size of the contract, and average market movement.
Maintenance Margin: The minimum balance required to keep your position open. If your balance drops below this, you’ll get a margin call.
Day Trading Margin: Set by your broker, often a fraction of the exchanges Initial Margin. Day Trading margins can provide more leverage, but in turn this comes with more risk.
Leverage in Action
Futures are leveraged products. With just a small amount of capital, you can control a much larger position. For example, with the E-mini S&P 500 trading at 6800, one contract has a notional value of $50 x 6800 = $340,000. We illustrate this below using initial margin and day margins examples.
Leverage using Initial Margin:
Leverage = Notional Value / Initial margin required
Example:
For 1 Long ES contract, with initial margin $23429.
Leverage = 340,000 /23429
Leverage = 14.5x
Leverage using Day Trading Margin:
Leverage = Notional Value / Day margin required
For 1 Long ES contract, with day margin at $1000.
Leverage = 340,000/1000
Leverage = 340x
**As the notional value rises or falls, so does leverage. Leverage is a double-edged sword it can work for you and against you. Higher leverage increases the risk of gains as well as losses.
Depending on your margin, you might only need a few thousand dollars to take that trade. While this enhances your buying power, it also increases risk, as losses could exceed your initial deposit.
Mark-to-Market & Daily Settlements
Futures are marked to market daily. This means your P&L is updated at the end of each session based on the day’s closing price. Gains are credited to your account, and losses are debited, helping to ensure real-time risk management and capital adequacy.
Physical vs. Cash Settlement
When a contract expires, there are two possible outcomes:
Physical Delivery: You receive or deliver the actual commodity.
Example: An oil producer secures a price of $62.00 per barrel through a long futures position. At contract expiration, the producer is obligated to take delivery of 1,000 barrels, which represents $62,000 in total value. If market prices rise to $80.00 per barrel, the producer can sell the physical oil at an $18.00 per barrel gain (before accounting for commissions and futures and other related fees).
Cash Settlement: No goods change hands, and your account is adjusted based on the final settlement price set by the exchange. This is common in financial contracts like the E-mini S&P 500 (ES).
Understanding margin and leverage is fundamental to trading futures effectively. These mechanics define how much risk you’re taking, how your capital is allocated, and how your account is managed daily.
At EdgeClear, our mission is to help traders develop a deeper understanding of the markets and the tools that move them. Follow us on TradingView for more Trade Ideas like this one, or connect with our team to learn how you can trade futures with confidence, precision, and the right guidance.
My Steps On how To Improve Forex Trading Win / Loss Ratio In this video we talk about the three elements of the new plan that I have designed based on different types of schools and educational sources.
The plan elements consist of SMC (Smart Money Concepts), Classical School (Support & Resistance, Trend Lines, Febonacci Retracement (not all the time)), and the Stochastic Indicator.
The stochastic is of two timeframes, One is weekly and the other is daily but both are shown on the daily timeframe. This is something that I loved here about TradingView; is the ability to show an indicator of a different timeframe.
Last week I opened a couple of positions based on the new plan, but one of them was opened with haste and not totally adhered to my trading Plan rules.
I show the exact trading rules that I am using and how this will affect my risk management plan.

Why My Stop Loss Didn’t Trigger?”🛑 “Why My Stop Loss Didn’t Trigger?”
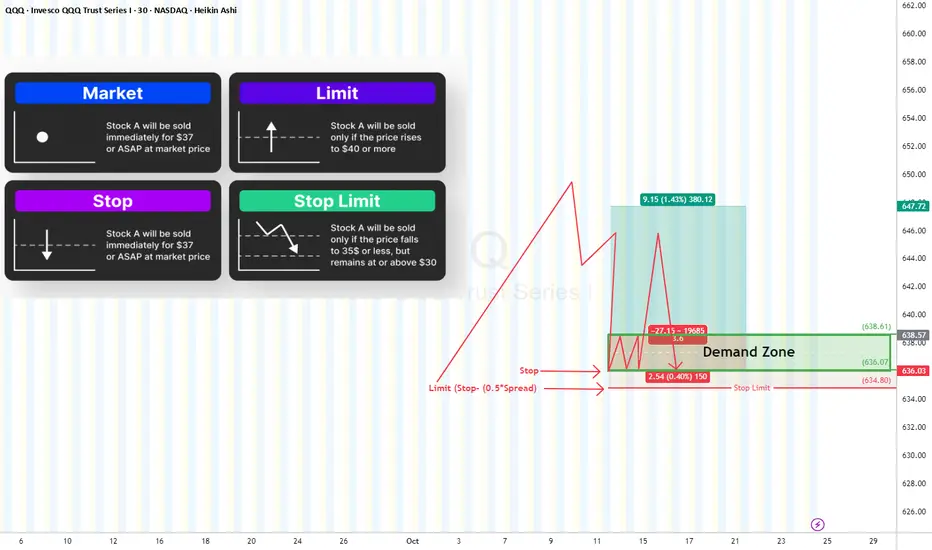
Let’s talk about Stop Orders, Stop Limits, Spreads, and the Outside-RTH trap.
Before we blame the broker, it’s crucial to understand how each order type actually works:
🔹 Market Order
Executes immediately at the best available price.
✅ Guarantees execution
⚠️ Doesn’t guarantee price (can slip during volatility).
🔹 Limit Order
Executes only at your specified price or better.
✅ Price control
⚠️ Might never fill if market doesn’t reach your limit or gap down.
🔹 Stop Order (Is a Stop “Market” Order)
Activates when price hits your stop level, then converts into a market order.
✅ Great for stop-loss protection
⚠️ May fill at much lower price than your stop due to slippage.
🔹 Stop Limit Order
Activates at the stop trigger, then becomes a limit order — meaning it only executes if the market trades at your limit price or better.
✅ Full control over fill price
⚠️ Risk of not executing at all if price moves away quickly.
Regular Trading Hours (RTH):
Market orders are supported → Stop Market
Outside RTH (Pre/Post-market):
Market orders are not supported therefore, only Stop Limit works.
Now, Why Your Stop Might Not Trigger?
1- You used a Stop-Limit (not Stop Market)
If the market gaps beyond your limit, there’s no fill (Buyer) at this price.
Price “touched” your stop — but never traded through your limit price.
2- You traded Outside RTH
During pre-market or after-hours, If you didn’t enable “Outside RTH” trading, your stop simply didn’t activate.
3- Thin Liquidity
Low volume = fewer buyers/sellers near your stop → delayed or partial fills.
This is especially true Outside RTH, where spreads widen and depth disappears. Or you are trading an equity or ETFs with slim volume (check the volume first before trading any asset)
✅ Recommendation:
Use Stop-Limit + “Allow Outside RTH+GTC” and make your limit “marketable” to ensure execution.
Offset guide for Stop-Limits (Δ):
• At least 0.5× spread
• Or ¼ to ½ ATR(5) for your timeframe
Example for a long position:
• You bought at $100, want to exit if it breaks $99.80.
• Pre-market spread = $0.12
• Set: Stop = 99.80, Limit = 99.68 (≈0.12 below stop)
→ Gives room for spread expansion and slippage so the stop fills quickly.
How to Set a Reliable Stop-Limit
Market Order Type Settings Notes
Equities & ETFS (RTH) Stop Market Standard stop Fastest execution
Equities & ETFS (Outside RTH) Stop Limit + GTC Limit offset = Spread Needed for after-hours fills
Futures / FX / Crypto Stop Market 24h trading Market fills OK
The Best Setup
✅ Inside RTH → Stop Market (guaranteed execution)
✅ Outside RTH → Stop Limit + GTC enabled with marketable offset
✅ Always give buffer beyond supply/demand levels (0.1–0.3%)
✅ Watch spread and volume before placing stops
Final Takeaway
Your stop loss isn’t just a line on the chart — it’s an engineered safety net.
Use the right order type for the session, give it breathing room, and understand how spread, liquidity, and RTH rules impact execution.
Because a stop loss that doesn’t trigger… isn’t a stop loss at all. 🛑