Trading Center: The Dashboard That Changes EverythingStop Drowning in Data. Start Seeing What Matters.
Most traders have 47 browser tabs open, three charting platforms running, and still miss important information.
The problem isn't lack of data. It's lack of organization.
A well-designed trading dashboard transforms chaos into clarity — showing you exactly what you need, when you need it.
Why You Need a Dashboard
The Problem:
Information scattered across platforms
Important data buried in noise
Constant tab-switching and distraction
Missing signals while looking elsewhere
Decision fatigue from information overload
The Solution:
A centralized dashboard that:
Shows key metrics at a glance
Alerts you to important changes
Reduces cognitive load
Keeps you focused on what matters
Dashboard Components
1. Market Overview Panel
What to Include:
Major indices (SPY, QQQ, IWM)
Key sectors
VIX/volatility
Market breadth
Futures if relevant
Purpose:
Understand overall market context before any trade.
2. Watchlist Panel
What to Include:
Your active watchlist
Current price and change
Key levels (support/resistance)
Volume vs average
Alerts status
Purpose:
Track potential opportunities without switching screens.
3. Open Positions Panel
What to Include:
All current positions
Entry price and current price
P&L ($ and %)
Stop loss and target levels
Time in trade
Purpose:
Monitor all positions at a glance.
4. Risk Dashboard
What to Include:
Total portfolio exposure
Open risk ($ at risk)
Daily P&L
Drawdown from peak
Correlation warnings
Purpose:
Never lose track of your risk.
5. Economic Calendar
What to Include:
Upcoming economic events
Earnings dates for watchlist
Fed meetings
Major news events
Purpose:
Avoid being surprised by scheduled events.
6. Performance Metrics
What to Include:
Win rate (recent and overall)
Average R-multiple
Profit factor
Current streak
Monthly P&L
Purpose:
Track performance without opening spreadsheets.
7. Alerts and Notifications
What to Include:
Price alerts
Indicator alerts
News alerts
Risk threshold warnings
Purpose:
Get notified of important events without constant monitoring.
Dashboard Design Principles
Principle 1: Hierarchy of Information
Most important information should be most visible.
Critical data: Large, prominent
Supporting data: Smaller, secondary
Reference data: Available but not distracting
Principle 2: Reduce Noise
Only include what you actually use.
If you haven't looked at it in a week, remove it
Every element should serve a purpose
White space is valuable
Principle 3: Consistent Layout
Same information in same place every time.
Build muscle memory
Reduce search time
Faster decision making
Principle 4: Color Coding
Use color meaningfully.
Green: Positive/bullish
Red: Negative/bearish
Yellow: Warning/attention
Neutral: Normal state
Principle 5: Real-Time Where Needed
Not everything needs to update every second.
Price data: Real-time
Performance metrics: Daily update fine
Economic calendar: Daily update fine
AI-Enhanced Dashboards
1. Smart Alerts
AI filters alerts to show only significant ones:
Unusual volume
Pattern completions
Correlation changes
Risk threshold approaches
2. Anomaly Detection
AI highlights unusual conditions:
Abnormal price movements
Unusual options activity
Sentiment shifts
Correlation breakdowns
3. Predictive Insights
AI provides forward-looking information:
Expected volatility
Probability of hitting targets
Risk scenario analysis
4. Personalized Recommendations
AI suggests based on your patterns:
Best times to trade
Setups matching your edge
Risk adjustments needed
Building Your Dashboard
Option 1: TradingView Layout
Multiple chart layout
Watchlists
Alerts
Limited customization but integrated
Option 2: Spreadsheet Dashboard
Google Sheets or Excel
Pull data via APIs or manual
Highly customizable
Requires maintenance
Option 3: Dedicated Dashboard Tools
Notion, Airtable
Trading-specific tools
More features, learning curve
Option 4: Custom Build
Python + visualization libraries
Maximum flexibility
Requires coding skills
Dashboard Checklist
Before Market Open:
Check market overview (futures, indices)
Review economic calendar
Check open positions
Review watchlist for setups
Verify alerts are set
During Trading:
Monitor open positions
Track risk exposure
Watch for alerts
Note market context changes
After Market Close:
Review daily P&L
Update performance metrics
Adjust watchlist
Set alerts for tomorrow
Dashboard Mistakes
Too Much Information — Cramming everything onto one screen. Only include what you actually use daily.
No Hierarchy — Everything same size and prominence. Make critical information stand out.
Inconsistent Layout — Moving things around constantly. Set a layout and stick with it.
Ignoring Mobile — No way to check when away from desk. Have a simplified mobile version.
Not Updating — Dashboard becomes stale and ignored. Regular review and refinement.
Sample Dashboard Layout
Top Row: MARKET OVERVIEW — SPY, QQQ, IWM, VIX at a glance
Left Column: WATCHLIST — Your opportunities with price, change, key levels
Center: OPEN POSITIONS — All positions with P&L, stops, targets
Right Column: RISK DASHBOARD — Exposure, open risk, drawdown
Bottom Left: ALERTS — Price alerts, indicator alerts, warnings
Bottom Right: CALENDAR — Today's events, upcoming earnings
Key Takeaways
A dashboard transforms scattered information into organized clarity
Include only what you actually use — less is more
Design with hierarchy — critical information most prominent
Consistency builds speed — same layout every day
Regular refinement keeps the dashboard useful
Your Turn
What does your current trading setup look like?
What information do you wish you could see at a glance?
Share your dashboard ideas below 👇
Tradingsetups

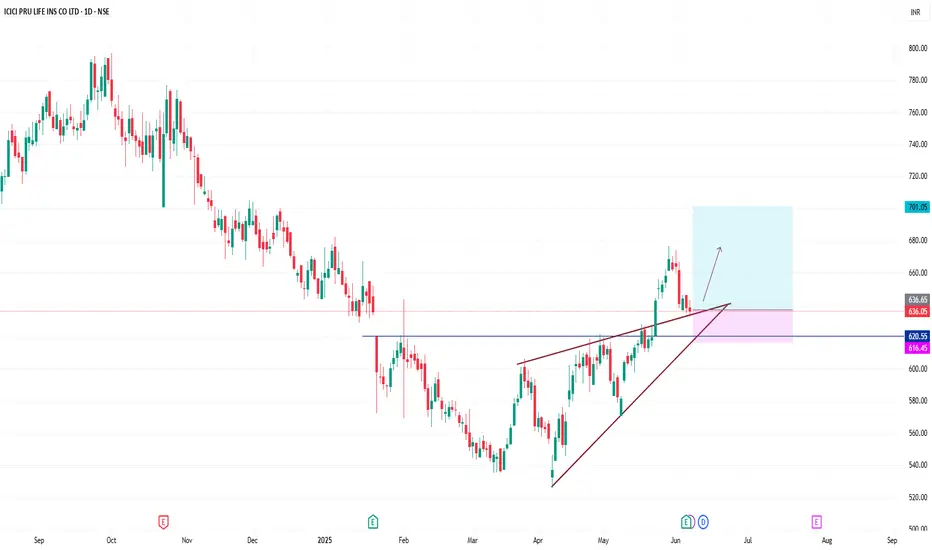
ICICI PRU LIFE INSDaily timeframe, its a swing trade, trendline breakout and retest, stoploss below 620 and target is 700, add your watchlist and observ this stock.
GOLD 1H ROUTE MAP & TRADING PLAN UPDATEHey Everyone,
As you can see our levels on this chart are being respected perfectly with each of our weighted levels giving us the bounces and rejection to be able to track and trade the movement level to level.
After completing 2040 we got another retest on the retracement range, which gave the bounce into 2036.
We then had another re-test at the retracement level 2030, as no break above 2036. EMA5 crossed and locked below 2030 opening 2022 Goldturn, which was hit and gave a nice bounce now heading into 2036, which is now re-open.
We have 2040 at the range top that will need to break and lock to see the range above and 2015 at range bottom holding the structure. Price is likely to bounce and play in this range with our Goldlturns providing the bounces and rejections.
We will keep the above in mind when taking buys from dips. Our updated levels and weighted levels will allow us to track the movement down and then catch bounces up.
We will continue to buy dips using our support levels taking 30 to 40 pips. As stated before each of our level structures give 20 to 40 pip bounces, which is enough for a nice entry and exit. If you back test the levels we share every week in the past 24 months, you can see how effectively they were used to trade with or against short/mid term swings and trends.
BULLISH TARGETS
2030 - DONE
2040 - DONE
EMA5 CROSS AND LOCK ABOVE 2040 WILL OPEN THE FOLLOWING BULLISH TARGET (NO CROSS AND LOCK)
2048
2055
BEARISH TARGETS
2030 - DONE
EMA5 CROSS AND LOCK BELOW 2030 WILL OPEN THE SWING RANGE
SWING RANGE
2015 -DONE
2007
As always, we will keep you all updated with regular updates throughout the week and how we manage the active ideas and setups. Please don't forget to like, comment and follow to support us, we really appreciate it!
GoldViewFX
Mr Gold

Xau (Overview)This is the overview of the xau short
Note that this analysis only applies if the market continues on this its current momentum and if the market has a change of course, I'd publish the next analysis
BOOST 🚀, COMMENT 📑 and FOLLOW 🏷 for more helpful analysis 👍...

Comprehensive Analysis of $BTCUSD Price Movements, Halving ImpacIntroduction:
This analysis explores critical factors influencing Bitcoin's price movements, including technical analysis, halving effects, trading setups, and recent market news.
Technical Analysis - BTC/USDT Chart:
Analyzing the BTC/USDT chart, a retracement to $34,000 is expected, forming a potential bull trap. Subsequent downward momentum is foreseen, reaching $29,000-$30,000, attracting smart money.
Further projections include breaking resistances at $50,000, a brief pullback to $44,000 (CME gap zone), followed by a surge to $74,000. A correction to $55,000 ensues, paving the way for continued bullish trends to $81,000-$83,000. A substantial correction is anticipated thereafter.
Halving Information:
The impending Bitcoin halving introduces challenges before the event, emphasizing the need for strategic decision-making, especially in the context of emerging ETF developments.
Trading Setups and Corrections:
Current market dynamics reveal a correction phase nearing completion. Traders should monitor for potential entry points as this phase concludes, setting the stage for the next upward trajectory.
Financial News Impact:
Recent financial news highlights the launch of Salvadoran Bitcoin volcano bonds in Q1 2024 post-regulatory approval. This development could positively influence market sentiment, impacting Bitcoin's price dynamics.
Ethereum's 2024 Prospects:
JPMorgan forecasts Ethereum's outperformance over Bitcoin in 2024, adding complexity to the cryptocurrency landscape and emphasizing the importance of diversification.
Conclusion:
In conclusion, the analysis suggests a nuanced journey for Bitcoin, marked by retracements, bullish phases, and corrections. The impending halving, evolving trading setups, and external factors such as financial news and Ethereum's performance contribute to the dynamic nature of the cryptocurrency market. Traders are advised to exercise caution, stay informed, and adapt strategies to navigate the inherent volatility in the crypto space.

Market Review for Wednesday 15-11-23 Trading OpportunitiesA look at the Market Sentiment and trading opportunities on offer for the session. Review of the price action we want to see prior to an entry Setup.
The only Trades which have been highlighted are ones coming off a level and showing promise.

ZEUS Bullish MACD Setup - High Accuracy of Winning TradesOur MACD Setup is created to reveal winning entry points for a trade with high accuracy.
In our MACD Setup we combine multiple conditions to recognize only strong entry points.
Multiple factors need to be met in confluence:
1. Recognize the Trend = Bullish / Bearish Trend (50 EMA is Above / Below 200 EMA)
2. There is a MACD Cross = Bullish / Bearish MACD Cross (MACD Cross is Below / Above Zero Horizontal Line)
3. Avoid False Signals in a Sideways Markets = MACD Cross far from horizontal zero “0” line
4. Filter only Strong Trend Situations = Candle Close above/below 200 EMA
5. Avoid Extreme Values in RSI = check if there is way to go before we get oversold/overbought
6. Our Algorithm Filters Signals in Side Trend and Low Volume Markets
Let´s explain the conditions step by step
1. Recognize the Trend
Exponential Moving Average (EMA) is one of the most effective trend identification indicator. Traders like it because of it its simplicity.
EMA is usually used in combination between 200 days (as a slow indicator) and 50 days (as fast indicator of the trend).
Bullish Trend = EMA 50 is Above EMA 200
Bearish Trend = EMA 50 is Below EMA 200
2. There is a MACD Cross
After we recognized the Trend (Bullish Trend in our case) we would like to trade with the trend so we are looking for Bullish MACD Cross.
Bullish MACD Cross is Below Zero Horizontal Line
3. Avoid False Signals in a Sideways Markets
So we found Bullish MACD Cross and now we want to be sure that the Cross far away from the Zero Horizontal Line.
Our algorithm filters crosses and shows only signals with decent distance form Zero Horizontal Line.
4. Filter only Strong Trend Situations
Once we have met the first three criteria (Bullish Trend and Bullish MACD Cross far from Zero Horizontal Line) we need confirmation that the market is still strong and is moving forward in an uptrend.
So we look at price action and there need to be Candle Close Above EMA 200 . Closing about EMA 200 indicates continuation of the trend.
5. Avoid Extreme Values in RSI
The other condition is based on RSI and we are looking only for situations where RSI is not overheated so there is a way for trend continuations.
In our case RSI was in the middle values so we can expect market to continue its uptrend.
6. Our Algorithm Filters Signals in Side Trend and Low Volume Markets
We have developed our own Algorithm which filters signals in low volume markets and side trend.

APTUSDT Long Trading Idea.APTUSDT Long Trading idea with easy invalidation.
If h4 hold supports, its good to go till first TP of the setup, SL is just invalidation to setups, but can also scam wick out the setup if BTC.D stop declining.

GoldViewFX - FOMC Market UPDATEHey Everyone,
BOOOOOOOM!!!!!
We waited patiently once again for the right setup. The 1779 break that we highlighted yesterday opened the swing range like we said. We waited for the swing range with a further signal confirmation in VIP and the we took the buys with precision with a perfect exit !!!! CLEAN CALL, CLEAN PIPS!!!
As you can all see the swing range gave us the perfect swing on FOMC!!!
Our plans to buy from support levels is still in play unless we see sell signals activate. We are back in the range so our setups are all still in valid.
As always we will keep you all updated with any changes to our plans throughout the week. Please don't forget to like, comment and follow to support us, we really appreciate it!
GoldViewFX
XAUUSD TOP AUTHOR

Eurusd retest leveleurusd
the euro and the dollar pair have again given positive signal towords the top which could be the target 1.1365
buy above at 1.1337
pattren;revesal head and shoulder

CVS - 6.18% Profit Potential - Ascending TriangleCareful - I will wait for earnings before placing this order.
Ascending Triangle formed after a 6-month correction and a recent run. Betting on last month's momentum run.
Good risk-reward ratio and target set at a potential formation of a 6-month resistance line.
- Target Entry: $77.80
- Target Stop Loss: $75.91
- Target Exit: $82.51
- Risk / Reward Ratio: 2.49
About me
- Note that I tend to adjust stop losses in order to secure profits early and preserve capital. This means that the target price is going to be achieved as long as there are no strong pullbacks that trigger my new adjusted stop loss

EURCHF H4 - Short SetupEURCHF H4
USDCHF selling off looking to break the 0.89 support we were following, downside on EURCHF has been broken and fresh lows have been set.
Currently retesting the underside of the structure break as indicated, we don't tend to buy and sell unless it's from a major zone (red boxes). So this is something we will just observe from the sideline.
