Cardano - Repeating the +3.000% bullish cycle!CRYPTO:ADAUSD is creating price action like back in 2020 and we might see a rally soon.
Looking at the higher timeframes allows you to massively capitalize on overall market swings and cycles. Especially when it comes to Cardano, these cycles are pretty rewarding but also pretty predictable. At

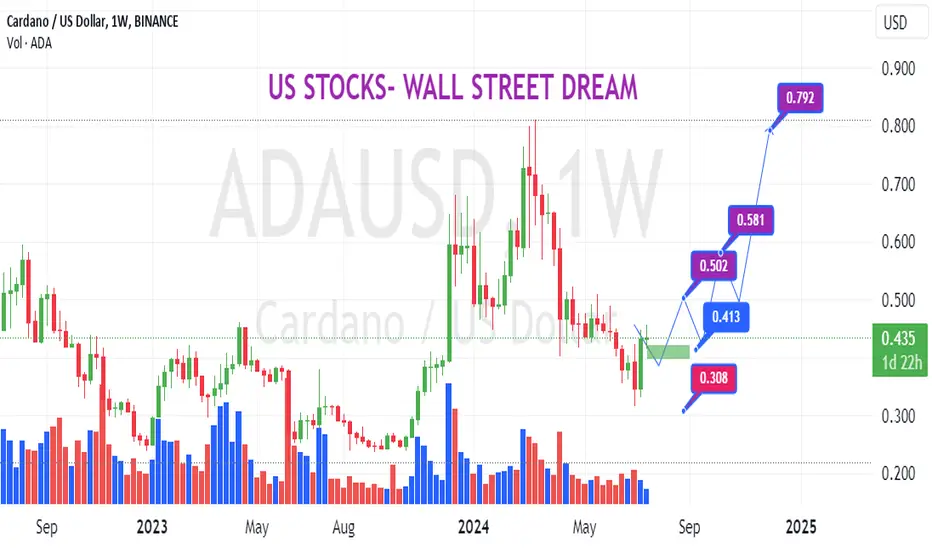
ADAUSD- Preparing for a long up viewADAUSD- Preparing for a long up view
-Demand zone support.
-Tweetzer candles confirm bottom.
-Inversed HnS scenerios.
.
Wait and see!
Accumulation - 8hrDespite what price action represents, ADA has been accumulated over the last 10 months.
Trust where the money goes, regardless of what they say to bring price down

ADAUSD - 4hr (Golden Cross)Price action respecting the 4hr moving averages currently. Will need to retest lower after the golden cross. Price action might look something like this for the next week or so.

ACCUMULATE ADA - 5daySeems time to accumulate CRYPTO:ADAUSD if you are in the know about Cardano.
- Fisher Transform Indication bands need to align themselves.
- Price will bounce around tightly packed moving averages between .32 cents and .44 cents.
- Price breakout to occur early Aug to early September.
- Volume

ADA, CAN IT BE PART OF THE DIGITAL GOLDRUSH?ADA chart
RSI favorable on smaller charts, not so favorable on bigger charts.
Potential to see a dip and BIG run.
One support trend.
Buy zone marked
Price targets marked
Potential to see a wick down to 10 cents, but lots of potential to hold that sub 30 cent price.
I'd be patient, and see what h

ADA FractalThis is a fractal from over two months ago. It's pretty crazy how close it's been to what has transpired. I don't necessarily think it's going below 30 some cents, but the fractal definitely indicates a big drop coming. It will be interesting to see it play out. If you look back, it's been very

ADA Expanded Flat correction?I am short-term bearish on ADA because, in the 15-minute timeframe, I can see a bearish divergence on the RSI. I will wait to see how it plays out before entering into a long position.
I am sharing my thought process on these market moves and adjust my analysis as the market evolves. This is not

(ADA) CARDANO Strong signal indicating the price of Cardano is potentially heading upward. Variable exponential moving lines measured to create two lines that option the risk to favor a simple and direct approach to seeing a simulated trend ahead of time.

ADA prepre LONG position for waves 5ADA prepre LONG position for waves 5 and preprep next one position for long term LONG good LL. I prepre PPContracts. L.

See all ideas
Curated watchlists where ADAUSD.P is featured.

Crypto tokens: Chips and dips
24 No. of Symbols

Eco-friendly crypto tokens: Green cryptocurrencies
14 No. of Symbols

Gen 3 crypto: A new day dawns…
25 No. of Symbols

Proof of Stake: Seeking validation?
26 No. of Symbols

Smart contracts: Make the smart decision
36 No. of Symbols

Staking Coins: Pick up a stake
18 No. of Symbols

Top altcoins: Choose your alternatives carefully
28 No. of Symbols
See all sparks