GOLD CPI move, is this selling continuation pattern? or not??#GOLD CPI DAY
most important day of the week n month as well.
as we mentioned that from 4975 to 4990 that is most comfort region/zone for traders. mean there is no aggression in between that range.
But you will see when market clear that region for either side breakout.
and downside we have our most important region for downside breakout that is around 4905 to 4915 16
have a good day n good luck to all.
good luck
trade wisely
Tradingsignals

GOLD at support? what's next above 5051-52 ??#GOLD.. market just holds his current supporting area that was around 5051-52
and that will be our breakout area for downside as well.
so keep close and until market holds 5051-52 don't short with upside mentioned targets.
NOTE: we will go for cut n reverse below 5051-52 on confirmation.
good luck
trade wisely

TTWO Buy/LongTTWO with the release of GTA VI being released this year as promised by the CEO I pray to God for all of us to see $300+ minimum when it is released however this is the PERFECT buying opportunity for all traders and investors alike who wish to see massive growth in their portfolio. I strongly recommend purchasing TTWO as the stock has plummeted 20-22% just this last month alone with a very nice W pattern structure occurring to this as well it looks like it is about to go to the sky with my target profits being posted in the chart if you would like to study, analyze, and position yourself in. I am NOT setting a stop loss for this trade simply due to the fact I strongly believe in this company as I have cherished many of their games so have all of us in the past with strong titles such as GTA, Bully, RDR, Mafia, 2K, and many many other big IPs. This is something everyone will want to profit off on. Please send me a message if you have any concerns or opinions on my stock pick analysis as I will be posting much more diversified from FX, stocks, futures, crypto, and much more trading charts in the following weeks. God bless in Jesus name I pray for all of us to profit as much as possible from this market AMEN!

USDCAD H4 – Structure Is No Longer One-Sided📌 Market Context
USDCAD has transitioned out of a sustained bearish phase into a more complex H4 environment. The aggressive sell-side delivery has already done its job, and price is now operating within a rebalancing range rather than clean trend continuation.
Current Observation
The prior bearish structure was interrupted after downside objectives were met, followed by a meaningful reaction and internal realignment. Since then, price has been rotating between key levels, showing hesitation and selective participation instead of broad directional conviction. This is typical behavior when positioning replaces momentum.
🎯 Key Zones
🔴 Sell-side area:
1.37244 – 1.37433
Upper range pricing where prior imbalance and structure meet. Attention is on whether price is accepted or rejected here, as this zone sits above recent equilibrium.
SL: 1.38017
🟢 Buy-side reaction area:
1.34815 – 1.34617
Lower boundary of the current range and previous reaction base. If revisited, this area is observed for defensive behavior rather than immediate continuation.
SL: 1.34283
🧭 Forward Awareness
The focus now is on how price behaves between these boundaries. Acceptance above the upper zone or failure back into discount will reveal whether the market is preparing for expansion or remains in rotation. Until then, patience matters more than anticipation.
Market context only. Not a signal. Execution depends on live price behavior.

AUDUSD H4 – Price Has Reached Where Decisions Are MadeMarket Context
AUDUSD remains structurally bullish on H4, but price is no longer trading from value. The recent expansion leg respected the rising channel, delivering a clean push into higher prices where premium conditions are now in play. Momentum has slowed, suggesting positioning rather than continuation.
Current Observation
Price has already completed a full range expansion from the prior demand reaction, sweeping internal liquidity before reaching the upper boundary of the structure. The most recent high shows hesitation and rejection, indicating distribution rather than aggressive continuation. This is no longer an environment for chasing strength.
🎯 Key Zones
🔴 Sell-side interest:
0.71473 – 0.71653
Area aligned with premium pricing and prior reaction highs. Any interaction here is observed for distribution behavior, not impulsive breakout acceptance.
SL: 0.72057
🟢 Buy-side reaction area:
0.70117 – 0.70000
Discount zone within the broader bullish structure. Attention is on how price reacts if revisited, particularly after sell-side delivery.
SL: 0.69497
🧭 Forward Awareness
Experienced traders are watching for how price behaves around the premium zone — acceptance versus rejection will define the next phase. If downside develops, the focus shifts to whether the lower zone attracts responsive buying or signals deeper rebalancing within the range.
This is a contextual market note, not a trading signal. Execution depends on real-time behavior.

Broadcom Breaks Higher as AI Momentum BuildsBroadcom has delivered a strong performance over the past 12 months, with the share price up close to 50%. Since peaking on 9 December, however, AVGO has undergone a meaningful pullback.
From a technical perspective, that retracement has formed a bullish wedge, a classic continuation pattern. Encouragingly, the price has now broken out to the upside, short-term EMAs have turned supportive, and RSI has moved back above 50. As long as RSI holds above this level, momentum remains constructive and should continue to underpin price action. A sustained move back below 50 would weaken that outlook.
Classical charting theory suggests that flags tend to “fly at half mast”, implying a measured move higher. On a logarithmic basis, this points to an upside target around 475.
Fundamentally, Broadcom is gaining traction in AI infrastructure as demand accelerates for its tensor processing units, which offer a lower-cost alternative to Nvidia’s GPUs.
UBS estimates Broadcom will ship around 3.7 million TPUs this year, rising to more than five million by 2027. On these assumptions, AI-related revenue could reach roughly $60bn in 2026 and potentially exceed $100bn in 2027.
TPUs are materially cheaper than Nvidia’s latest chips and are particularly well suited to inference workloads, which are expected to account for the bulk of AI demand over the next five years. While Nvidia retains a clear advantage in training and is working to defend its position in inference, Broadcom’s expanding role in AI infrastructure provides solid fundamental support for the $475 technical target.

TheGrove | EURJPY Sell | Idea Trading AnalysisYou can expect a reaction on Descending channel, the direction of selling from the specified Resistance LINE,
EURJPY moving higher as it tests the strong resistance level..
We expect a bearish move from the confluence zone.
Hello Traders, here is the full analysis.
I think we can soon see more fall from this range! GOOD LUCK! Great SELL opportunity EURJPY
I still did my best and this is the most likely count for me at the moment.
-------------------
Traders, if you liked this idea or if you have your own opinion about it, write in the comments. I will be glad 🤝

XAUUSD – H4 Next possible moveToday is NFP day, so volatility will be high.
I personally avoid taking trades before the news release.
🔹 Resistance zone: 5050 – 5100
🔹 Key support / POI: 4900 – 4860
📈 Scenario 1 — Breakout
If Gold breaks and holds above the resistance after NFP, the next major target is 5300.
📉 Scenario 2 — Rejection
If price rejects the resistance, a buying opportunities is around 4900–4860 (key level + FVG).
⚠️ Always wait for confirmation before entering any trade.

Micron Technology - This was the last all time high!🍾Micron Technology ( NASDAQ:MU ) creates a textbook reversal:
🔎Analysis summary:
Micron Technology rallied an expected +500% over the past couple of months. But now, Micron Technology is totally overextended and ready for a correction. And with the current retest of the final resistance trendline, Micron Technology is just starting to reverse.
📝Levels to watch:
$400 and $200
SwingTraderPhil
SwingTrading.Simplified. | Investing.Simplified. | #LONGTERMVISION

EURCAD | Long PositionTook a long position here on EURCAD.
Looking for a nice bounce from the previous day low.
thinking we could see more upside this week from here
Let me know what you think!
This is not investment advise!


AUDNZD - Short Trade (Swing)AUDNZD - Short Trade (Swing)
1. Sentiment (Short > 90%)
2. Break of neckline after double top formation
3. Immediate Entry / Sell by Market
4. TP level ~ 50% Fib level
5. Trade at 1% of the account value

USDJPY - Short Trade (Swing)USDJPY - Short Trade (Swing)
1. Bearish Divergence
2. Short at break of previous Higher Low
Entry Point: 156.296
SL: 157.433
TP: 155.315
Account Size ~ 10,000
Lot Size ~ 0.3
Amount on Trade - USD 100 (1%)
Profit / Loss - 1:1

Bitcoin Could Fade Into Irrelevance in the Next Bear MarketIf you haven`t sold BTC recently:
Now you need to know that Bitcoin (BTC) has been trading in a corrective phase after failing to sustain above $100,000 earlier this year.
Strategy (formerly MicroStrategy), led by Michael Saylor, holds over 671,000 BTC – acquired at an average cost basis of approximately $74,972 per BTC.
The company's aggressive accumulation has been funded through a combination of convertible debt, equity issuance, and at-the-market offerings, creating significant leverage.While Saylor frames this as "Bitcoin yield," it amplifies downside risk.
A sustained drop below the ~$75K average cost basis would flip unrealized gains into losses, potentially triggering margin pressures on debt covenants, forced dilution to raise capital, or – in a worst-case spiral – partial liquidations to service obligations.
MSTR stock already trades as a highly correlated, leveraged proxy to Bitcoin (historical beta often 1.5x–2x). A
BTC breakdown below $74K could compress MSTR's premium to NAV dramatically, sparking retail and institutional selling.
This, in turn, would pressure Bitcoin further if Strategy is forced to slow purchases or (unlikely but possible in extreme scenarios) sell holdings.
This setup creates a classic self-fulfilling prophecy: bearish sentiment drives price lower → crosses key psychological/technical level at $74K → leverage unwind in the largest corporate holder → accelerated selling → deeper correction.
Technical Outlook: Path to Sub-$74KFrom a chart perspective: BTC has rejected the $100K–$126K highs and is forming lower highs.
Key support cluster sits around $80K–$82K (prior resistance turned support).
A break below $80K opens the door to $74K retest – aligning perfectly with Strategy's average cost.
Further downside targets: $70K (38.2% Fibonacci retracement of the 2024–2025 rally) and the $62K–$72K zone, a major demand area from mid-2025 consolidation.
Bear Case Target: Sub-$74K, potentially triggering the leverage feedback loop described above.
Buy Area: If we see capitulation, the $62K–$72K zone represents strong historical support and a potential accumulation range for long-term holders.
This area coincides with prior cycle highs and significant on-chain volume.

Gold (15m) – Bullish Continuation SetupPrice is holding above the prior demand zone after a strong impulsive move up. We’re seeing higher lows forming with NY session divergence acting as fuel, not weakness. This consolidation looks like a healthy pause before expansion.
The highlighted buy zone aligns with structure support and liquidity protection, while upside targets are mapped toward the 1.618 extension, where previous sell-side liquidity rests. As long as price holds above the base, bias remains bullish.
📈 Idea: Buy the dip → Hold structure → Target expansion
⚠️ Invalidation below demand zone
📌 Follow for real-time scalping & intraday signals
I share structure-based entries, liquidity targets, and risk-defined trades — no indicators, just price.
DM for more entries and professional help..

TheGrove | GBPJPY buy | Idea Trading AnalysisGBP/JPY is trading within a rising channel, with price holding above the Ascending Triangle after a clear bullish and is moving on Resistance area.
We expect a decline in the channel after testing the current level.
Hello Traders, here is the full analysis.
I think we can soon see more fall from this range! GOOD LUCK! Great SELL opportunity GBPJPY
I still did my best and this is the most likely count for me at the moment.
-------------------
Traders, if you liked this idea or if you have your own opinion about it, write in the comments. I will be glad ⚜️

Chart Breakdown (Scalping – Bullish Momentum)Price swept a weak high (equal highs / liquidity resting above), then delivered a sharp displacement to the downside. That move is not bearish continuation yet — it’s a liquidity grab + mitigation move.
Key observations:
Weak high taken → stop hunt completed
Strong bearish candle = sell-side liquidity run
Price reacts into a previous demand / discount zone (orange box)
Overall structure before the sweep was bullish & ranging, not trending down
This sets up a bullish scalping opportunity, not a chase sell.
🎯 Scalping Idea – Bullish Momentum Play
Bias: Short-term bullish (scalp)
Execution Logic:
Wait for price to hold above the demand zone
Look for lower timeframe confirmation (M1–M5):
BOS to the upside
Strong bullish engulf / displacement
Reclaim of intraday VWAP or equilibrium
Entry:
Long on confirmation from demand / discount
Targets:
First target: mid-range / VWAP
Extended target: liquidity above recent highs
Invalidation:
Clean break & acceptance below demand
This is a reaction-based scalp, not prediction.
🧠 Why This Works for Scalpers
Liquidity already cleared (cleaner upside)
Tight risk, fast reaction
Momentum-based, not hope-based
Ideal for London–NY overlap scalps
I don’t sell hype — I trade structure, liquidity, and timing.
If you want:
🔔 Real-time scalping signals
📊 Clean entries with clear invalidation
🧠 Liquidity-based execution (not indicators)
👉 Follow & trade with precision, not emotion
👉 Join my signals — let the chart do the talking

GOLD at breakout level? what's next above 4930-35??#GOLD.. market just reached near to current most importnat area of the day and week as well.
that is around 4930-35
keep close that area and only sustain above means again bounce to top otherwise not.
so stay sharp and stay with us.
NOTE : we will go for cut n reverse above 4930-35 on confirmation.
good luck
trade wisely

Bitcoin | Next ShortLooking to short bitcoin here from this zone for the next move down.
Would need to see a rejection first before entering.
Just following the trend, nice and easy.
What is your outlook on bitcoin?
Let me know!
Do your own due diligence, this is not investment advise!

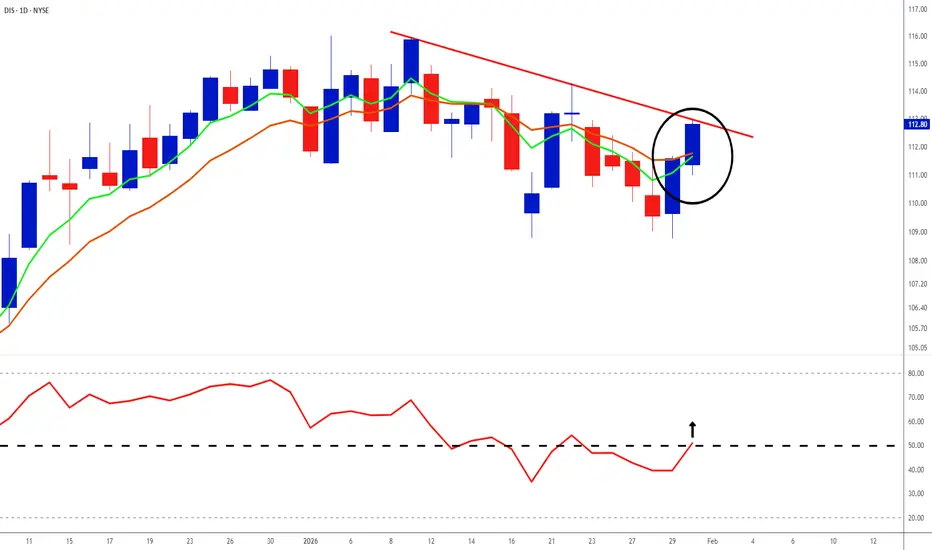
Disney Delivers a Solid Quarter as Technicals Look to ImproveDisney beat expectations in its fiscal first quarter, with revenue rising 5% to roughly $26bn and adjusted earnings supported by strong momentum in parks, resorts and cruises.
The Experiences segment topped $10bn in quarterly revenue for the first time, driven by solid growth at US parks, while international visitation remained softer.
Streaming continues to move toward profitability, with management guiding to around $500m in operating income next quarter. That said, sports margins were pressured by higher rights costs and a YouTube TV blackout.
Looking ahead, Disney plans a $7bn share buyback, is targeting double-digit adjusted earnings growth in 2026, and faces renewed scrutiny over succession planning once Bob Iger steps aside.
Technical view: Disney’s EMAs are converging and approaching a bullish crossover, which would strengthen the technical backdrop. The RSI has moved above the 50 level, signalling positive momentum. As long as the RSI holds above 50 and the EMAs maintain a bullish structure with improving slope and separation, the trend remains constructive. A sustained move back below 50 would negate this signal.
BITCOIN SCALP 78079.10Bitcoin looking to be buying and return to a fair level of value , reference the daily price for more clarity and trend bias

XAUUSD (H3) – Liam Weekly Open Plan
Structure has shifted | Early-week focus stays SELL on rallies
Quick summary
Gold has completed a sharp downside expansion after a prolonged bullish run, breaking the prior structure decisively. The current price action shows weak recovery attempts, suggesting the move lower is corrective-to-distributive rather than a completed reversal.
For the start of the week, the bias remains clear: sell the structure, not chase bounces.
Market structure
The previous uptrend has been fully disrupted by an impulsive sell-off.
Price is now trading below former support, which has flipped into resistance.
Current rebounds lack momentum and show characteristics of corrective pullbacks, not accumulation.
This keeps the market in a sell-on-rallies environment until proven otherwise.
Key technical zones
Primary sell FVG / resistance: 4970 – 5000
This zone aligns with imbalance and prior liquidity and is the preferred area for sell reactions.
Secondary sell FVG: 4795 – 4820
A lower reaction zone where price may stall before continuing lower.
Deeper liquidity target: 4340 – 4350
This remains the main downside objective if the structure continues to unwind.
Upper invalidation zone: 5300+
Acceptance above this area would force a reassessment of the bearish bias.
Early-week scenarios
Primary scenario – SELL rallies
As long as price remains capped below the 4970–5000 zone, any rebound should be treated as corrective. The expectation is for further downside continuation toward lower liquidity.
Secondary scenario – Deeper pullback
If price fails to reclaim the first sell zone cleanly, a slow grind lower into the 4795–4820 area may occur before continuation.
Reassessment condition
Only a strong reclaim and acceptance above 5300 would invalidate the current sell structure.
Key notes
Early-week price action often clears residual liquidity.
Avoid counter-trend longs inside resistance.
Let price come to the level, then execute.
Structure > opinion.
Weekly focus:
selling corrective rallies into FVG and resistance, or waiting for price to show a clear structural shift before changing bias.
— Liam

SELL Signal: XAU/USD (Gold Spot)
Entry: ~5,062 (bearish OB + FVG area)
SL: >5,096–5,104 (above OB/FVG invalidation or recent structure high)
TP1: 5,033–5,025 (prior low / BOS target)
TP2: 4,975–4,950 (deeper support / extension) Reason: Price in clear downtrend after BOS, now rejecting at bearish Order Block + 5M FVG (~5,056–5,101 shaded). Bearish structure + rejection wick → high-probability continuation lower. #Gold #XAUUSD #Trading #Bearish #OrderBlock #FVG #Downtrend #PreciousMetals Not financial advice. Trading involves high risk of loss. Always DYOR, use proper risk management, and never risk more than you can afford to lose.
