Volatility Period: October 16 (October 15-17)
Hello, traders!
Follow us to get the latest information quickly.
Have a great day!
-------------------------------------
(ETHUSDT 1D Chart)
Following BTC, ETH is also entering a volatility period.
This period of volatility for ETH is expected to last until October 16th (October 15th-17th).
After this period of volatility, the key question is whether the price can find support around 3900.72-4372.72 and rise above 4403.87 to maintain its price.
If the price fails to rise, it is expected to encounter the M-Signal indicator on the 1M chart, so a response plan should be considered.
-
(1M chart)
The StochRSI indicator on the 1M chart is entering an overbought zone, potentially limiting its upward movement.
Therefore,
1st: 3900.73-4107.80
2nd: 3321.30-3438.16
We need to determine whether the price can rise after finding support near the 1st and 2nd levels above.
In other words, we need to see if the price remains above the M-Siganl indicator on the 1M chart.
-
(1W chart)
Looking at the 1W chart, the HA-High ~ DOM (60) range is formed in the 4393.04-4780.15 range. Therefore, a rise above this range is necessary for a stepwise uptrend.
Ultimately, the key question is whether the price can rise above the 4393.04-4780.15 range.
----------------------------------
Therefore, the key question is whether the 4393.04-4780.15 range, which corresponds to the HA-High ~ DOM(60) range on the 1W and 1D charts, can rise after this period of volatility.
As I always say, to break above this important point or range and continue the uptrend,
1. The StochRSI indicator must be trending upward. If possible, it's best to avoid entering the overbought zone.
2. The On-By-Sign-Observable (OBV) indicator must be trending upward. If possible, it should remain above the High Line.
3. The TC (Trend Check) indicator must be trending upward. If possible, it should remain above the 0 level.
If the above conditions are met, the uptrend is likely to continue.
It's recommended to draw support and resistance points or ranges on the 1M, 1W, and 1D charts and utilize auxiliary indicators to determine the significance of these points or ranges.
When drawing support and resistance points or zones, we often think of them as important, but it can be difficult to recognize how important they actually are.
Therefore, when drawing support and resistance points or zones, it's important to be able to develop a basic trading strategy.
Once you've established a basic trading strategy, the key to trading is figuring out how to maintain that strategy and respond accordingly.
No matter what chart analysis you use, you'll ultimately need to draw support and resistance points or zones.
Therefore, the first step is to draw support and resistance points or zones on the 1M, 1W, and 1D charts.
Next, you should check auxiliary indicators to determine the importance of the drawn support and resistance points or zones and determine whether you should respond.
To achieve this, you need to understand your investment size and how to manage your reserve funds.
You should always keep a certain portion (approximately 20%) of your total investment in cash.
This allows you to respond to volatility when it occurs.
If you've invested too much money in a single coin (token, stock), it's a good idea to sell some of it when the price rises to a certain level and secure cash.
Ultimately, overcoming the relentless volatility of the beginning and achieving profit depends on how you manage your funds.
-
Thank you for reading to the end.
I wish you successful trading.
--------------------------------------------------
Tradingstrategy
Support around 212.91 is crucial
Hello, fellow traders.
By "Following," you'll always get the latest information quickly. Have a great day today.
-------------------------------------
(SOLUSDT 1W Chart)
The chart may look complicated due to the drawn lines, but the key is whether the price can rise above the boxed area.
In other words, whether the price can rise above the 179.53-237.60 range and maintain its upward momentum is crucial.
-
(1D Chart)
The HA-Low indicator on the 1D chart is showing signs of forming at the 212.91 level.
Therefore, if support is confirmed around 212.91, it would be a good time to buy.
However, the HA-High ~ DOM (60) range has formed in the 236.88-237.60 range, so we need to see if it can break above this range.
If the upward breakout fails, it's time for a partial sell-off.
-
To continue the uptrend by breaking above a key zone or point,
1. The StochRSI indicator must be trending upward. If possible, it should be below the overbought level.
2. The On-By-Value (OBV) indicator must be trending upward. If possible, it should remain above the High Line.
3. The TC (Trend Check) indicator must be trending upward. If possible, it should remain above the 0 level.
If the above conditions are met, the uptrend is likely to continue.
-
Thank you for reading to the end.
I wish you successful trading.
--------------------------------------------------

Next volatility period: Around October 23rd (October 22nd-24th)
Hello, traders!
By "Following," you can always get the latest information quickly.
Have a nice day today.
-------------------------------------
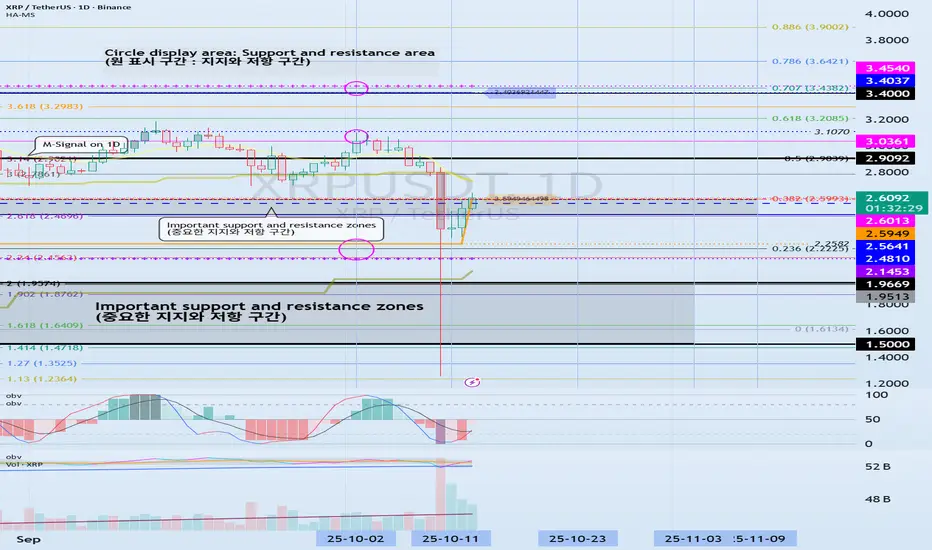
(XRPUSDT 1D Chart)
After this period of volatility, the HA-Low indicator on the 1D chart is forming at the 2.5949 level.
Therefore, if the HA-Low indicator forms at the 2.5949 level, it will be important to determine whether support is found near that level.
Furthermore, the HA-High indicator on the 1M chart is forming at the 2.4810 level.
Therefore, the key question is whether the price can find support and rise near the important support and resistance levels of the left Fibonacci ratio (2.618 (2.4696)) and the right Fibonacci ratio (0.382 (2.5993)).
However, to continue the step-up trend, the price must rise above 3.4037-3.4540 and hold, so you should also consider a countermeasure.
-
The basic trading strategy is to buy in the DOM(-60) ~ HA-Low range and sell in the HA-High ~ DOM(60) range.
However, if the price rises in the HA-High ~ DOM(60) range, a step-up trend is likely, while if the price falls in the DOM(-60) ~ HA-Low range, a step-down trend is likely.
Therefore, the basic trading strategy should be a segmented trading strategy.
Currently, the HA-Low indicator is showing signs of forming, so if support is confirmed near the HA-Low indicator, it would be a good time to buy.
From a medium- to long-term perspective, if the price holds above the 1.5-1.9669 range, the upward trend is likely to continue.
-
Thank you for reading to the end. I wish you successful trading.
--------------------------------------------------
INUSDT: short setup from daily support at 0.16050Note that the current setup BINANCE:INUSDT.P is rather localized.
However, the overall trend in the asset remains clear — a consistent dump pattern of “drop — pause — further decline.”
A solid pre-breakdown base is forming, providing an opportunity for a tight and well-defined stop placement.
Key factors for this scenario:
Global & local trend alignment
Price void / low liquidity zone beyond level
Correlation with the market
Volatility contraction on approach
Immediate retest
Closing near the level
Was this analysis helpful? Leave your thoughts in the comments and follow to see more.
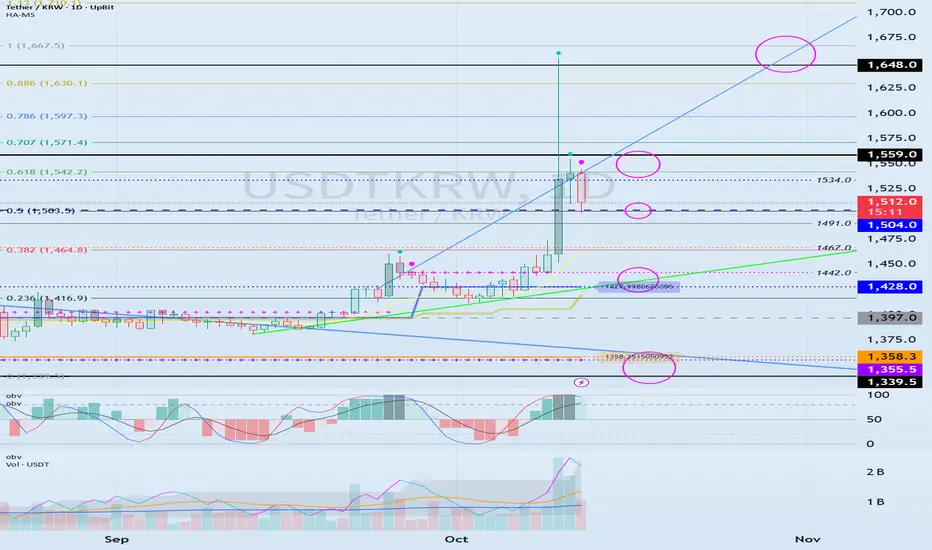
The key is whether it can fall below 1504.0
Hello, fellow traders!
Follow us to get the latest information quickly.
Have a great day.
-------------------------------------
(USDTKRW 1D chart)
Important support and resistance levels are marked with circles.
The key is whether it can fall below 1504.0.
Next, we need to see if it falls below the 1428.0-1442.0 range.
If it fails to fall, it is likely to rise along the uptrend line.
-
Thank you for reading to the end.
I wish you successful trading.
--------------------------------------------------
This year's target: Around 133889.92
Hello, traders!
Follow me to get the latest information quickly.
Have a great day.
-------------------------------------
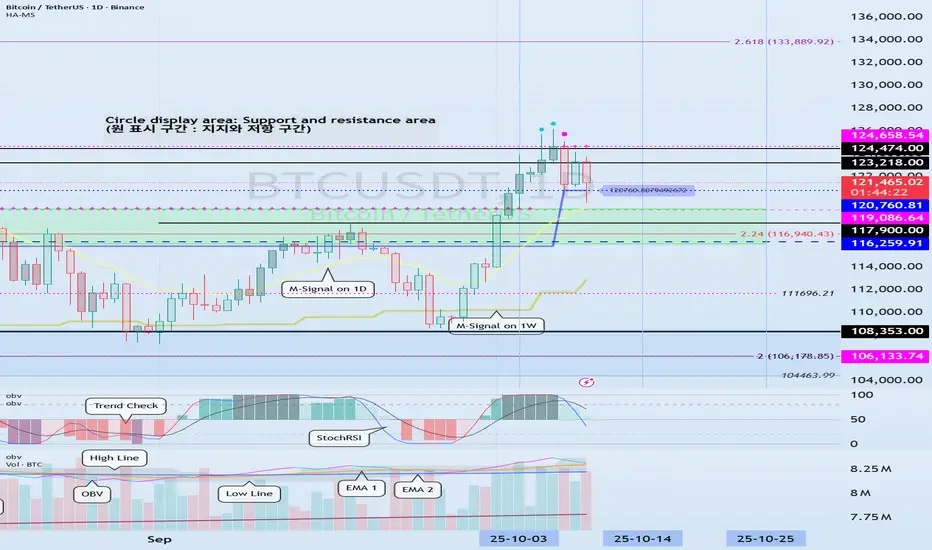
(BTCUSDT 1W chart)
The price has been rising above the HA-High indicator, forming a step-up trend.
You can see that the upward movement of the step-up trend is slowing down.
The key question is whether the price can rise above the right Fibonacci level 2.618 (133889.92), which is considered this year's target.
If it shows further upward movement, it could rise to around the right Fibonacci level 3 (151018.77).
Even so, it must ultimately break above the HA-High ~ DOM (60) range on the 1W chart. Therefore, we need to see if the price can rise above the 116259.91-119086.64 range and maintain its upward momentum.
If it fails to rise, it will eventually touch the M-Signal indicator on the 1M chart again.
From a long-term perspective, the price must remain above the 69000-73499.86 level to maintain the uptrend.
Therefore, we must first confirm support near the first, second, and third levels.
-
(1D chart)
The 116259.91-119086.64 range is the resistance zone on the 1W chart.
If the price rises above this range, the 120760.81-124658.54 range, which is the resistance zone on the 1D chart, awaits.
Therefore, the 116529.91-124658.54 range should ultimately be considered the resistance zone.
To determine whether this range is important, you should examine the movements of auxiliary indicators such as StochRSI, On-By-Signal (OBV), and TC (Trend Check).
To break above this important range and continue the uptrend,
1. The StochRSI indicator must be trending upward. Ideally, it should not be in the overbought zone.
2. The On-By-Signal (OBV) indicator must be trending upward. If possible, it should remain above the High Line.
3. The TC (Trend Check) indicator should show an upward trend. If possible, it should remain above the 0 level.
It's important to meet the above conditions when breaking above the resistance zone of 116529.91-124658.54.
If not, there's a high chance of failing to break above the resistance zone.
-----------------------------------------------------
The HA-Low and HA-High indicators included in this chart are designed for trading on Heikin-Ashi charts.
Therefore, a basic trading strategy can be utilized: buy near the DOM (-60) ~ HA-Low range and sell near the HA-High ~ DOM (60) range.
However, if the price rises from the HA-High to DOM(60) range, it is likely to exhibit a step-like upward trend. If the price falls from the DOM(-60) to HA-Low range, it is likely to exhibit a step-like downward trend.
Therefore, the basic trading strategy should be a segmented trading approach.
We can see that the HA-High to DOM(60) range, i.e., the resistance zone, is likely to form, and then a pullback is likely to occur as it attempts to break above it.
Auxiliary indicators (StochRSI, OBV, TC) indicate the strength needed to rise again from a pullback, or a downward trend.
Although the 110644.40 level still serves as weak support, the DOM(-60) level has been identified.
For the 110644.40 level to function as support, it must hold for at least three days.
Therefore, during this period of volatility, we need to monitor whether the DOM (-60) indicator holds at 110644.40 after October 14th (October 13th-15th).
This is because if the price fails to break above the resistance zone of 116259.91-124658.54, the 110644.40 level could serve as support.
-
I believe the bull market is likely to continue until this year.
If it rises further, the upward trend could continue through the first quarter of 2026.
However, a major bear market is expected in 2026.
Therefore, we need to finish the year on a good note.
-
Thank you for reading.
I wish you successful trading.
--------------------------------------------------
- This is an explanation of the big picture.
(3-year bull market, 1-year bear market pattern)
I will explain in more detail when the bear market begins.
------------------------------------------------------

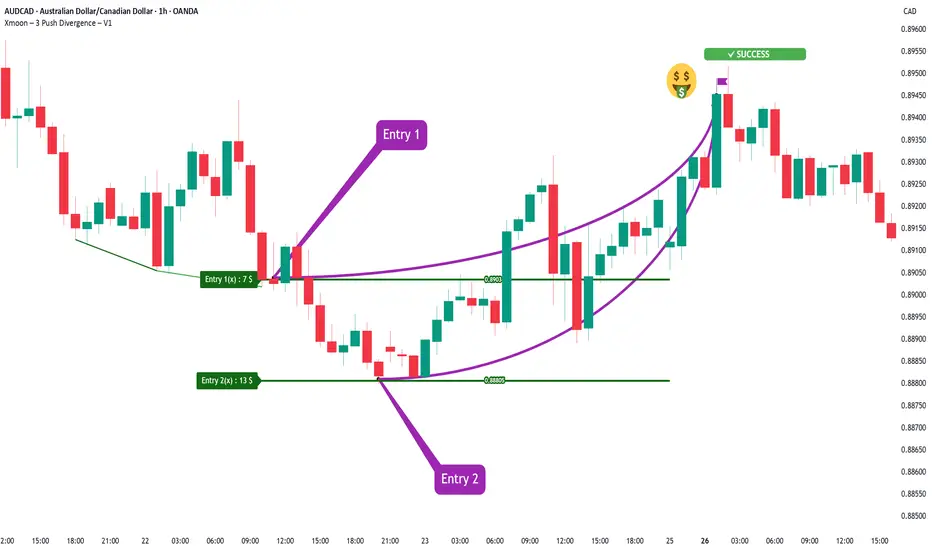
Xmoon Indicator Tutorial – Part 3 – Step Entry (DCA Entry)📘 Xmoon Indicator Tutorial – Part 3
🎯 Step Entry (DCA Entry)
Step-by-step entry, also known as DCA (Dollar Cost Averaging), is one of the key parts of the Xmoon – 3 Push Divergence strategy.
🔹 Why is it important?
After a 3 Push Divergence pattern appears, the market usually doesn’t reverse immediately.
It often moves a bit further in the same direction before turning back.
If we put all our capital in at once, the risk of liquidation increases.
🔹 The solution
We split the capital into several parts and enter the market step by step:
✦ If the market doesn’t reverse from Entry 1 , the chance of reversal at Entry 2 is higher
✦ If it doesn’t reverse from Entry 2, the chance at Entry 3 increases even more
✦ And so on — with each new step, the probability of reversal grows
Benefits of step entries:
✅ Lower overall risk
✅ Higher win rate
✅ Positions reach the Risk Free point faster
📣 If you have any questions or need guidance, feel free to ask us. We’d be happy to help.
Understanding the Money Flow in the Coin Market
Hello, fellow traders!
Follow me to get the latest information quickly.
Have a great day!
-------------------------------------
(USDT 1D Chart)
(USDC 1D Chart)
I believe that USDT and USDC show a gap up trend when funds flow into the coin market, and a gap down trend when funds flow out.
Therefore, unless the gap turns into a downtrend, the coin market is expected to maintain its upward trend.
-
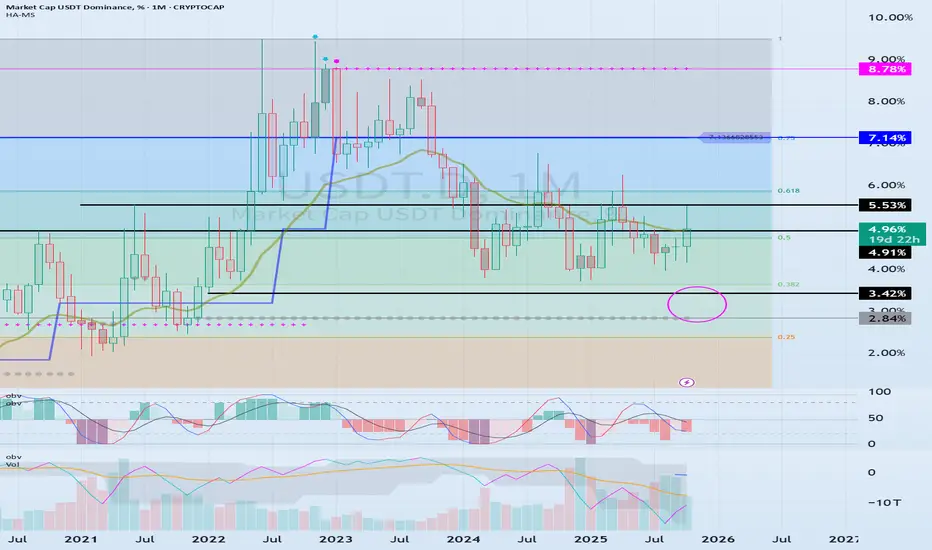
(USDT.D 1D Chart)
(1M Chart)
As funds flow into and out of the coin market through USDT and USDC, USDT dominance is likely to ultimately rise.
However, I believe that the funds (USDT, USDC) flowing into the coin market will change dominance through trading.
In other words, if USDT dominance declines, the coin market is likely to trend upward.
This is because coins (tokens) are being purchased with USDT.
If USDT dominance remains below 4.91 or declines, the coin market is likely to trend upward.
Therefore, if USDT dominance rises without any evidence of fund outflows through USDT or USDC, it can be interpreted as a temporary increase in selling pressure.
If USDT or USDC gaps downward in this situation, the price will fail to defend, leading to a downward trend in the coin market.
Therefore, it's best to look at the USDT and USDT.D charts to understand the general flow of funds.
-
(BTC.D 1D chart)
(1M chart)
I believe BTC dominance reflects the relationship with altcoins, rather than the rise or fall of the coin market or the rise and fall of BTC itself.
In other words, rising BTC dominance indicates a concentration of funds toward BTC, increasing the likelihood that altcoins will gradually move sideways or experience a downward trend.
Therefore, for an altcoin bull market to begin, it must remain below 55.01-62.47 or show a downward trend.
Therefore, it is recommended to check BTC dominance before trading altcoins and develop a trading strategy.
--------------------------------------------------
Summary of the above:
For the coin market to continue its bull market,
1. USDT and USDC must maintain a gaping upward trend.
2. USDT dominance should decline below 4.91.
3. BTC dominance should decline below 55.01.
-
Thank you for reading.
I wish you successful trading.
--------------------------------------------------
Support at the 4403.87-4749.30 range is key
Hello, fellow traders!
Follow us to get the latest information quickly.
Have a great day!
-------------------------------------
(ETHUSDT 1D chart)
This period of volatility is expected to last until October 5th.
Accordingly, the key question is whether support can be found around 4403.87 and whether it can rise above 4749.30.
If the price fails to rise,
1st: 3900.73-4107.80
2nd: 3239.06-3438.16
3rd: 2419.83-2706.15
We need to check whether support is found around the 1st-3rd levels above.
-
To break above a key point or range and continue the uptrend,
- The StochRSI indicator must be trending upward. If possible, it's best to avoid entering the overbought zone.
- The On-By-Sign Volume indicator must be trending upward. If possible, it should remain above the High Line.
- The TC (Trend Check) indicator must be trending upward. If possible, it should remain above the 0 level.
You should determine whether the above conditions are met at critical points or ranges and consider a response plan accordingly.
Currently, the StochRSI, OBV, and TC indicators are all showing an upward trend, so we believe the key point of 4403.87 has been broken upward.
However, to sustain this upward trend, the OBV indicator must rise above its High Line, and the StochRSI and TC indicators must maintain their current trend.
Therefore, we can see that support around 4403.87 is crucial.
-
The 4403.87-4749.30 range corresponds to the HA-High ~ DOM (60) range.
If this level is broken upward, a stepwise uptrend is likely, but it is likely to act as resistance.
Therefore, as mentioned earlier, determining whether the conditions for an upward breakout of a critical point or range are met will help you decide how to proceed with your trade.
-
Thank you for reading to the end. I wish you successful trading.
--------------------------------------------------

The key is whether the upward trajectory can continue
Hello, fellow traders.
If you "Follow," you'll always get the latest information quickly.
Have a great day.
-------------------------------------
(BTCUSDT 1D chart)
The price rose after forming a DOM(-60) ~ HA-Low range, and is now forming a HA-High ~ DOM(60) range, showing a upward trajectory.
Trend-wise, a decline below the M-Signal indicator on the 1W chart is likely to initiate a downtrend, and a decline below the M-Signal indicator on the 1M chart is expected to initiate a downtrend.
Therefore, when the price falls to the HA-High ~ DOM (60) range, it's important to identify support and resistance levels formed at the M-Signal indicator on the 1W chart.
-
Therefore, it's important to maintain the price above the 116259.91-119086.64 range.
The next important range is the 104463.99-108353.0 range.
-
To break above these key levels or ranges,
- The StochRSI indicator must be trending upward. If possible, it's best to avoid entering the overbought zone.
- The On-By-Signal (OBV) indicator must be trending upward. If possible, it should remain above the High Line.
- The TC (Trend Check) indicator should show an upward trend. If possible, it should remain above the 0 level.
If the above conditions are met, an upward breakout of the HA-High ~ DOM (60) range is expected.
The next period of volatility is expected around October 14th (October 13th-15th).
-
Thank you for reading to the end.
I wish you successful trading.
--------------------------------------------------
- This is an explanation of the big picture.
(3-year bull market, 1-year bear market pattern)
I will explain in more detail when the bear market begins.
------------------------------------------------------
BTCToday, BINANCE:BTCUSDT.P dropped by around 17%. It may fall further, or it may not — but one thing I know for sure: market panic has always been my most profitable time. When fear dominates and the entire market is crashing, that’s when the best opportunities appear.
If you panic — you’re far from professionalism. If you enter, take your profit, and calmly move on — that’s a sign of skill. In trading, professionalism isn’t optional; without it, you won’t survive — and sometimes that’s quite literal.
So, in times like these — when some made quick profits, others took heavy losses, and only a few truly gained — I’ll share a thought that changed my mindset years ago. After losing a significant amount, I realized that was the true cost of the trading education I once wanted to buy.
Trade with minimal risk and invest the rest in your learning — it’s always the right investment.
And just to be clear — I don’t sell courses, and this message isn’t for profit.
It’s genuine advice. Have a great day.

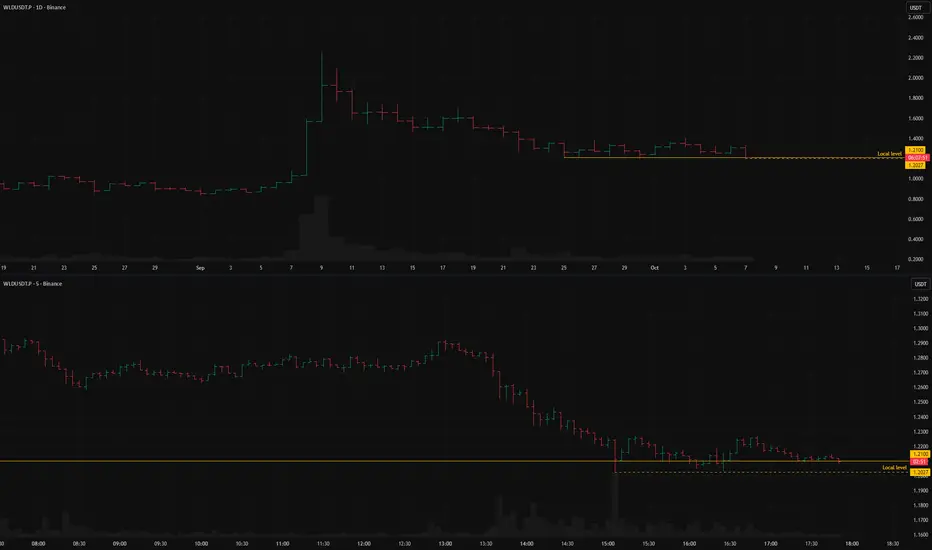
WLDUSDT.P: short setup from daily support at 1.2027While altcoins were rallying and BTC was attempting to break its all-time high, BINANCE:WLDUSDT.P just stood in consolidation, which is a sign of weakness. In my opinion, an asset that has come from above and entered consolidation will continue its move down.
I am providing the analysis now because I see a good pre-breakout base, which I interpret as a readiness for a breakdown.
And although this base is essentially "chopping" the main level (which I usually don't work with), in this case, it has formed a clear local support level just below it: two previous drops stopped at the exact same price point.
This allows me to use this specific local level as a basis to work from.
Key factors for this scenario:
Price void / low liquidity zone beyond level
Asset decoupled from the market (relative strength/weakness vs. BTC)
Volatility contraction on approach
Prolonged consolidation
Repeated precise tests of the level
Factors that contradict this scenario:
Exhaustive move (approaching from afar)
Closing far from the level
Was this analysis helpful? Leave your thoughts in the comments and follow to see more.
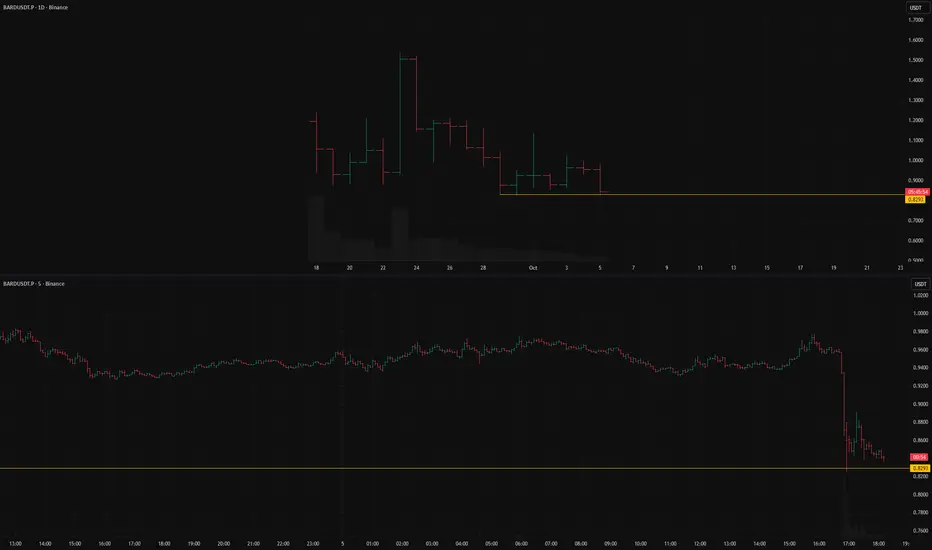
BARDUSDT.P short setup from daily support at 0.8293BINANCE:BARDUSDT.P has cleanly tested the 0.8293 level.
This level is the All-Time Low, which was the stopping point of the drop from the All-Time High.
There is a high probability that we will next see a consolidation followed by a breakdown of this level.
I really like these kinds of setups.
Key factors for this scenario:
Global & local trend alignment
Price void / low liquidity zone beyond level
Volatility contraction on approach
Momentum stall at the level
Immediate retest
No reaction after a false break
Was this analysis helpful? Leave your thoughts in the comments and follow to see more.
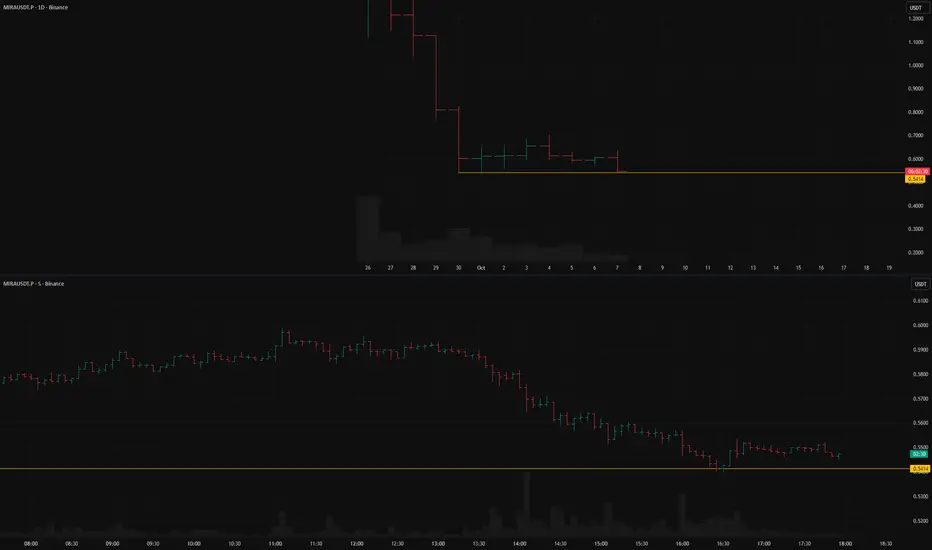
MIRAUSDT.P short setup from daily support at 0.5414BINANCE:MIRAUSDT.P is at its all-time low.
Against the backdrop of a positive market, the asset just stayed in consolidation, not even attempting to rally, which indicates its relative weakness.
Therefore, I am expecting a short from the clear and confirmed level of 0.5414.
Recently, a false breakout occurred, but there is still no proper reaction to it. Usually, the market reacts with a bounce, which would indicate the level is being defended. Instead, I'm seeing only a weak pullback and continued consolidation right above the level, which suggests a higher probability of a breakdown.
Key factors for this scenario:
Global & local trend alignment
Price void / low liquidity zone beyond level
Asset decoupled from the market (relative strength/weakness vs. BTC)
Volatility contraction on approach
Prolonged consolidation
Factors that contradict this scenario:
Closing far from the level
Was this analysis helpful? Leave your thoughts in the comments and follow to see more.
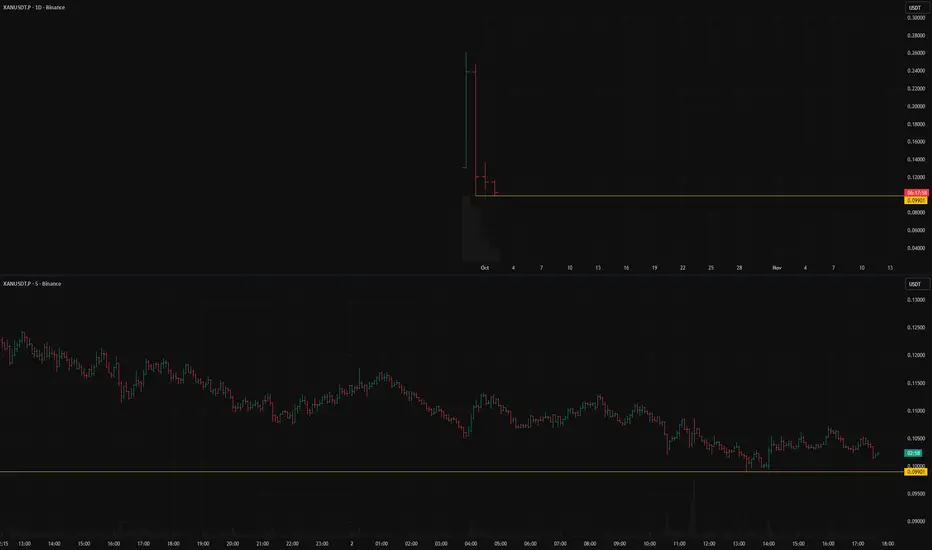
XANUSDT.P: short setup from daily support at 0.0990BINANCE:XANUSDT.P is at its all-time low.
The price recently tested this level cleanly, which confirms its relevance.
All that remains is to wait for one's own entry point.
Key factors for this scenario
Global & local trend alignment
Price void / low liquidity zone beyond level
Asset decoupled from the market (relative strength/weakness vs. BTC)
Volatility contraction on approach
Immediate retest
No reaction after a false break
Was this analysis helpful? Leave your thoughts in the comments and follow to see more.
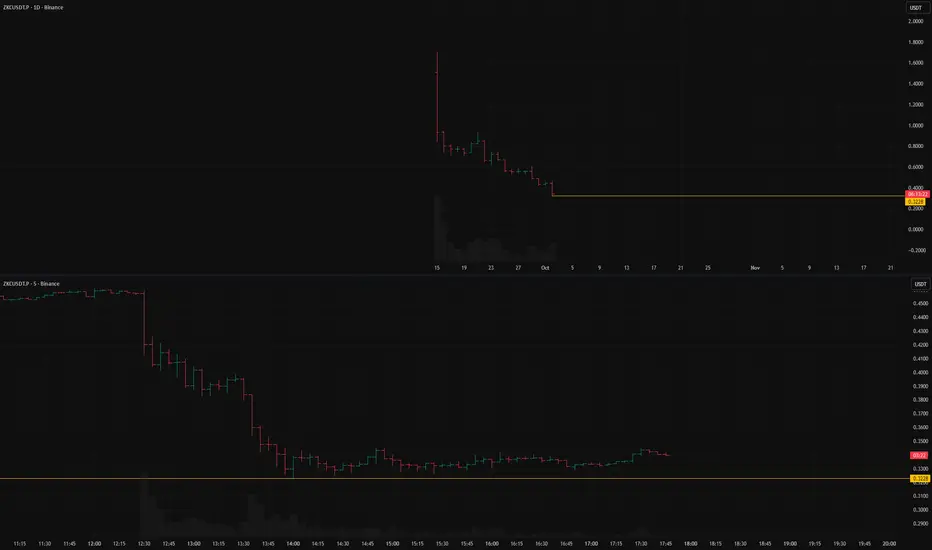
ZKCUSDT: short setup from daily support at 0.3228BINANCE:ZKCUSDT.P has been falling almost continuously since its listing, with short pauses.
Right now, after another downward impulse, I see a pause. This consolidation could last for a day or for several—it's impossible to predict.
However, a clear tendency is visible on the chart: drop → consolidation → drop.
Key factors for this scenario
Global & local trend alignment
Price void / low liquidity zone beyond level
Asset decoupled from the market (relative strength/weakness vs. BTC)
Was this analysis helpful? Leave your thoughts in the comments and follow to see more.
EURUSD Daily Analysis and Forecasts - Oct 6, 2025EURUSD
Trend: Neutral/Upward
Support/Resistance: 1.1710 - 1.1760
The U.S. government shutdown has effectively paused most official economic reporting, leaving the markets without fresh macroeconomic data from the United States. This lack of input is expected to limit volatility in the early part of the week, as traders focus instead on developments from the Eurozone.
Key data on Monday will include Eurozone Retail Sales at 9:00 AM GMT and ECB President Lagarde’s speech at 17:00 GMT. Both events could provide short-term direction for the euro, but until then, the market is likely to remain range-bound.
According to World-Signals, EUR/USD is expected to trade within the range of 1.1710 to 1.1760 throughout most of Monday. A breakout above or below these levels could trigger stronger momentum in the corresponding direction.
At this stage, the probability of an upside breakout above 1.1760 remains slightly higher, reflecting underlying euro resilience amid the U.S. political uncertainty. However, as long as the pair stays inside the defined range, intraday strategies should favor buying near the lower bound and selling near the upper bound.

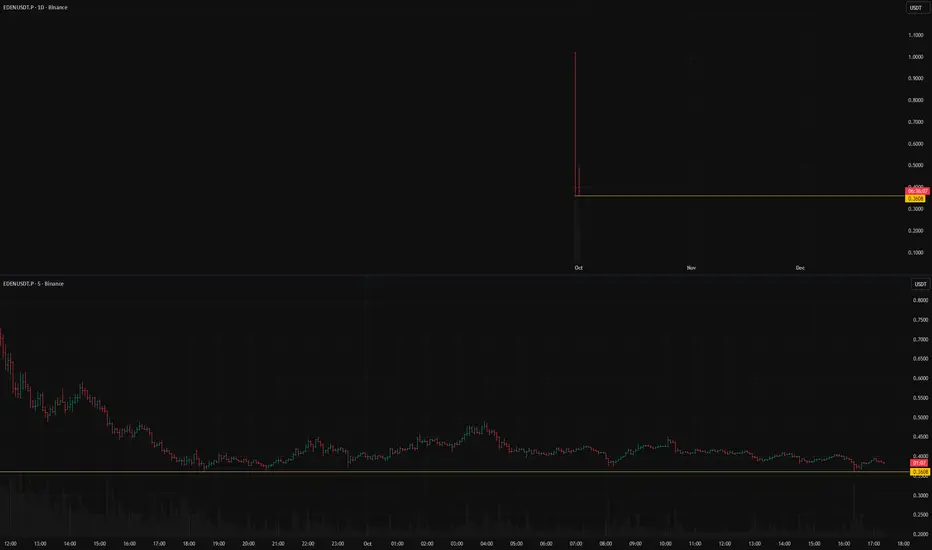
EDENUSDT.P short setup from daily support at 0.3608After its listing, BINANCE:EDENUSDT.P has been moving down and has currently stopped at a level that has already been clearly confirmed.
At the moment, we have a combination of favorable factors for a short: a downtrend, an absence of strong buyers, good volatility, and consolidation.
All that remains is to wait for YOUR OWN entry point according to your trading system.
An important condition is that volatility does not increase as the price approaches the level.
Key factors for this scenario
Global & local trend alignment
Price void / low liquidity zone beyond level
Volatility contraction on approach
Prolonged consolidation
Was this analysis helpful? Leave your thoughts in the comments and follow to see more.
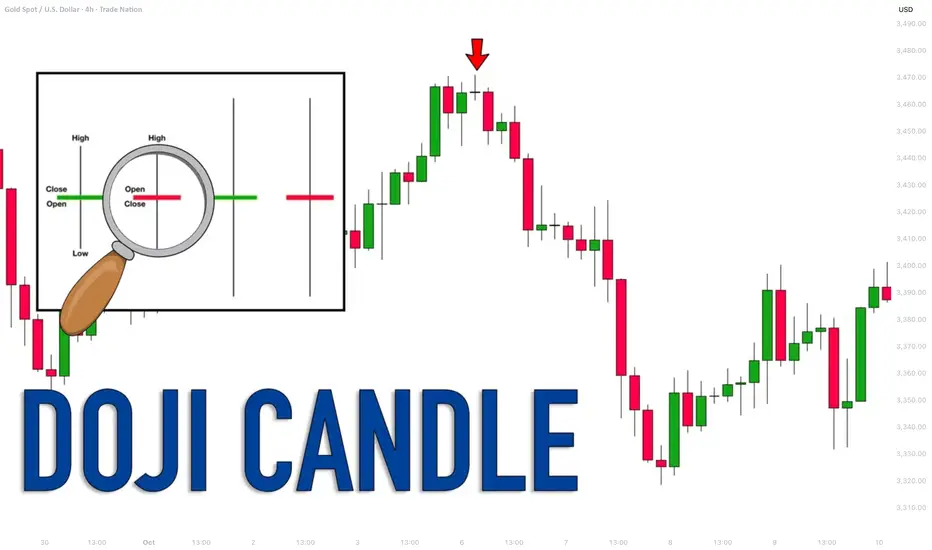
Learn Profitable Doji Candle Trading Strategy (GOLD, FOREX)
In the today's post, I will share my Doji Candle trading strategy.
This strategy combines the elements of multiple time frame analysis, price action and key levels.
Step 1
Analyze key levels on a daily time frame.
Identify vertical and horizontal supports and resistances.
Here are the key structures that I spotted on AUDUSD.
Step 2
Look for a formation Doji Candle on a key structure.
This rule is crucially important: we will trade only the Doji candles that are formed on key levels.
From key supports , we will look for buying , and we will look for shorting from key resistances .
Look at this Doji Candle that was formed on a key daily support on AUDUSD.
Step 3
Look for a horizontal range on a 4h/1h time frames.
Doji Candle signifies indecision . Quite often, you will notice the horizontal ranges on lower time frames when this candlestick is formed.
Here is a horizontal range that was formed on a 4H time frame on AUDUSD after a formation of Doji.
Step 4
Look for a breakout of the range.
To sell from a key resistance, we will need a bearish breakout of the support of the range. That will be our bearish confirmation.
To buy from a key support, we will need a bullish breakout of the resistance of the range. It will be our bullish signal.
Here is a confirmed breakout of the resistance of the range with a 4H candle close above. That is our bullish confirmation on AUDUSD.
Step 5
Buy aggressively or on a retest.
After you spotted a confirmed breakout of the range, open a trading position aggressively or on a retest.
Personally, I prefer trading on a retest.
If you sell, a stop loss should be above the high of the range and your target should be the closest key daily support.
If you buy, your stop loss should be below the low of the range and a take profit will be on the closest daily resistance.
On AUDUSD, a long position was opened on a retest. Stop loss is lying below the lows. Take profit is the closest resistance.
Here is how this great strategy works!
Always patiently wait for a confirmation! That is your key to successful trading Doji Candle.
❤️Please, support my work with like, thank you!❤️
I am part of Trade Nation's Influencer program and receive a monthly fee for using their TradingView charts in my analysis.
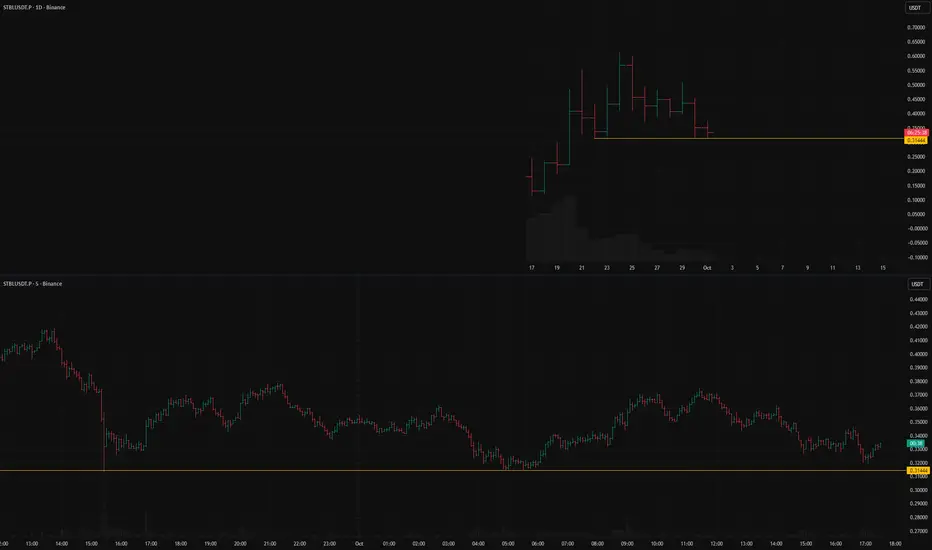
STBLUSDT.P short setup from daily support at 0.31444For the second day in a row, BINANCE:STBLUSDT.P is confirming the strength of the level with clean tests.
Below this level, there are no nearby obstacles that could complicate the asset's fall.
Therefore, it is worth waiting for your own entry point, while carefully monitoring the volatility, as always.
Key factors for this scenario
Price void / low liquidity zone beyond level
Volatility contraction on approach
Immediate retest
Prolonged consolidation
Repeated precise tests of the level
Was this analysis helpful? Leave your thoughts in the comments and follow to see more.
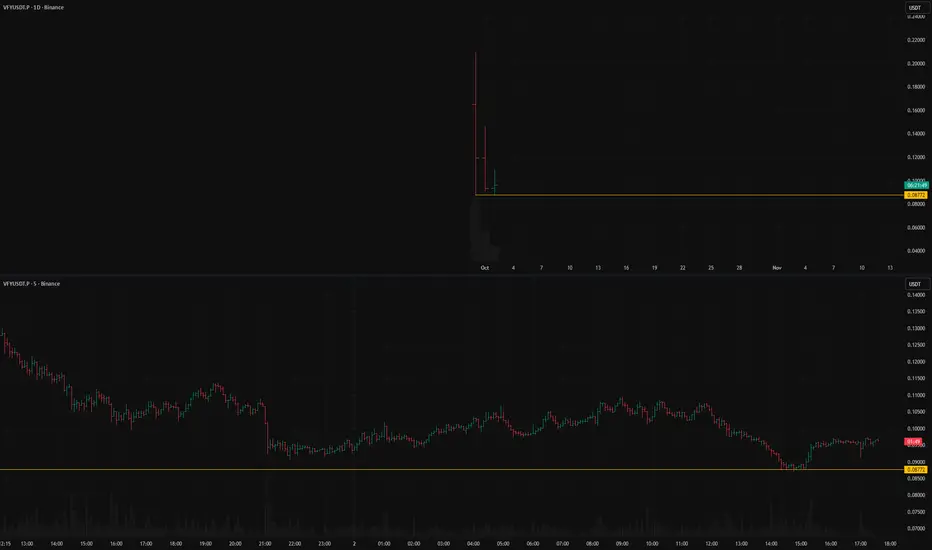
VFYUSDT.P: short setup from daily support at 0.08772BINANCE:VFYUSDT.P has a strong level—its All-Time Low.
Below it, there are no support levels that could slow the decline, so the fall could be very sharp.
Today, there was a good test of the level: the price came right up to it, consolidated on low volatility, confirming it cleanly, and then made a weak pullback.
This weak pullback signals an absence of buyers who might "save" the asset, which is why there could be a good short opportunity here.
Key factors for this scenario
Global & local trend
Price void / low liquidity zone beyond level
Asset decoupled from the market (relative strength/weakness vs. BTC)
Volatility contraction on approach
Immediate retest
Prolonged consolidation
No reaction after a false break Was this analysis helpful? Leave your thoughts in the comments and follow to see more.
Next Volatility Period: Around October 14th
Hello, traders!
Follow us to get the latest information quickly.
Have a great day!
-------------------------------------
(BTCUSDT 1D Chart)
This volatility period is expected to last until October 4th.
Accordingly, the key question is whether it can find support near 119,177.56 and rise.
If not, and the price declines, support near 115,854.56 will be crucial.
If it finds support near 119,177.56 and rises, it is expected to challenge the Fibonacci ratio of 2.618 (133,889.92).
The key areas for maintaining an uptrend are:
- Short-term: 115,854.56-119,177.56,
- Medium-term: 104,463.99-108,353.0,
- Long-term: 87,814.27-93,570.28.
-
Thank you for reading.
We wish you successful trading.
--------------------------------------------------
- Here's an explanation of the big picture.
(3-year bull market, 1-year bear market pattern)
I'll explain more in detail when the bear market begins.
------------------------------------------------------

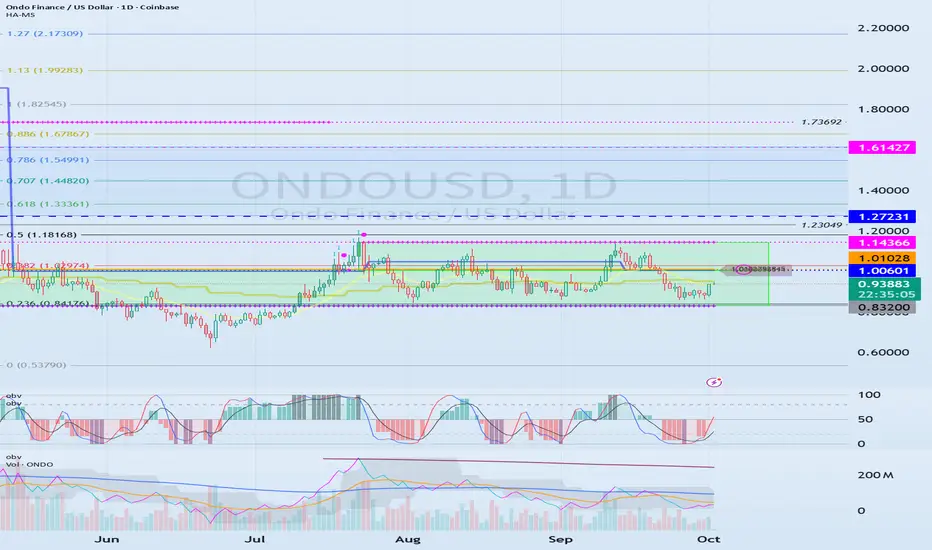
The key is whether support is found at 1.00601-1.01028
Hello, traders. Nice to meet you.
If you "Follow," you'll always get the latest information quickly.
Have a great day.
-------------------------------------
(ONDOUSDT 1W Chart)
The key is whether the price can find support near 0.832 and rise above the M-Signal indicator on the 1W chart.
The resistance zone is 1.27231-1.61427.
If it falls below 0.832, you should stop trading and wait and see how things go.
-
(1D Chart)
The key is whether the price can rise above the 1.00601-1.14366 range, which is the HA-Low and HA-High indicators.
The HA-High ~ DOM (60) range is formed within the 1.00601-1.14366 range, so if this range breaks upward, a step-up trend is likely.
However, the resistance zone on the 1W chart is located at 1.27231-1.61427, so the trend will ultimately be determined by whether support is found within this range.
What we can do is buy in the 0.832-1.14366 range and sell in the 1.27231-1.61427 range.
The reference range for buying is 1.00601-1.01028.
-
Thank you for reading.
We wish you successful trading.
--------------------------------------------------