Support and Resistance Area: 0.9563-1.0036
Hello, traders!
Follow us to get the latest information quickly.
Have a great day!
-------------------------------------
(TWTUSDT 1W Chart)
The key support and resistance area is 1.65-1.8839.
To break above this important support and resistance zone, we need to see if the price can maintain support near 1.0036 and rise above 1.4026.
-
(1D chart)
Since the HA-High indicator on the 1D chart was generated at 0.9563, it's crucial to see if the price can maintain above 0.9563-1.0036.
To achieve this, the key is whether the price can rise after finding support near 1.2224.
Therefore, if the price falls below 1.2224, support around 0.9563-1.0036 will be crucial.
------------------------------------
The basic trading strategy is to buy in the DOM(-60) ~ HA-Low range and sell in the HA-High ~ DOM(60) range.
However, if the price rises from the HA-High to DOM(60) range, it is likely to exhibit a step-like upward trend, while if it falls from the DOM(-60) to HA-Low range, it is likely to exhibit a step-like downward trend.
Therefore, the basic trading strategy should be a segmented trading strategy.
Buying when the HA-High to DOM(60) range shows support requires a short and quick response.
As mentioned earlier, the HA-High to DOM(60) range is considered a sell zone, or resistance zone.
Therefore, if possible, it's best to find a buying opportunity when the price declines and then rises.
1. The K indicator of the StochRSI indicator should be rising. If possible, it should not enter the overbought zone.
2. The On-By-Sign-Operative (OBV) indicator should be rising. If possible, it should remain above the High Line.
3. The TC (Trend Check) indicator should be rising. If possible, it should be above the 0 point.
When the three indicators listed above are met, the price is likely to continue its upward trend.
-
Thank you for reading to the end.
We wish you successful trading.
--------------------------------------------------
Tradingstrategy

Volatility Period: Around September 18th (September 17th-19th)
Hello, fellow traders!
Follow us to get the latest information quickly.
Have a great day!
-------------------------------------
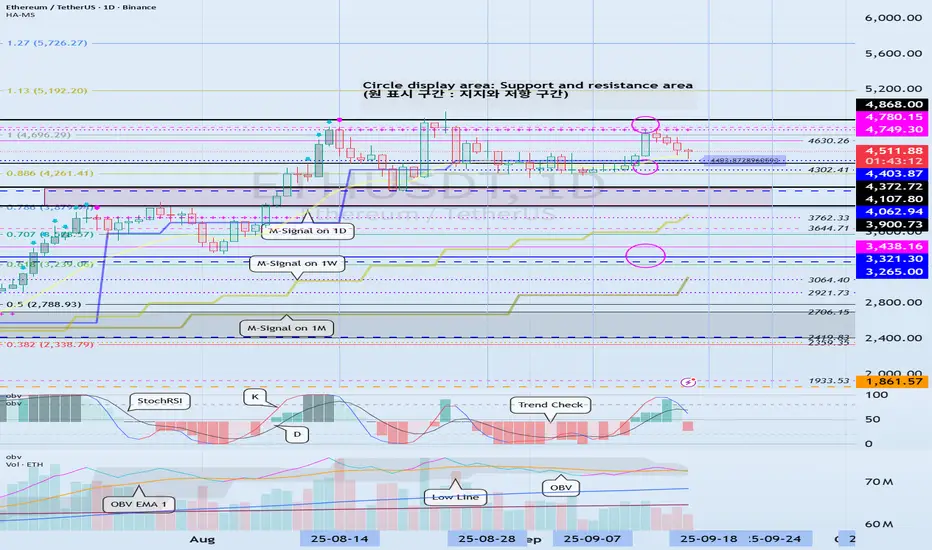
(ETHUSDT 1D Chart)
The 4403.87-4749.30 range, which is the HA-High ~ DOM (60) range, represents a resistance zone.
Therefore, we need to monitor the price movement after the current volatility period, around September 18 (September 17-19).
To sustain the uptrend, the price must remain above the 3900.73-4107.80 range.
From a medium- to long-term perspective, the 3265.0-3321.30 range is a key area.
Considering the above, if it falls below 4403.87,
1st: 4107.80-4372.72
2nd: 3265.0-3321.30
Therefore, it is likely to fall to the first and second levels above.
Therefore, the key question is whether it can find support near 4403.87 after this period of volatility.
-
When trading, it's important to understand the current price level.
I believe there are several ways to determine this.
My basic trading strategy is to determine when to trade.
My basic trading strategy is to buy when support is found in the DOM(-60) ~ HA-Low range and rise, and to sell when it touches the HA-High ~ DOM(60) range.
However, if the price rises in the HA-High ~ DOM(60) range, a step-like upward trend is likely, while if it falls in the DOM(-60) ~ HA-Low range, a step-like downward trend is likely.
Therefore, the basic trading strategy should be a segmented trading strategy.
If you were unable to buy in the DOM(-60) ~ HA-Low range, but the current price is within the DOM(-60) ~ HA-Low range, you should check for support.
Support is determined by checking whether support is found near the HA-Low or DOM(60) indicators.
If you bought when support was found near the HA-Low indicator, the first sell position would be near the DOM(60) indicator.
If you bought when support was found near the DOM(60) indicator, you should execute the trade quickly and effectively.
If the price falls below the purchase price, it would be considered a buy at the high.
To prevent this to some extent, we've utilized several indicators for verification.
First, we utilize the M-Signal indicator on the 1M, 1W, and 1D charts.
That is, if the M-Signal indicator is passing near important support and resistance levels, the presence of support in that area is likely to play a more important role.
Currently, the M-Signal indicator on the 1D chart is passing near 4403.87, so we should consider the area around 4403.87 as a potential important support and resistance level.
Second, we should monitor the movements of auxiliary indicators such as the TC (Trend Check) indicator, the StochRSI indicator, and the On-By-Signal (OBV) indicator.
For the price to continue its upward trend in this important support area,
- the StochRSI indicator must show an upward trend. If possible, it's best to avoid entering the overbought zone.
- The OBV indicator should be showing an upward trend. If possible, it should remain above the High Line.
- The TC (Trend Check) indicator should be showing an upward trend. If possible, it should remain above the 0 level.
By monitoring the movements of the three indicators above, you can determine whether there is support near important support and resistance levels.
However, you should not blindly trust the movements of auxiliary indicators. Even if you have identified the movements of auxiliary indicators, you should always monitor the price movement.
To determine support, you should monitor the price movement for at least 1-3 days.
This is especially important during periods of volatility.
Volatility is a period where you cannot predict the direction of movement, so extra caution is required.
Therefore, if possible, it's better to observe the situation and find a trading opportunity after the volatility period has passed rather than entering a new trade during a volatile period.
-
Thank you for reading to the end. I wish you successful trading.
--------------------------------------------------
- Here's an explanation of the big picture.
(3-year bull market, 1-year bear market pattern)
I'll explain more in detail when the bear market begins.
------------------------------------------------------
ETHFIUSDT: long setup from daily resistance at 1.6776BINANCE:ETHFIUSDT.P has a strong historical level that saw a false breakout yesterday and today.
Considering how long ago this level was formed and the fact that the price is testing it almost to the tick today, I am 99.99% sure that this is a level one not only can, but must work with.
I am expecting a breakout to the upside.
The lower timeframe looks very good: the price is gradually squeezing towards the level, making a smaller pullback each time.
Key factors for this scenario
Global & local trend alignment
Correlation with the market
Volatility contraction on approach
Immediate retest
Prolonged consolidation
Repeated precise tests of the level
No reaction after a false break

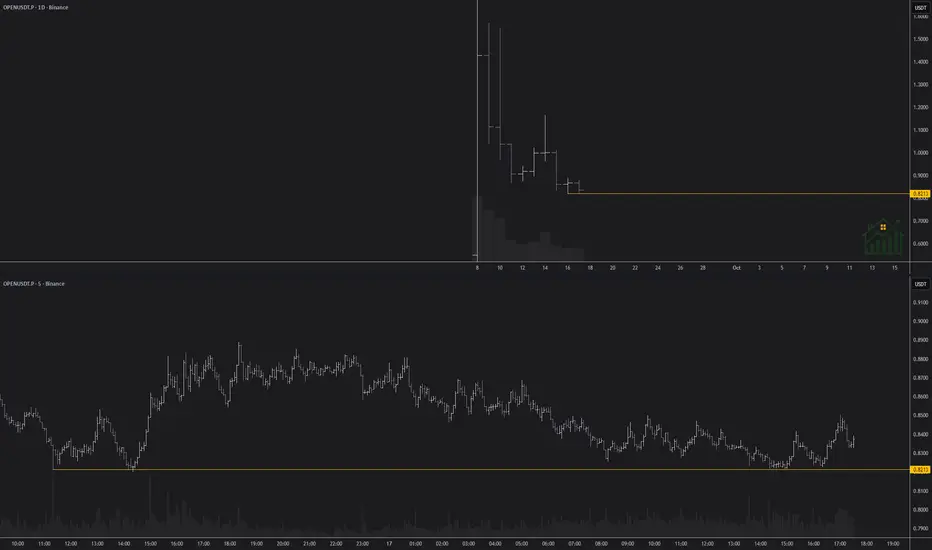
OPENUSD: short setup from daily support at 0.8213BINANCE:OPENUSDT.P
The level is local and fresh, which means it's not strong. However, below it lies a "clean zone" with no obstacles to a free fall. This factor lowers the requirements for the level's strength; a break below it, even though weak, could trigger panic selling as it serves as the only reference point. This panic, in turn, would only accelerate the fall.
Therefore, I am closely watching how the asset approaches this level. A sharp move into it is undesirable.
Key factors for this scenario
Global & local trend alignment
Price void / low liquidity zone beyond level
Volatility contraction on approach
Immediate retest
Repeated precise tests of the level ("sticking")
XAU/USD – Captain Vincent Weekly Plan🔎 Captain’s Log – Context
📈 Main Trend : Strong uptrend after BoS.
📊 Price moving sideways within the rising channel, staying below Weak High 3674 .
📌 EMA 50 > EMA 200 → bullish trend remains solid.
🎯 Captain’s Map – Trading Scenarios
1️⃣ Golden Harbor (BUY – Main Priority)
🎯 Entry:
FVG Dock: 3602 – 3593
FVG Deep: 3567 – 3560
OB Harbor: 3535 – 3540
⛔ SL: below 3520
✅ TP1: 3674 (sweep Weak High)
✅ TP2: 3720 – 3740
2️⃣ Quick Boarding (Short-term SELL – Counter-trend)
Condition: If price breaks 3674 first → watch for false break.
🎯 Entry: 3670 – 3680
✅ TP: back to 3602 – 3567
⚠️ Note : scalp only, don’t hold long.
3️⃣ Storm Breaker Alert (Bearish Scenario)
If 3535 breaks → short-term uptrend invalidated.
🎯 Bearish target: 3480 – 3500
Captain’s Note ⚓
“The golden sail still catches the wind after BoS, leading the captain and crew on the bullish tide. Golden Harbor 🏝️ (3593 – 3560 – 3535) remains the preferred docking point to load cargo and continue the voyage. Quick Boarding 🚤 at Storm Breaker 🌊 (3670 – 3680) is only a short ride when the ship sweeps liquidity at Weak High 3674 . Should 3535 break, the ship might be dragged toward 3480 – 3500, but as long as it anchors at Golden Harbor, the grand journey still heads north toward 3720+.”

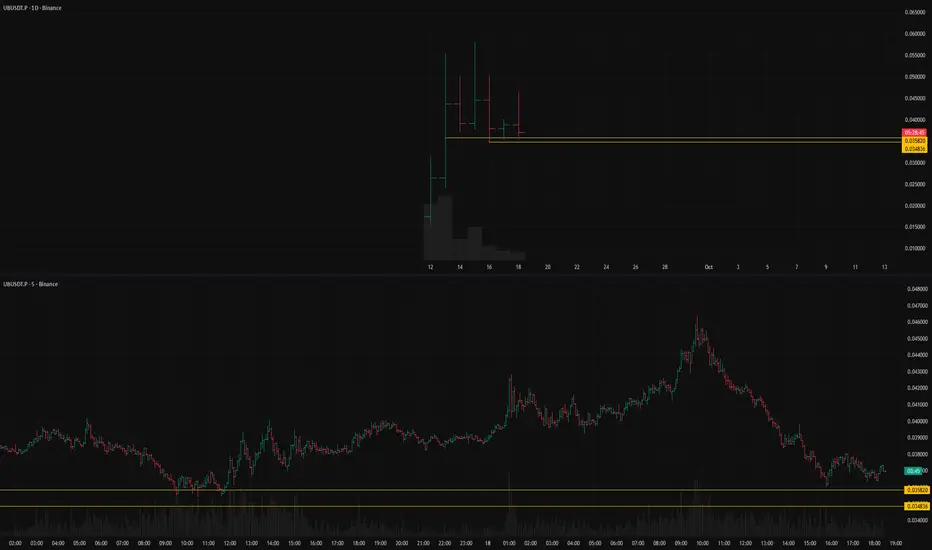
UBUSDT: short setup from daily support at 0.035820BINANCE:UBUSDT.P looks very attractive for a short setup.
There is a clear support level whose strength is not in doubt, as it has been confirmed multiple times.
Today, the asset showed a strong move up, but it ended with an even stronger drop that completely engulfed the prior rally.
Key factors for this scenario
Price void / low liquidity zone beyond level
Liquidity grab (false move against the trend)
Volatility contraction on approach
Immediate retest
Closing near the bar's extreme
Closing near the level
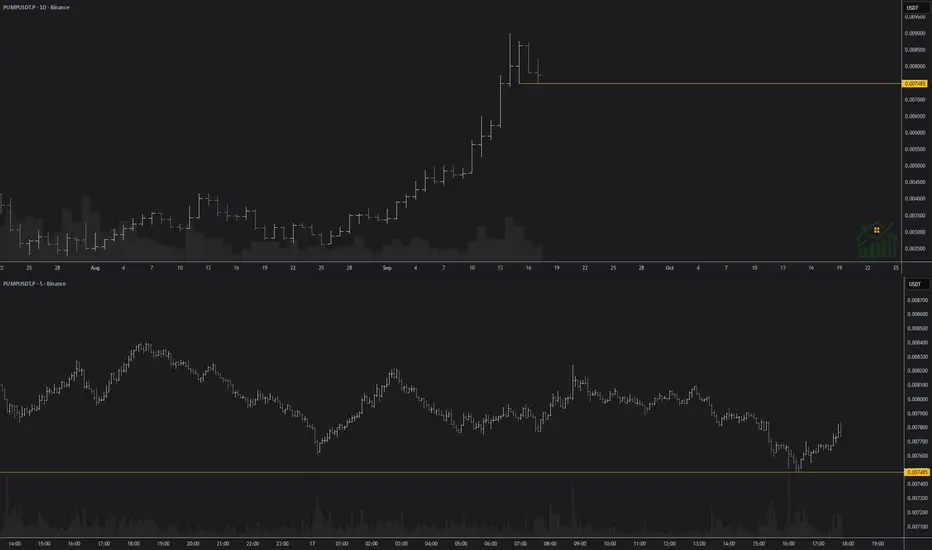
PUMPUSDT: short setup from daily support at 0.007485Today, BINANCE:PUMPUSDT.P confirmed the 0.007485 level with a precise test, which is clearly visible on the lower timeframes.
Without this confirmation, the level couldn't be considered strong. Now, we have a clear reference point to work from.
Important! The key is how, when, and from where the price approaches this level.
Key factors for this scenario
Price void / low liquidity zone beyond level
Volatility contraction on approach
Immediate retest
Closing near the level
Closing near the bar's extreme
Of course, we must remember that the asset can reverse and move up sharply at any moment. This scenario should not be ruled out.
The key is whether it can rise above 3.9509
Hello, fellow traders.
Please "Follow" to always get the latest information quickly.
Have a great day.
-------------------------------------
(SUIUSDT 1D Chart)
Since the HA-High ~ DOM (60) ranges on the 1W and 1D charts partially overlap, a breakout above the 3.9509-4.7328 range is expected to lead to a sharp rise.
Therefore, the 3.9509-4.7328 range is considered a resistance zone.
The HA-Low and HA-High indicators are converging as price movements move.
If this convergence occurs, the converged range, i.e., the HA-Low ~ HA-High range, can be considered a buy zone.
If the price falls below the 2.4495-2.8161 range, trading should be halted and the situation should be monitored.
Currently, the M-Signal indicator on the 1M chart is moving between 2.4495 and 2.8161. Therefore, if the price falls below this level, a stop loss should be considered and a response strategy should be developed.
Based on a basic trading strategy, a buy signal is signaled when support is found in the 2.4495-2.8161 range.
However, if the price falls below the M-Signal indicator on the 1M chart, a downtrend is likely, requiring a response strategy.
-
I mentioned the resistance range as 3.9509-4.7328. However, since the HA-High ~ DOM (60) range on the 1D chart is 3.9509-4.3260, a buy signal can be made when the price finds support within this range and rises.
However, since the buy signal is near the resistance level, a quick and short response is required.
The first sell range is 4.7328-4.96.
-
Thank you for reading to the end.
I wish you successful trading.
--------------------------------------------------

The 115854.56-119177.56 area is a resistance zone
Hello, fellow traders!
Follow us to get the latest information quickly.
Have a great day!
-------------------------------------
(BTCUSDT 1D chart)
Looking at the big picture, there are two important areas.
These are the 104463.99-18353.0 and 84814.27-93570.28 levels.
To continue the stepwise uptrend, an upward breakout of the 116259.91-119177.56 level is necessary.
The M-Signal indicator on the 1D and 1W charts is passing through the 108353.0-116259.91 level. If support is found in this area, the price is likely to continue attempting to break above the 116259.91-119177.56 level.
If the price declines to the 104463.99-18353.0 level and encounters resistance, it is expected to eventually encounter the M-Signal indicator on the 1M chart.
Currently, the M-Signal indicator on the 1M chart is moving between 84814.27 and 93570.28, so it's important to determine whether it can find support within this range.
--------------------------------------
Two OBV EMA lines have been added to the OBV indicator in the Low Line ~ High Line channel.
OBV EMA 1 can be used as a short-term indicator, EMA 2 as a medium-term indicator, and EMA 3 as a long-term indicator.
Disabling EMA 3 reveals that the OBV is currently above both EMA 1 and EMA 2, indicating a transition from EMA 1 to EMA 2.
If OBV rises above the High Line and remains above it, the price is likely to continue its upward trend.
Currently, the price has been trending upward as the OBV indicator has risen above the High Line, but with the High Line indicator re-emerging, it appears to be declining below the High Line.
However, as mentioned earlier, since the OBV indicator is holding above EMA 1 or EMA 2, the key is whether the current support and resistance zones hold support.
In other words, the key is whether support can be found and an upward movement can occur around the 115,854.56-116,259.91 range.
The 115,854.56 and 116,259.91 points are the HA-High indicator levels on the 1D and 1W charts.
Therefore, the current support and resistance zones should be considered resistance zones and a corresponding strategy should be developed.
The basic trading strategy is to buy between DOM(-60) and HA-Low and sell between HA-High and DOM(60).
However, if the price rises in the HA-High ~ DOM(60) range, it could exhibit a step-like upward trend, while if it falls in the DOM(-60) ~ HA-Low range, it could exhibit a step-like downward trend.
Therefore, the basic trading strategy should be a segmented trading strategy.
Therefore, those who bought near the DOM(-60) ~ HA-Low range should consider selling in segments.
If you want to make a new purchase, you can do so when the HA-High ~ DOM(60) range shows support. However, this requires a quick and short response, so caution is advised.
From a broader perspective, this means buying in a sell zone.
-
I believe whether the price will rise or fall in the future depends on whether it can break above Zone 1.
There's a possibility of a bear market turning around, with a new all-time high (ATH) occurring between the week of November 24th and the week of January 26th, 2026.
More details will likely emerge as this month progresses.
This month's volatility period will be around September 19th and September 28th.
-
Thank you for reading.
I wish you successful trading.
--------------------------------------------------
- This is an explanation of the big picture.
(3-year bull market, 1-year bear market pattern)
I will explain in more detail when the bear market begins.
------------------------------------------------------

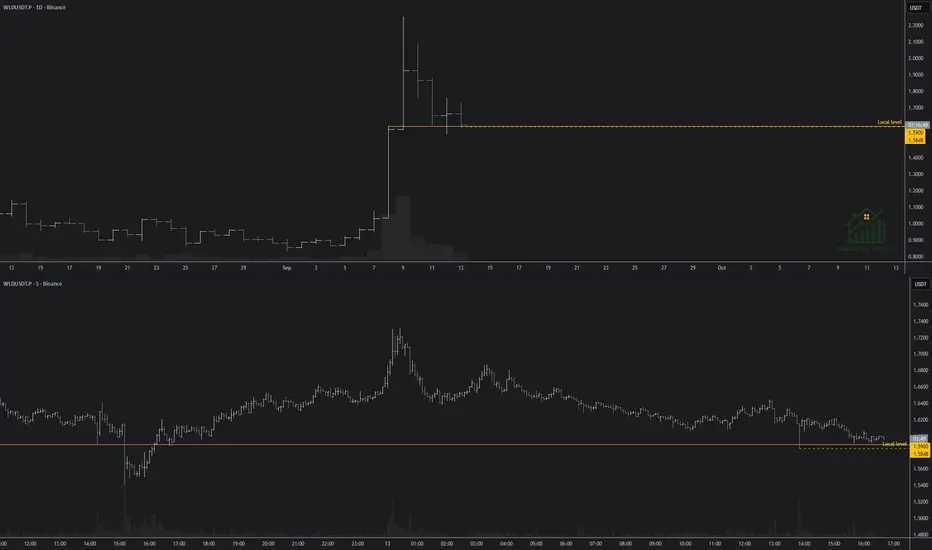
WLDUSDT: Short setup from daily support at 1.5900BINANCE:WLDUSDT.P has a mirror level, which was first resistance and is now support. Although a deep false breakout occurred yesterday, the asset reacted to the level, confirming its relevance. Today, another anomalously large bar on the 5-minute timeframe confirmed the presence of this level. Currently, a gradual squeeze toward the level with low volatility is observed.
Additional consolidation is needed to make a decision about opening a trade. I am adjusting the level to 1.5848, considering the latest false breakout.
In case of increased volatility or another false breakout, I will remove the asset from the watchlist, as it will become choppy price action at the level.
Scenario:
Price void / low liquidity zone beyond level
Volatility contraction on approach
Immediate retest
No reaction after a false break
No reaction after a false break:
Volatility contraction on approach
Momentum stall at the level
Repeated precise tests of the level ("sticking")
Consolidation with price compression (squeeze)
No reaction after a false break
Explanation of the Basic Trading Strategy
Hello, fellow traders!
Follow me to get the latest information quickly.
Have a great day.
-------------------------------------
To understand the charts, the basic trading strategy is the concept used.
Let's look at an example.
---------------------------------------------------------
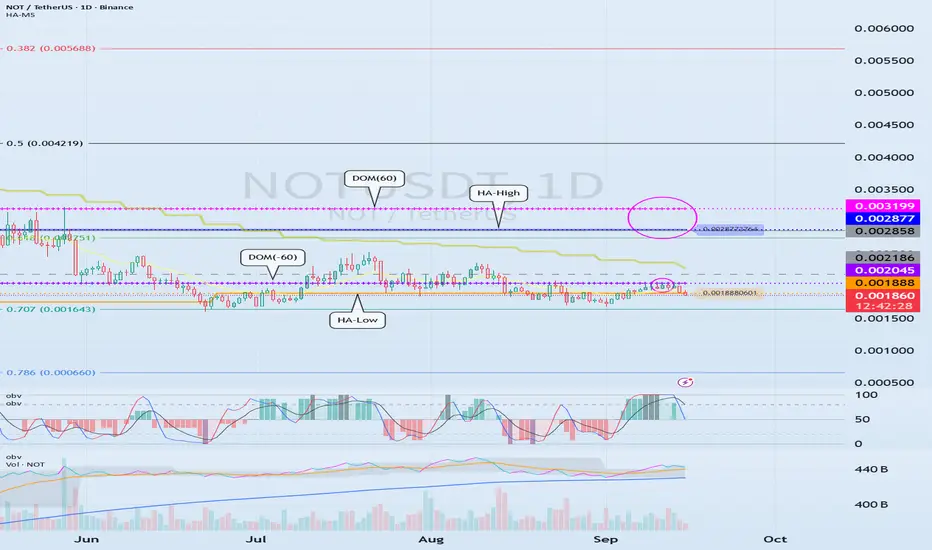
The OBV indicator, which follows the Low Line ~ High Line channel, has shown an upward trend as it has broken above EMA 1 and EMA 2.
Afterwards, the DOM(60) and HA-High indicators were formed, ultimately returning the price to its original position.
Since the HA-Low indicator is forming at 0.001888, we need to examine whether it can find support and rise around this level.
In other words, a buy signal is in the 0.001888-0.002045 range, where support is found and the price rises.
Since the HA-Low and HA-High indicators have converged, a sharp rise is expected if the sideways movement ends and the price rises above 0.002877-0.003199.
-
The basic trading strategy is based on the HA-Low and HA-High indicators, indicators developed for trading on Heikin-Ashi charts.
The basic trading strategy is to buy in the DOM(-60) to HA-Low range and sell in the HA-High to DOM(60) range.
However, if the price rises from the HA-High to DOM(60) range, a step-like upward trend is likely, while if it falls from the DOM(-60) to HA-Low range, a step-like downward trend is likely.
Therefore, the basic trading strategy should be a segmented trading approach.
Therefore, rather than predicting trends based on the movements of one or two indicators, you should prioritize developing a basic trading strategy.
-
If the HA-Low indicator touches and rises to meet the HA-High indicator, the wave should be considered closed.
Furthermore, if the HA-High indicator touches and falls to meet the HA-Low indicator, the wave should also be considered closed.
Remember that the closing of these waves serves as a benchmark for creating new trading strategies.
Previous waves should be forgotten and new trading strategies developed.
-
Thank you for reading to the end.
I wish you successful trading.
--------------------------------------------------
Volatility Period: Around September 7th (September 6th-10th)
Hello, traders!
Follow us to get the latest information quickly.
Have a great day!
-------------------------------------
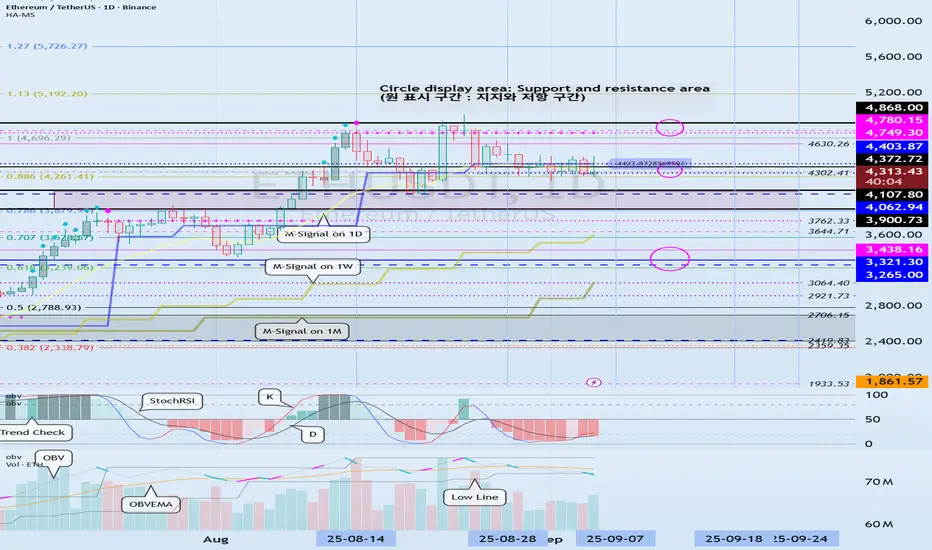
(ETHUSDT 1D Chart)
This volatility period is around September 7th (September 6th-10th).
After this period of volatility, the key question is whether the price can find support and rise above the 4403.87-4749.30 level.
-
To continue the cascading upward trend, the price must rise above 4749.30.
Therefore, we need to monitor whether the price maintains above the 4749.30-4868.0 level.
-
If resistance is encountered at 4403.87 and the price declines, it is likely to decline until it meets the HA-Low indicator.
Therefore, we need to check for support around 4302.41-4403.87.
However, there is a possibility of a rise after touching the previous all-time high (ATH) range of 3900.73-4107.80, so we need to consider a response plan.
If the price falls below 4107.80, it is expected to touch the M-Signal indicator on the 1W chart and resume the trend.
-------------------------------
The On-By-Signal (OBV) indicator is falling below the Low Line.
The TC (Trend Check) indicator is below 0.
The K value of the StochRSI indicator is showing signs of rising from the oversold zone.
If the High Line of the OBV indicator falls and forms a downward channel, it is highly likely that selling pressure will continue to dominate, so caution is advised when trading.
Therefore, the key issue this time is whether support is found around 4302.41-4403.87.
The TC (Trend Check) indicator is a comprehensive evaluation of the StochRSI, On-By-Signal (OBV), and PVT-MACD Oscillator indicators.
Therefore, if the TC indicator is below 0, selling pressure is dominant, and the price is likely to decline.
If the K value of the StochRSI indicator continues to rise, the price is likely to rise after this period of volatility.
However, for the uptrend to continue, the OBV and TC indicators must show upward trends.
-
Thank you for reading to the end.
We wish you successful trading.
--------------------------------------------------
- Here's an explanation of the big picture.
(3-year bull market, 1-year bear market pattern)
I'll explain more in detail when the bear market begins.
------------------------------------------------------
Check for support around 3.0361
Hello, fellow traders!
If you "Follow" me, you'll always get the latest information quickly. Have a great day today.
-------------------------------------
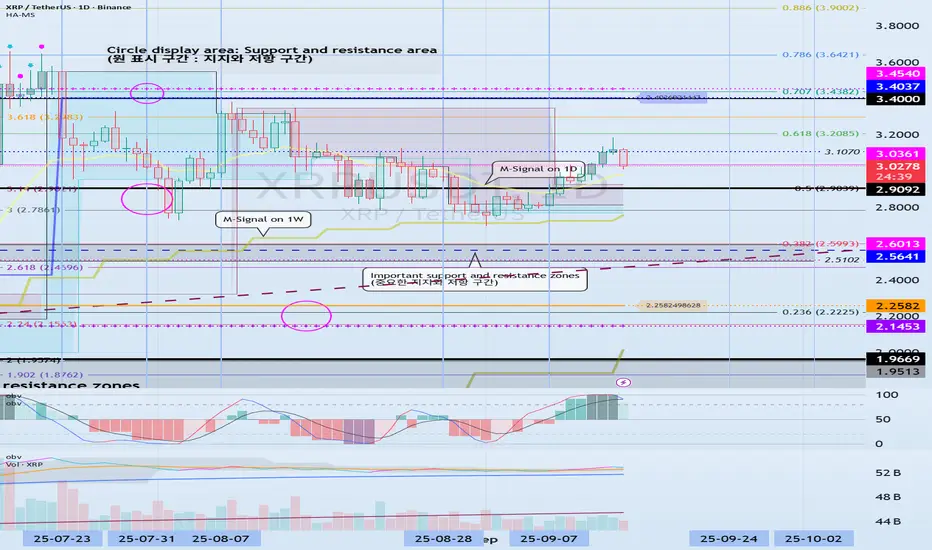
(XRPUSDT 1D chart)
The next volatility period is around September 24th.
However, we should closely monitor the movements around September 18th, which is also the volatile period for BTC.
The key is whether it can find support near 3.0361 and rise above 3.4037.
If not, we should check for support near 2.9092.
The 3.0361 level is the DOM (60) indicator point on the 1M chart. If it finds support near this level and rises, it could potentially lead to a long-term, step-like uptrend.
However, since the HA-High ~ DOM (60) range on the 1D chart is currently formed in the 3.4037-3.4540 range, a breakout above this range is expected to initiate a stepwise uptrend.
-
Thank you for reading to the end.
I wish you successful trading.
--------------------------------------------------
- Here's an explanation of the big picture.
(3-year bull market, 1-year bear market pattern)
I will provide more details when the bear market begins.
------------------------------------------------------
Check if it can rise above 347.21
Hello, traders!
Follow us to get the latest updates quickly.
Have a great day!
-------------------------------------
(TSLA 1D chart)
The key is to determine which direction the price breaks out of the two support and resistance areas of 268.07-311.48 and 347.21-382.40.
For a step-up trend to occur, the price must remain above 334.09-347.21.
However, a step-up trend is highly likely only if the price rises above the support and resistance levels of 382.40 and 421.06 on the 1W and 1M charts.
Even so, a larger increase is likely if the price rises above the 334.09-347.21 range on the 1D chart.
-
The 268.07-311.48 range also falls within the HA-High indicator.
Therefore, it's important to remember that the current position is not a buy position, but rather a sell position.
However, for new buys, it's best to initiate them when support is found near the M-Signal indicator on the 1M chart, if possible.
Therefore, when the 268.07-311.48 range acts as a support zone, it can be considered a buying opportunity.
However, since it's within the HA-High indicator zone, trades should be executed with short and quick responses.
The key volatility period is around October 7th, but before that, we should check the movements around September 5th and September 12th.
At this time, the trend is likely to be determined by which direction the price moves: the 268.07-311.48 range or the 347.21-382.40 range.
-
Thank you for reading to the end.
I wish you successful trading.
--------------------------------------------------

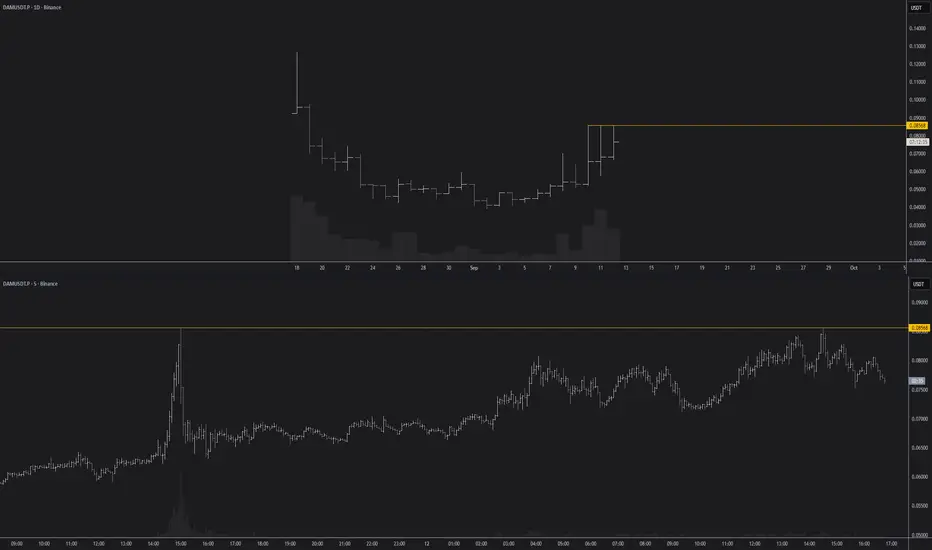
DAMUSDT: Long setup from daily resistance at 0.08568The level is formed by an anomalously large bar from 09.09. Its strength is confirmed by the price stopping just below it on the local timeframe and entering a consolidation. I expect minimal volatility before the level and a continuation of the consolidation. If the consolidation is short, a strong breakout may not occur, resulting in a false breakout.
Scenario:
Price void / low liquidity zone beyond level
Volatility contraction on approach
Immediate retest
Prolonged consolidation
Repeated precise tests of the level
Consolidation with price compression
Do not open a trade if the scenario does not play out.
Do not open a trade solely because the price is crossing a key level, even if it is very strong. Pay attention to how the price crosses the level.
The Trader's House
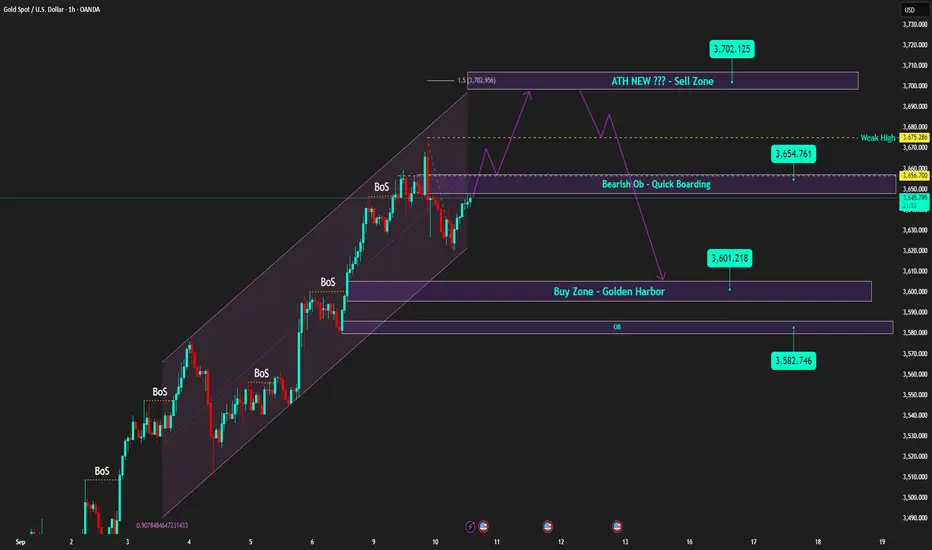
Gold - Caution ahead of US PPI report | Priority on Sell setups🟡 XAU/USD – 10/09 | Captain Vincent ⚓
🔎 Captain’s Log – Market Context
US 10-year bond yields rebound, signaling the market is awaiting key inflation data.
At 07:30, US PPI report will be released – a crucial figure that could strongly influence FED rate expectations.
Investors are also eyeing US CPI in the coming days to assess the inflation outlook.
The US Supreme Court accepted Trump’s appeal, but this news has not yet had a notable impact on Gold.
⏩ Captain’s Summary: Ahead of inflation data, Gold often tends to correct lower due to cautious sentiment.
📈 Captain’s Chart – Technical Analysis
Storm Breaker (Key Resistance):
Bearish OB: 3654 – 3660 (short-term upper cap)
ATH Watchtower: 3700 – 3702 (Sell Zone – possible new ATH test)
Golden Harbor (Strong Support):
Buy Zone: 3601 – 3602
OB Dock: 3582 – 3585
Currently, price is around 3640 – 3645, after a technical rebound from support. High probability that Gold will retest nearby resistance before a downward correction.
🎯 Captain’s Map – Trade Scenarios
⚡ Quick Boarding (SELL – Daily Priority)
Entry 1: 3654 – 3660
SL: 3668
TP: 3654 → 3650 → 3618 → 3610
Entry 2 – ATH Test: 3701 – 3703
SL: 3711
TP: 3688 → 3675 → 3665 → 365x
✅ Golden Harbor (BUY – Only at deep support)
Buy Zone: 3601 – 3603
SL: 3592
TP: 3610 → 3620 → 3630
⚓ Captain’s Note
“The golden ship faces turbulent seas today as it sails near Storm Breaker 🌊 (3654 – 3660) . Before the fierce winds called US PPI , sailors should prioritize dropping anchor with short-term SELL positions at resistance. Golden Harbor 🏝️ (3601 – 3603) remains a safe haven below, but only when the ship corrects deeply should it dock. On this voyage, Quick Boarding 🚤 is for scalp maneuvers, while the main current is still steered by the stormy waves of inflation.”
USDJPY – Dual POI Short Setup🧠 Market Context
Previous Day High swept → liquidity grab complete.
CHoCH → Bearish Intent confirmed → directional bias is short.
Price is now retracing into supply zones for potential continuation lower.
🎯 Key Points of Interest (POIs)
Refined 1H POI
Aligned with highest previous day volume.
Strong institutional confluence.
Extreme 5M FVG (sweep origin)
Cleaner entry with tighter risk.
Aligns with the extreme point of interest logic from liquidity models.
⚖️ Execution Plan
Option A: Scale Entries
Partial entry at 1H POI.
Add position at 5M extreme FVG if price sweeps deeper.
Option B: Confirmation Entries
Wait for LTF BOS / rejection candle inside either POI before execution.
🔽 Bearish Targets
147.037 → Previous Daily Low (Liquidity Zone).
146.582 – 146.600 → Deeper liquidity + imbalance fill.
⚠️ Risk Management
Risk 0.5–1% per setup, split across zones.
Move SL to breakeven once 2R is achieved.
Trail stop following bearish structure.
📊 Summary
USDJPY has shifted to bearish intent after the PDH sweep. Two valid POIs are in play — a volume-backed 1H supply and an extreme 5M FVG.
Best approach: scale into both for higher probability while keeping risk controlled.
💬 What do you think? Would you take the refined 1H POI or wait for the extreme 5M FVG?

NQ100 Intraday Outlook – Sept 8, 2025🧠 NQ100 Intraday Outlook – Sept 8, 2025
Bias: Intraday Bearish after NY Open
Price is currently trading within a well-defined premium zone, between the Sunday-Monday Order Block and the BPR M30 area.
🧩 Key Observations:
Price tapped into a minor M5 Order Block (OB) right after the 8:30 NY macro event.
We're seeing a reaction to a short-term OB, with a small push up likely to grab liquidity above the London session high.
Expecting liquidity run + rejection from the upper OB zone (23,810–23,830).
🔽 Bearish Scenario:
After the sweep of local highs, I anticipate a sell-off toward the Imbalance zone below (23,710 area).
Main targets are:
Imbalance fill
Possibly further down toward Weekly Open near 23,680
🔧 Confluence:
Midnight Open has already been reclaimed.
NY AM session is about to open – expecting expansion to provide confirmation.
Potential divergence between NQ (stronger) and ES (weaker) gives context for relative weakness later in the session.
📌 Idea Summary:
I expect one final push into the premium zone to grab liquidity before reversing down toward the Imbalance and possibly into the Weekly Open.

XAU/USD – FED, Tariffs & NFP Tonight | Captain Vincent 🔎 Captain’s Log – Context & News
The probability of the FED cutting rates in September has risen to 99.4% (from 96.6%) → almost a certainty.
FED’s Cook is under fraud investigation, combined with previously weak economic data → further strengthens momentum for Gold.
US–Japan deal: US reduces chip import tariffs to 15% , in return Japan invests $550B + purchases $8B worth of agricultural products. Positive, but not game-changing since markets remain focused on interest rates & inflation.
Trump: Threatens to impose tariffs on all chip/semis companies not entering the US → raises geopolitical concerns.
NFP & Unemployment Rate at 07:30 Us → key event, potential for very strong volatility.
⏩ Captain’s Summary:
Flows remain tilted toward BUY Gold thanks to FED rate cut expectations, but short-term whipsaws may occur before/after the news.
📈 Captain’s Chart – Technical Analysis
M30 BOS : Gold just created a Break of Structure, overall trend remains bullish.
Captain’s Shield (Support) : 3484 – 3486 (Main Buy Zone).
Storm Breaker (Resistance) : 3575 – 3593 (aligns with Fibo 0.5 – 0.618).
If Gold breaks above 3591 – 3593 → opens the path toward new ATH at 3608 – 3610 or higher.
If rejected at Storm Breaker → price may retest Golden Harbor (3484) before bouncing back upward.
🎯 Captain’s Map – Trade Scenarios
✅ Golden Harbor (BUY – Priority)
Entry: 3484 – 3486
SL: 3478
TP: 3490 → 3493 → 3497 → 3505 → 35xx
⚡ Quick Boarding (SELL Scalp – Short-term)
Entry: 3575 – 3577
SL: 3585
TP: 3570 → 3565 → 3560 → 3555 → 35xx
🌊 Storm Breaker (SELL Zone – Resistance)
Entry: 3591 – 3593
SL: 3600
TP: 3588 → 3585 → 3580 → 3575 → 35xx
⚓ Captain’s Note
“The Golden ship sails smoothly as the FED is almost certain to cut rates in September. Golden Harbor 🏝️ (3484) is the safe haven to continue riding the bullish wave. Storm Breaker 🌊 (3575–3593) may spark big waves for short Quick Boarding 🚤 , but the main current still carries us northward.”

Check for support near 111696.21
Hello, traders!
Follow us to get the latest information quickly.
Have a great day!
-------------------------------------
(BTCUSDT 1D chart)
The TC (Trend Check) indicator appears to have risen above the 0 level.
Accordingly, the key question is whether support can be found around 111696.21.
For the uptrend to continue, the OBV indicator must rise above the High Line and remain so.
-
The volatility period in September is expected to occur around September 9th, September 19th, and September 28th.
-
Thank you for reading.
I wish you successful trading.
--------------------------------------------------
- This is an explanation of the big picture.
(3-year bull market, 1-year bear market pattern)
I will explain in more detail when the bear market begins.
------------------------------------------------------

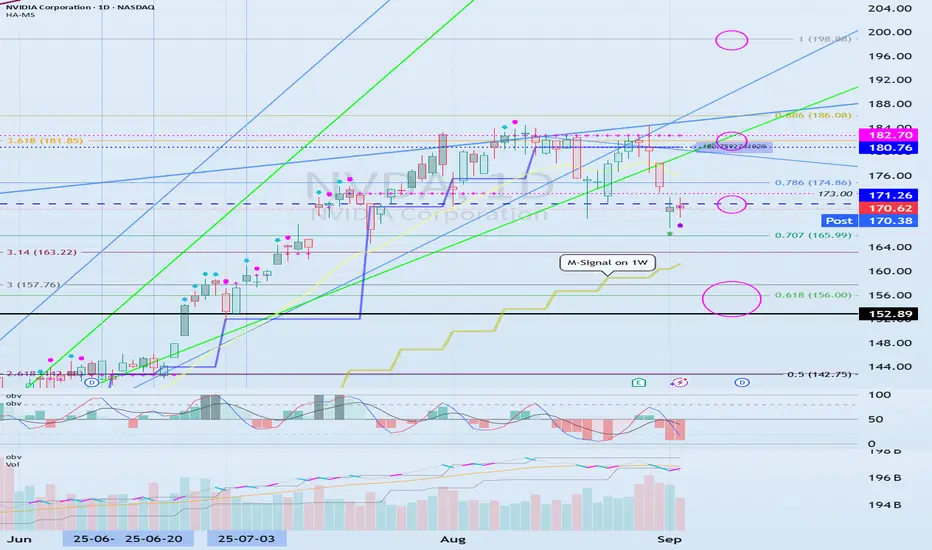
Checking for support near 171.26
Hello, traders!
Follow me to get the latest information quickly.
Have a great day!
-------------------------------------
(NVDA 1M chart)
The basic trading strategy is to buy in the DOM(-60) ~ HA-Low range and sell in the HA-High ~ DOM(60) range.
However, if the price rises from the HA-High to DOM(60) range, a step-like uptrend is likely, while if it falls from the DOM(-60) to HA-Low range, a step-like downtrend is likely.
Therefore, the basic trading strategy should be a segmented trading strategy.
-
Looking at the current 1M chart, the HA-High to DOM(60) range is 121.80-138.23.
Therefore, if the price holds above 121.80-138.23, the step-like uptrend is likely to continue.
The left Fibonacci ratio was drawn in the first wave, and the key is whether the price can rise above 3.618 (181.85) and hold.
The right Fibonacci ratio was drawn in the second wave, and the key is whether the price can rise above 1 (198.88).
Therefore, the key question is whether the price can break above the 181.85-198.88 range.
If the price fails to rise,
1st: 152.89
2nd: 121.80-138.23
We need to check for support near the 1st and 2nd levels above.
-
(1D chart)
The HA-High ~ DOM(60) range on the 1D chart is 180.76-182.70.
Therefore, for a stepwise uptrend to begin, the price must rise above 180.76-182.70 and maintain its position.
The 171.26 level is the HA-High indicator level on the 1W chart.
Therefore, the key question is whether support is found near 171.26.
If it falls below 171.26, it is likely to decline until it meets the M-Signal indicator on the 1W chart.
At this point, the key is whether it can find support near 152.89, the Fibonacci 3 level (157.76) to the left.
If it falls below the M-Signal indicator on the 1W chart, there is a possibility of a downtrend, so you should consider a response plan.
------------------------------------------------
If this is your first time hearing this explanation, you may not understand what I'm talking about.
The important thing is that the DOM(-60) and HA-Low indicators indicate lows, while the DOM(60) and HA-High indicators indicate highs.
Therefore, buys should be made near the DOM(-60) and HA-Low indicators, and sells should be made near the DOM(60) and HA-High indicators.
To interpret charts from a long-term perspective, you need to check the positions of the DOM(-60), HA-Low, HA-High, and DOM(60) indicators on the 1M chart.
The 1W chart is interpreted from a medium- to long-term perspective, while the 1D chart is interpreted from a short-term perspective.
In the stock market, price fluctuations are often driven by issues other than the chart itself, so it's important to always be aware of volatility.
Even so, since volatility ultimately occurs after the chart is created, it's best to analyze the chart first and then examine other issues.
Otherwise, you'll likely end up creating a trading strategy that heavily reflects your own subjective opinions.
-
Thank you for reading to the end.
I wish you successful trading.
--------------------------------------------------
The key is whether the price can rise above 240.55 and hold
Hello, fellow traders!
Follow me to get the latest information quickly.
Have a great day.
-------------------------------------
(AAPL 1D chart)
The basic trading strategy is to buy in the DOM(-60) ~ HA-Low range and sell in the HA-High ~ DOM(60) range.
However, if the price rises from the HA-High to DOM(60) range, a step-like uptrend is likely, while if it falls from the DOM(-60) to HA-Low range, a step-like downtrend is likely.
Therefore, the basic trading strategy should be a segmented trading strategy.
-
The HA-High to DOM(60) range on the current 1D chart is 229.27-232.78.
Therefore, if the price remains above the 229.27-232.78 range, a step-like uptrend is highly likely.
However, looking at the chart overall, the 226.67-240.55 range corresponds to the HA-High indicator.
Therefore, it is necessary to check for support within the 226.67-240.55 range.
If it rises above 240.55, it is expected to attempt to rise to the 250.42-260.10 range.
The 250.42 and 255.59 levels correspond to the DOM(60) indicator on the 1M chart and the DOM(60) indicator on the 1W chart, respectively.
Therefore, to sustain the mid- to long-term uptrend, the price must rise above 250.42-255.59 and maintain its position.
-
Based on the basic trading strategy mentioned earlier, this is currently within the range for a partial sell-off.
Buying in this range requires a short and quick response, so be cautious.
Buying is possible when the 226.67-240.55 range shows support.
If it falls below 226.67, cut your losses and wait to see how the situation develops.
If the price falls below the M-Signal indicator on the 1M chart and remains there, there's a possibility of a medium- to long-term downtrend, so a countermeasure is needed.
-
The HA-Low indicator on the 1D chart is currently at 192.31.
This point is located within the previous all-time high (ATH) range of 182.94-199.62, making the 182.94-199.62 range an important support area.
-
(1M chart)
The area highlighted by the circle represents an important area.
-
Thank you for reading to the end.
I wish you successful trading.
--------------------------------------------------

Major Global Financial Markets1. What Are Financial Markets?
A financial market is a platform—physical or electronic—where buyers and sellers trade financial securities, assets, and instruments. These markets bring together those who have surplus capital (investors, savers) with those who need capital (businesses, governments, entrepreneurs).
Key Functions of Financial Markets
Capital Allocation – Directs money to productive uses.
Liquidity Provision – Allows investors to buy/sell easily.
Price Discovery – Determines fair value of securities.
Risk Management – Through hedging instruments like derivatives.
Global Integration – Connects economies and facilitates international trade.
2. Types of Global Financial Markets
Financial markets are broadly categorized into:
Equity Markets (Stock Markets) – Trading of shares in companies.
Bond Markets (Debt Markets) – Governments and corporations raise money through debt instruments.
Foreign Exchange Markets (Forex) – Trading of currencies worldwide.
Commodity Markets – Trading in physical goods like oil, gold, wheat.
Derivatives Markets – Contracts based on underlying assets (options, futures, swaps).
Each of these has regional hubs and global leaders. Let’s go into detail.
3. Major Global Equity (Stock) Markets
a) New York Stock Exchange (NYSE) – USA
The world’s largest stock exchange by market capitalization (over $25 trillion).
Located on Wall Street, New York.
Hosts giants like Apple, Microsoft, Amazon, and Coca-Cola.
Known for blue-chip stocks and IPO launches.
b) NASDAQ – USA
The second-largest stock exchange globally.
Famous for tech-heavy listings like Tesla, Meta, Nvidia, and Alphabet (Google).
Fully electronic, with rapid trading speeds.
c) London Stock Exchange (LSE) – UK
Oldest exchange, dating back to 1698.
Global hub for international listings.
Strong presence in banking, energy, and mining companies.
d) Tokyo Stock Exchange (TSE) – Japan
Largest stock market in Asia.
Houses Japan’s corporate giants—Toyota, Sony, SoftBank.
Plays a key role in reflecting Asian market sentiment.
e) Shanghai Stock Exchange (SSE) – China
Among the world’s top three exchanges by market cap.
Known for state-owned enterprises (SOEs).
Plays a critical role in China’s rise as an economic powerhouse.
f) Hong Kong Stock Exchange (HKEX) – Hong Kong
A gateway for Chinese companies to global investors.
Strong presence in banking, real estate, and tech listings.
g) Euronext – Europe
A pan-European exchange operating across Paris, Amsterdam, Brussels, and more.
Represents the European Union’s financial integration.
h) Indian Stock Markets – NSE & BSE
Bombay Stock Exchange (BSE): Asia’s oldest exchange (1875).
National Stock Exchange (NSE): Modern, technology-driven, largest in India.
Hosts big names like Reliance Industries, Infosys, and TCS.
India is an emerging market giant, attracting global capital.
4. Major Bond (Debt) Markets
The bond market is even larger than the stock market. It is where governments and corporations borrow money.
a) US Treasury Market
Largest and most important bond market globally.
US Treasuries are considered the safest assets in the world.
Yields on Treasuries influence global interest rates.
b) European Bond Market
Includes German Bunds, UK Gilts, and French OATs.
German Bunds are considered Europe’s safest bonds.
c) Japanese Government Bonds (JGBs)
Japan has one of the highest government debt-to-GDP ratios.
The Bank of Japan often intervenes to control yields.
d) Emerging Market Bonds
Issued by countries like Brazil, India, South Africa.
Higher yields but higher risks compared to developed markets.
5. Foreign Exchange (Forex) Market
The foreign exchange (FX) market is the largest financial market in the world, with daily turnover exceeding $7.5 trillion (BIS, 2022).
Operates 24/5 across major hubs: London, New York, Tokyo, Singapore, Hong Kong.
The US Dollar (USD) dominates, involved in ~88% of all trades.
Other key currencies: Euro (EUR), Japanese Yen (JPY), British Pound (GBP), Chinese Yuan (CNY).
Major FX Centers
London – Largest hub, handling ~40% of global trades.
New York – USD-dominated trades.
Tokyo & Singapore – Asian time zone hubs.
Importance of Forex Markets
Facilitates international trade.
Provides hedging against currency risk.
Acts as a barometer of economic strength.
6. Commodity Markets
Commodities are raw materials traded globally.
a) Chicago Mercantile Exchange (CME) – USA
World’s largest commodities and derivatives exchange.
Trades in oil, natural gas, gold, corn, soybeans, cattle.
b) London Metal Exchange (LME) – UK
The world’s largest market for industrial metals like copper, aluminum, zinc.
c) New York Mercantile Exchange (NYMEX) – USA
Specializes in energy futures (oil, natural gas).
d) Multi Commodity Exchange (MCX) – India
India’s largest commodity exchange.
Active in gold, silver, crude oil, and agricultural commodities.
7. Derivatives Markets
Derivatives are financial contracts whose value is based on an underlying asset (stocks, bonds, commodities, currencies).
a) Chicago Board Options Exchange (CBOE) – USA
Leading exchange for options trading.
Famous for the VIX Index (fear gauge of markets).
b) CME Group – USA
World’s largest futures market.
Handles everything from equity index futures to crypto derivatives.
c) Eurex – Europe
Europe’s main derivatives market.
Active in futures and options on European indices and bonds.
8. Role of International Financial Institutions
Apart from exchanges, global institutions play a vital role:
IMF (International Monetary Fund): Provides financial stability.
World Bank: Funds infrastructure projects.
BIS (Bank for International Settlements): Oversees central banks.
WTO (World Trade Organization): Facilitates trade rules.
9. Interconnectedness of Global Financial Markets
Today’s markets are deeply interconnected. A crash in one market often spreads globally—like the 2008 financial crisis. Similarly, interest rate decisions by the US Federal Reserve ripple through all asset classes worldwide.
10. Challenges in Global Financial Markets
Geopolitical Risks – Wars, sanctions, trade wars.
Currency Volatility – Exchange rate shocks.
Technological Disruption – Rise of AI, algorithmic trading.
Regulatory Differences – Fragmented global rules.
Climate & ESG Risks – Green finance and carbon trading emerging.
11. Future of Global Financial Markets
Digital Assets & Cryptocurrencies: Bitcoin, Ethereum gaining mainstream adoption.
Tokenization of Assets: Real estate, art, and stocks being tokenized.
Green Finance: Carbon credits, renewable energy investments.
AI & Algorithmic Trading: Faster, data-driven market participation.
India & Emerging Markets: Expected to become global growth drivers.
Conclusion
The major global financial markets—equities, bonds, forex, commodities, and derivatives—are the backbone of the world economy. They provide a platform for raising capital, investing, hedging risks, and allocating resources. While the US remains the dominant player, Asia and emerging markets are rising fast.
These markets are complex, interconnected, and ever-changing. Understanding them is crucial for investors, policymakers, businesses, and individuals alike.
In the coming decades, technology, geopolitics, and sustainability will reshape how these markets function. But one thing remains certain—financial markets will always be at the heart of global economic activity.
