Complete Guide To Backtesting In TradingBacktesting — The Cure for Losses
Backtesting is the process of testing a trading idea on historical data before you risk real money. It’s like going back in time and asking: “If I had traded these rules before, would I have made money or not?”
Why Backtesting Matters
Separate Ideas from Illusions
Many strategies look promising at first glance. Visually — they seem solid. Emotionally — “it’s obvious this should work.” Backtesting quickly sobers you up:
Either the idea has a statistical edge,
Or it’s pure self-deception.
Understand the Math Behind the Strategy
Backtesting answers questions you can’t solve intuitively:
What’s the average profit per trade?
How many losing trades in a row are normal?
What’s the actual drawdown?
How many trades per month/year?
After a solid backtest, you stop fearing normal drawdowns — because you know the stats.
Save Money and Nerves
The market is an expensive teacher. Backtesting is free.
Every strategy untested on history is an experiment at your own expense.
Build Confidence in the System
When you have hard numbers:
You stop overreacting.
You break rules less often.
You avoid “jumping in because it felt right.”
You’re trading a process, not hope.
What You Must Understand Up Front
Backtesting does not guarantee future profits. Markets evolve — and that’s normal.
But backtesting does show:
Whether the idea had an edge.
What risks are involved.
Why trading blind is reckless.
It’s like checking your car before a trip. It doesn’t guarantee no accidents, but driving without it is just foolish.
What Exactly Do We Backtest?
We don’t test a single entry model or one indicator. We test a trading system defined by clear rules. That’s crucial — until an idea becomes a system, it can’t be objectively verified.
1. The Logic of Decision-Making
The test object is the logic behind your trades. Primarily — market context:
Why do you use this entry model here?
What in price action or market behavior gives you reason to expect movement in your favor?
Not just “RSI below 30” as a fact, but what it represents — imbalance, momentum, reaction to a level, or dislocation. If entry logic isn’t meaningful, backtesting degenerates into signal-hunting.
2. Trade Exit
This is where most of the results are shaped. We test:
Where losses are cut.
Where and how profits are taken.
Whether exits use fixed targets, logical levels, partial closes, or trailing stops.
Often the same entry, with different exit rules, produces radically different equity curves — from a robust system to a total blow-up.
3. Risk Management
Risk per trade, risk/reward ratio, the impact of losing streaks on equity — all are part of the hypothesis. A strategy may be sound, but with poor risk management it becomes unsustainable. In backtesting, we look not only at profits, but at how the system survives drawdowns.
4. Filters
When does the strategy perform best?
During certain times of day?
Under specific volatility conditions?
In trends or ranges?
Often, adding a simple filter eliminates most losing trades and dramatically improves stability.
5. Repeatability
Does the hypothesis work across different historical periods, market phases, and instruments? If it only shows results in one year — that’s not a trading system, it’s curve-fitting.
What We Do Not Test
We don’t test feelings like “this looks logical.” We don’t test pretty trades. We don’t chase a perfect equity curve without drawdowns.
Backtesting is not about confirming expectations — it’s about stress-testing them.
Key Metrics to Track
1. Win Rate (Percentage of Profitable Trades)
Win Rate is the proportion of profitable trades relative to the total number of trades over a selected period.
Formula:
Win Rate (%) = (Number of Profitable Trades / Total Number of Trades) × 100
Example:
Total trades: 120
Profitable trades: 42
Losing trades: 78
Calculation:
Win Rate = 42 / 120 × 100 = 35%
Strategy Win Rate = 35%.
What counts as a profitable trade:
A trade is considered profitable only if the final result is positive after accounting for commissions and slippage.
Trades closed at breakeven or with a small loss due to fees are not considered profitable.
A high Win Rate does not guarantee a reliable or profitable strategy.
2. Risk / Reward Ratio (R:R)
Risk / Reward (R:R) reflects the ratio between the average risk and the average potential profit per trade. It shows how much profit the strategy generates per unit of risk.
For beginners, acceptable R:R values are typically 1:2 or 1:3.
Strategy profitability is driven by asymmetry between losses and gains, not by the frequency of winning trades.
3. Expectancy
Expectancy is the average financial outcome of one trade over the long term.
It answers the key backtesting question:
Does the strategy make money on average per trade?
Basic Formula:
Expectancy = (WinRate × AvgWin) − (LossRate × AvgLoss)
Where:
WinRate — proportion of profitable trades (not in %)
LossRate = 1 − WinRate
AvgWin — average profit of winning trades
AvgLoss — average loss of losing trades (absolute value)
A positive expectancy is a mandatory condition for a viable strategy.
4. Trade Distribution by Sessions (Asia / Europe / US or Specific Hours)
Analyze trades by time to understand where performance is actually coming from.
Key questions to analyze:
Where is the majority of profit generated?
Which sessions drag overall performance down?
Where volatility is high but results are poor?
Common scenario:
Asia — negative
London — neutral
New York — generates almost all the profit
5. Time-Based Expectancy
Expectancy should be analyzed not only overall, but also:
By session
By individual hour
This is one of the strongest performance filters.
Number of Trades by Time
A time slot may appear profitable, but if it has only a few trades per year, the result is statistically insignificant.
Drawdown by Session
Sometimes a session is profitable overall, but its drawdowns during specific hours are psychologically unacceptable
6. Expectancy: Long vs Short
Very often:
Long trades produce stable and smooth results
Short trades produce sharp gains but with deep drawdowns
Or vice versa.
Win Rate by Direction
Win Rate may be similar, but:
Longs may have smaller stop losses
Shorts may experience frequent stop-outs
If expectancy in one direction is below zero, it should be:
Removed entirely, or
Strongly restricted.
Common Backtesting Mistakes
1. Look-Ahead Bias (Future Leak)
This occurs when the principle of sequential analysis is violated.
Trading decisions are made using information that would not have been available in real time.
Examples:
Analyzing fully formed highs or lows;
Using closed candles that did not exist at the moment of entry;
Adjusting entries or stop losses after seeing future price movement.
Consequences:
Significant overestimation of strategy performance;
Distorted and misleading statistics.
Correct Approach:
Move strictly from left to right on the chart;
Hide the right side of the chart;
Make decisions only based on information available at that moment.
2. Curve Fitting (Over-Optimization)
This mistake occurs when a strategy is excessively optimized for historical data by adding too many conditions and parameters.
As a result:
The strategy perfectly explains the past;
But loses its ability to work in the future.
Rule of thumb:
If a strategy cannot be explained in simple words without a chart, it is most likely over-optimized.
3. Ignoring Commissions and Slippage
In many backtests:
Entries and exits occur at “ideal” prices;
Orders are assumed to be executed instantly;
Commissions are ignored or underestimated.
Why the impact is often underestimated:
Fees seem small (0.05–0.2%);
Each individual trade appears barely affected;
The cumulative effect becomes visible only over time.
Particularly vulnerable strategies:
Scalping;
High-frequency trading;
Systems with low Risk/Reward ratios.
Such conditions do not exist in real trading.
Correct Approach:
Always include commissions on both entry and exit;
Apply conservative slippage assumptions;
Test closer to the worst-case scenario, not the best;
Use real exchange and instrument parameters.
If a strategy becomes unprofitable after accounting for commissions and slippage, it never had a real edge
4. Testing Only “Favorable” Market Conditions
This methodological error occurs when a strategy is tested only during market phases where it naturally performs best.
This creates an illusion of robustness that is not confirmed across real market cycles.
A strategy must be tested under:
Trending markets;
Ranging (sideways) markets;
Periods of high volatility;
Periods of low volatility.
It is acceptable that a strategy:
Performs well in some regimes;
Loses money or stagnates in others.
The key is understanding where and why this happens.
A strategy that works only in favorable conditions is not a trading system.
Proper backtesting must account for market variability and evaluate performance across all market regimes.
Evaluating Strategy Fit for the Trader
1. Psychological Compatibility
Assess your tolerance for:
Losing streaks;
Waiting for valid trade setups;
Holding positions over time.
2. Lifestyle Compatibility
The strategy should align with:
Available time;
Required level of concentration;
Daily work rhythm.
3. Risk Profile
A comfortable strategy:
Does not induce panic;
Does not trigger impulsive decisions;
Provides a sense of control.
4. Final Check
If you break the rules on a demo account,
you will break them even more often on a live account.
A good strategy looks:
Boring;
Clear;
Predictable
Backtesting Features and Pitfalls in TradingView
Before starting backtesting, it is important to understand certain specifics of how TradingView displays data.
If these nuances are ignored, you will almost inevitably introduce look-ahead bias and distort your test results.
Choosing a Backtest Starting Point in TradingView:
When selecting the starting point for a backtest in TradingView, there are four main tools:
Select bar — you manually choose a specific bar on the chart from which you want to start the analysis.
Select date — you set a date from which the chart will be displayed.
Select the first available date — the backtest starts from the earliest available bar (relevant if your subscription has historical data limits).
Random bar — TradingView moves you to a random location on the chart.
Personally, for the sake of experimental integrity, I most often use Random bar.
This approach helps minimize look-ahead bias and makes the backtest closer to real trading conditions.
You do not know in advance what will happen next and are forced to make decisions under uncertainty — exactly as in live markets.
A Critically Important TradingView Behavior:
There is a TradingView behavior that many traders are unaware of, yet it can severely distort backtesting results.
When switching to a higher timeframe, TradingView always shows a fully closed candle, even if in real time that candle would still be forming.
Example 1
You are on a 5-minute chart in the middle of the trading day and decide to check the daily timeframe.
TradingView will show you the final daily candle, meaning you effectively see how the day will close.
As a result, you already know the outcome of the price movement and may subconsciously adjust your decisions based on future information.
Example 2
You are analyzing order flow on a 1-hour chart and decide to look at the weekly timeframe to identify key reaction zones.
If you simply switch to the weekly chart, TradingView will display a fully formed weekly candle, including its high, low, and close.
In practice, this means you already know how the week opens and closes while still analyzing trades within that same week.
This is direct look-ahead bias, which makes the backtest invalid.
How to Avoid Look-Ahead Bias in TradingView
To ensure an honest backtest, you must scroll the chart back before switching to a higher timeframe.
This is where the Select bar tool becomes essential.
The logic is simple:
If you want to view the daily timeframe — scroll back at least one full day.
If you are analyzing the hourly timeframe — scroll back at least one full hour.
If you want to view the weekly timeframe — scroll back at least one full week.
Only after that should you switch to the higher timeframe.
In this case, you will see only the information that was actually available to the market at that moment — without spoilers and without distorted data.
Enjoy!
Tradingsystem

Introduction to a Trading System 1: Setting timeframes + bonusIntroduction to a Trading System: Setting Timeframes & Logarithmic Scaling
This educational video is the first in the "Signal and Structure" series, where an experienced crypto trader with 5+ years in cryptocurrency and additional forex background shares their systematic approach to chart analysis and trading.
Key Topics Covered:
Logarithmic Scale Fundamentals
- Why log scale is essential for cryptocurrency trading
- How it provides better perspective on price movements across different time periods
- Demonstrates using Bitcoin's price history how log scale reveals the true magnitude of moves and shows market maturation
Strategic Timeframe Selection System
- Introduces a unique 5-timeframe system based on dividing by 4:
- Monthly (30 days) - the base unit
- Weekly (≈30÷4 days)
- 2-Day (≈week÷4)
- 12-Hour (48 hours÷4)
- 3-Hour (12÷4)
Trading Philosophy
- Emphasizes simplification over complexity in trading
- Explains why using non-standard timeframes (2-day instead of daily) provides an edge
- Discusses how higher timeframes show cleaner structure while lower timeframes display more chaos
- Advocates for making trading easier by reducing noise and confusion
Practical Insights
- Higher timeframes (monthly/weekly) show more reliable patterns and are watched by institutional traders
- Lower timeframes become increasingly chaotic but still contain tradeable patterns
- The importance of stepping back to see the bigger picture in markets
The instructor brings a unique perspective influenced by classic traders like Gann and Wyckoff, and has developed over 140 custom indicators for their trading system. The video sets the foundation for understanding market structure before diving into signals and trading strategies in future episodes.

XRP Bulls Are Back, Double Bottom + Divergence Signal Uptrend
XRP , After failing to break the previous low, which acted as a strong support at $2.7280, XRP has formed a Double Bottom pattern. This is a powerful bullish signal expected to push the price higher.
The price is currently rising to test the daily descending trendline shown in the chart, with a potential target of the $3.04000 zone. The bullish move is also confirmed by a Divergence pattern on the daily chart.
Additionally, the daily RSI shows an overbought signal, which can be a sign of strong buying pressure. This movement is also supported by the overall daily uptrend illustrated in the chart.
🔔 Summary:
Key Factors Supporting an Upside Move
Double Bottom Pattern
Daily Divergence
Uptrend
Daily RSI Overbought Signal
✅ Write a comment with your favorite altcoin hit the like button, and I'll provide my analysis in the reply. Trading is simpler with the right coaching.
My analyses are personal opinions, not trade setups.
Thank you for your support, and I wish you successful trades 🌹

Trading as a Probabilistic ProcessTrading as a Probabilistic Process
As mentioned in the previous post , involvement in the market occurs for a wide range of reasons, which creates structural disorder. As a result, trading must be approached with the understanding that outcomes are variable. While a setup may reach a predefined target, it may also result in partial continuation, overextension, no follow-through, or immediate reversal. We trade based on known variables and informed expectations, but the outcome may still fall outside them.
Therefore each individual trade should be viewed as a random outcome. A valid setup could lose; an invalid one could win. It is possible to follow every rule and still take a loss. It is equally possible to break all rules and still see profits. These inconsistencies can cluster into streaks, several wins or losses in a row, without indicating anything about the applied system.
To navigate this, traders should think in terms of sample size. A single trade provides limited insight, relevant information only emerges over a sequence of outcomes. Probabilistic trading means acting on repeatable conditions that show positive expectancy over time, while accepting that the result of any individual trade is unknowable.
Expected Value
Expected value is a formula to measure the long-term performance of a trading system. It represents the average outcome per trade over time, factoring in both wins and losses:
Expected Value = (Win Rate × Average Win) – (Loss Rate × Average Loss)
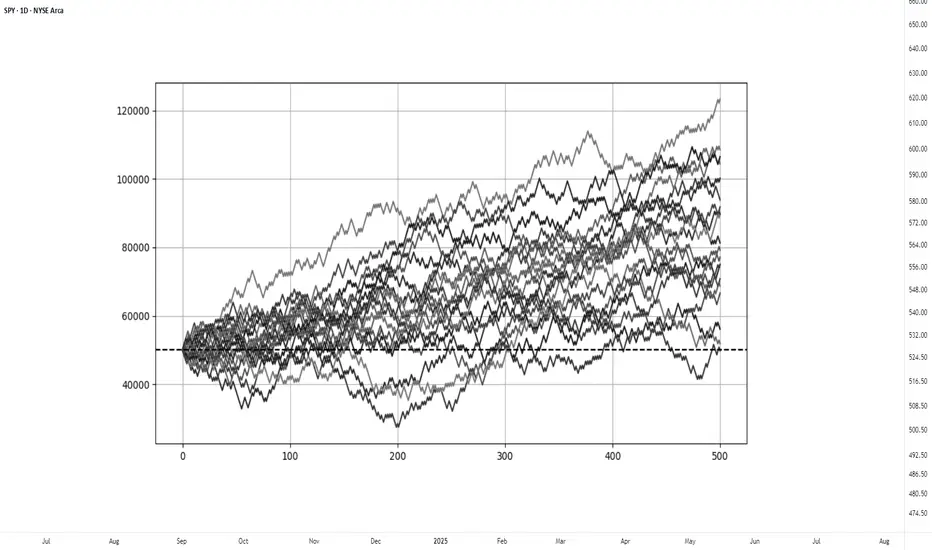
This principle can be demonstrated through simulation. A basic system with a 50% win rate and a 1.1 to 1 reward-to-risk ratio was tested over 500 trades across 20 independent runs. Each run began with a $50,000 account and applied a fixed risk of $1000 per trade. The setup, rules, and parameters remained identical throughout; the only difference was the random sequence in which wins and losses occurred.
While most runs clustered around a profitable outcome consistent with the positive expected value, several outliers demonstrated the impact of sequencing. When 250 trades had been done, one account was up more than 60% while another was down nearly 40%. In one run, the account more than doubled by the end of the 500 trades. In another, it failed to generate any meaningful profit across the entire sequence. These differences occurred not because of flaws in the system, but because of randomness in the order of outcomes.
These are known as Monte Carlo simulations, a method used to estimate possible outcomes of a system by repeatedly running it through randomized sequences. The technique is applied in many fields to model uncertainty and variation. In trading, it can be used to observe how a strategy performs across different sequences of wins and losses, helping to understand the range of outcomes that may result from probability.
Trading System Variations
Two different strategies can produce the same expected value, even if they operate on different terms. This is not a theoretical point, but a practical one that influences what kind of outcomes can be expected.
For example, System A operates with a high win rate and a lower reward-to-risk ratio. It wins 70% of the time with a 0.5 R, while System B takes the opposite approach and wins 30% of the time with a 2.5 R. If the applied risk is $1,000, the following results appear:
System A = (0.70 × 500) − (0.30 × 1,000) = 350 − 300 = $50
System B = (0.30 × 2,500) − (0.70 × 1,000) = 750 − 700 = $50
Both systems average a profit of $50 per trade, yet they are very different to trade and experience. Both are valid approaches if applied consistently. What matters is not the math alone, but whether the method can be executed consistently across the full range of outcomes.
Let’s look a bit closer into the simulations and practical implications.
The simulation above shows the higher winrate, lower reward system with an initial $100,000 balance, which made 50 independent runs of 1000 trades each. It produced an average final balance of $134,225. In terms of variance, the lowest final balance reached $99,500 while the best performer $164,000. Drawdowns remained modest, with an average of 7.67%, and only 5% of the runs ended below the initial $100,000 balance. This approach delivers more frequent rewards and a smoother equity curve, but requires strict control in terms of loss size.
The simulation above shows the lower winrate, higher reward system with an initial $100,000 balance, which made 50 independent runs of 1000 trades each. It produced an average final balance of $132,175. The variance was wider, where some run ended near $86,500 and another moved past $175,000. The drawdowns were deeper and more volatile, with an average of 21%, with the worst at 45%. This approach encounters more frequent losses but has infrequent winners that provide the performance required. This approach requires patience and mental resilience to handle frequent losses.
Practical Implications and Risk
While these simulations are static and simplified compared to real-world trading, the principle remains applicable. These results reinforce the idea that trading outcomes must be viewed probabilistically. A reasonable system can produce a wide range of results in the short term. Without sufficient sample size and risk control, even a valid approach may fail to perform. The purpose is not to predict the outcome of one trade, but to manage risk in a way that allows the account to endure variance and let statistical edge develop over time.
This randomness cannot be eliminated, but the impact can be controlled from position sizing. In case the size is too large, even a profitable system can be wiped out during an unfavorable sequence. This consideration is critical to survive long enough for the edge to express itself.
This is also the reason to remain detached from individual trades. When a trade is invalidated or risk has been exceeded, it should be treated as complete. Each outcome is part of a larger sample. Performance can only be evaluated through cumulative data, not individual trades.
Bitcoin's Support in Focus: Stay Alert for Candle Closes
BTC on the 12H looks ready to close below the recently claimed W + 5D support.
It’s a signal to stay sharp and stick to a solid plan: but not a call to action just yet.
Let’s see how the next 3 to 5 candle closes unfold.
Always take profits and manage risk.
Interaction is welcome.

ETH Daily Close Signals Entry
On the daily, ETH is closing above both the 200MA and the previous tops. PSAR on the original system has flipped, though the free-to-use version hasn’t yet.
This is a trading idea. If you choose to allocate real capital, be prepared for the possibility of loss. But if you trust the system enough to allocate capital, trust that the PSAR has flipped and today’s close marks the entry.
It’s exactly how the system defines a valid setup:
Daily close above the 200MA, with MLR > SMA > BB center.
The 12H timeframe acts as confirmation from the lower TF, and the 4H is already green and ripping.
So buckle up—this could be a ride worth taking.
Always take profits and manage risk.
Interaction is welcome.

ETH – System Trigger Hit
ETH on the 12H has just reclaimed the green line: resistance from the previous tops.
This level sits roughly midway between the 0.5 and 0.382 Fib levels, with \$3000 now looking closer than \$2500.
PSAR has just flipped above the last tops, and price is now above MLR > SMA > BB center > 200MA.
All system conditions are met for a long entry on this timeframe.
This also comes as confirmation of the daily signal entry at today closing
Always take profits and manage risk.
Interaction is welcome.

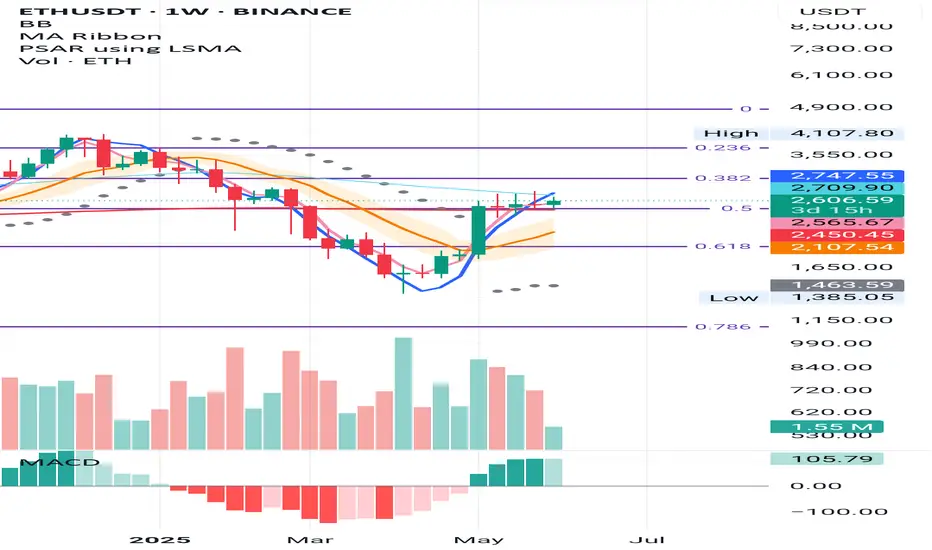
ETH Weekly – Signs Aligning for a Long Setup
ETH is forming subtle higher lows above the 0.5 Fibonacci level and the 200MA—both sitting near the same key support zone.
The 50MA is currently acting as resistance, but structurally we’re seeing MLR > SMA > BB center, and the PSAR flipped bullish since the week of May 12.
We now have all the signals needed for a valid long entry on this timeframe.
Feel free to drop your thoughts in the comments—good or bad, all engagement is appreciated.
Take profits. Manage risk. Stay sharp.
ETH Monthly – Fibonacci Structure in Play
ETH has been respecting the monthly Fibonacci levels with surprising precision.
There was a clear double top at the 0.236 Fib in May and November 2024, with a base forming at the 0.5 Fib. That same 0.5 Fib now acts as support, aligned with the 50MA.
The BB centre is currently stopping price, but for how long remains to be seen.
SMA is above MLR and rising, which supports a bullish bias.
If this structure holds, the next resistance zones may align with the higher Fib levels.
Feel free to drop your thoughts in the comments—good or bad, all engagement is appreciated.
Take profits. Manage risk. Stay sharp.

BTC 12H – Slightly Different Picture
The 12H chart tells a slightly different story.
From the PSAR point of view, price has tapped it twice, but that’s not enough for confirmation.
From the system perspective, price is trading above the BB center, with both MLR and SMA also above it—this could justify small scaling.
From the S/R view, price is currently testing weekly resistance and the dotted line marking the daily close. That’s a strong reason to apply proper risk management.
Let’s see how this unfolds.
Scaling in may be a valid option for those considering long exposure—if risk is managed properly.
Feel free to drop your thoughts in the comments—good or bad, all engagement is appreciated.
Take profits. Manage risk. Stay sharp.

BTC Daily – Mixed Signals, Patience Required
From the PSAR perspective, BTC remains in a bearish phase. We need to wait for a PSAR flip to green before considering new long entries.
From the second system view, we’re also still in bearish territory. The setup will shift once MLR crosses above the SMA and BB centre. Currently, price is holding the SMA as support and has paused at the BB centre.
Looking at S/R levels, we’ve seen a solid bounce from the 3D + 5D support and are now holding at the weekly support zone.
Let’s see how this unfolds.
Scaling in may be a valid option for those considering long exposure—if risk is managed properly.
Feel free to drop your thoughts in the comments—good or bad, all engagement is appreciated.
Take profits. Manage risk. Stay sharp.

BTC 3D – Key S/R Level in PlayBTC is currently trading below the black line, which marks the double top support/resistance level on the 3D chart.
Tonight’s 3D candle close will be important:
🔻 A close below could open the way for more downside.
🔼 A close above might invite continuation—but neither outcome is guaranteed.
🎯 The best approach? Stick to the system.
Place orders just below the last PSAR, stay disciplined, and avoid emotional decisions.
✅ Always take profits.
✅ Always manage risk.
These are the only two things we can truly control.
Thanks for reading—and if you found this helpful, feel free to react or leave a comment!

PENGU 12H – System Entry Triggered
PENGU just gave a system entry on the 12H time frame.
📌 The black line represents entry points from the 3D and 1W time frames. It has acted as a key level in the past and has now been flipped into support again.
📈 Price is currently pushing into the pink box, which may act as short-term resistance. Keep an eye on how long it takes to break through this zone—if it lingers too long, we might see a temporary rejection.
🟢 OBV is rising
🟢 MACD is turning bullish
🟢 Fundamentals look very strong
I believe PENGU still has upside potential from here.
✅ Stick to the system—no guessing tops. Let price action guide the decisions.

TOTAL3 Update: Potential Recovery on the Daily ChartLooking at TOTAL3 on the daily:
Yesterday, we saw a wick below the 200MA, but the price managed to close above it by the end of the day—a good sign for recovery. 🔄
Although the MLR < SMA < BB Center isn't ideal, we continue to monitor price action in relation to the 200MA. If we close above it again today, things might start to turn positive. 🌱
⚠️ Keep an eye on macro news and hope for no more downgrades from agencies like Moody’s.
Thanks for reading! Stay safe and manage your risk. 📊

KISS Trading SystemOverview :
Trading process should be as simple as possible. One of the simple method to trade is primarily identify direction, find a good location to entry, wait for confirmation in the location, and finally execute the trade when the risk reward ratio is good.
1. Direction
To identify direction, follow the market structure. Higher high and higher low indicates price is in a bullish trend (uptrend), while lower high and lower low indicates the price is in a bearish trend (downtrend). If there is no clear structure higher high and higher low or lower and high lower low, price is in sideways mode. Best is to avoid trade under this condition until clear trend is formed.
2. Location
Every time price create a new breakout structure, mark the the structure as our potential location for entry. There are some occasion where price does not pullback to the location and continuing the trend by creating a new breakout structure. Do not FOMO, just wait for the next location and confirmation within the location to entry and minimize your risk.
3. Confirmation
Patience is the key. Wait for price to pullback at higher time frame location, and focus for confirmation in lower time frame to entry and reduce risk. Time is fractal, the structure pattern is same on all timeframes. Choosing the right timeframe pair is crucial. Refer to table in the notes below for timeframe pairing.
4. Risk Reward
This is the main essence in trading, controlling risk and preserving capital. Entry without doubt when the risk reward are good. Execute, and trust your setup.

SOL/USDT – 3D Long Signal Active📅 April 29, 2025
The system triggered a long entry at the last 3D bar close.
Currently, the price remains around the same levels.
✅ System conditions for a long are fully met:
MLR > SMA > BB Center > PSAR
Price is trading above the 200 MA on the 3D timeframe.
⚠️ Caution:
On the 1D timeframe, price is still below the 200 MA, which suggests some lingering weakness. Proceed carefully.
📍 Strategy Plan:
Consider entering long at today’s daily close or at the next 3D bar close.
Suggested stop-loss: below the latest PSAR dot for system integrity.
🔔 Keep an eye on updates and thank you for reading! 📈📊

DOGE/USDT – 3D Long Signal Active📅 April 29, 2025
The system triggered a long entry at the last 3D bar close.
Currently, the price remains around the same levels.
✅ System conditions for a long are fully met:
MLR > SMA > BB Center > PSAR
Price is trading above the 200 MA on the 3D timeframe.
⚠️ Caution:
On the 1D timeframe, price is still below the 200 MA, which suggests some lingering weakness. Proceed carefully.
📍 Strategy Plan:
Consider entering long at today’s daily close or at the next 3D bar close.
Suggested stop-loss: below the latest PSAR dot for system integrity.
🔔 Keep an eye on updates and thank you for reading! 📈📊

XLM/USDT – 3D Long Signal Active 📅 April 29, 2025
The system triggered a long entry at the last 3D bar close.
Currently, the price remains around the same levels.
✅ System conditions for a long are fully met:
MLR > SMA > BB Center > PSAR
Price is trading above the 200 MA on the 3D timeframe.
⚠️ Caution:
On the 1D timeframe, price is still below the 200 MA, which suggests some lingering weakness. Proceed carefully.
📍 Strategy Plan:
Consider entering long at today’s daily close or at the next 3D bar close.
Suggested stop-loss: below the latest PSAR dot for system integrity.
🔔 Keep an eye on updates and thank you for reading! 📈📊

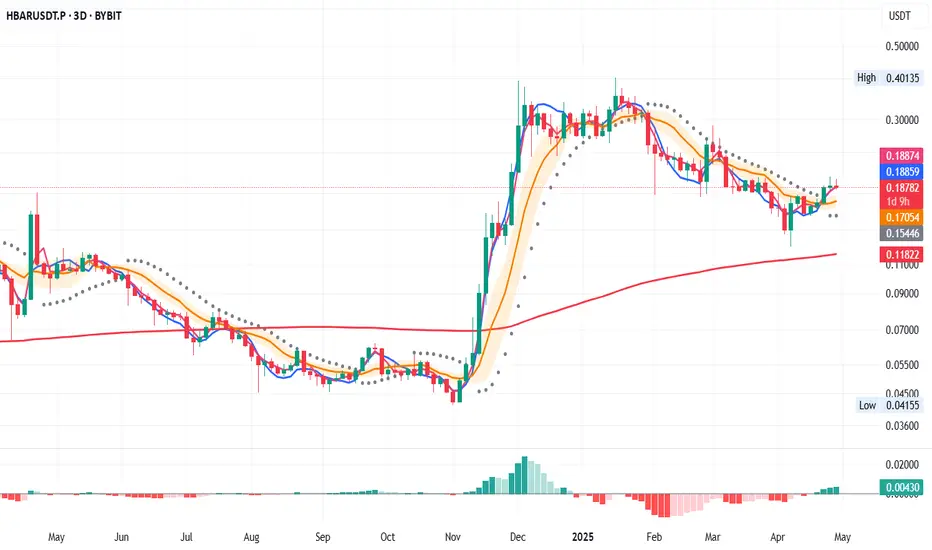
HBAR/USDT – 3D Long Signal Active📅 April 29, 2025
The system triggered a long entry at the last 3D bar close.
Currently, the price remains around the same levels.
✅ System conditions for a long are fully met:
MLR > SMA > BB Center > PSAR
Price is trading above the 200 MA on the 3D timeframe.
⚠️ Caution:
On the 1D timeframe, price is still below the 200 MA, which suggests some lingering weakness. Proceed carefully.
📍 Strategy Plan:
Consider entering long at today’s daily close or at the next 3D bar close.
Suggested stop-loss: below the latest PSAR dot for system integrity.
🔔 Keep an eye on updates and thank you for reading! 📈📊
ALGO/USDT - Long Setup Update on 3D Time Frame29.04.2025
On April 22, we had a long entry signal on the 3D time frame. As of today, the price remains around the same level.
The system’s rules are favourable for another long entry:
- Price > MLR > SMA > PSAR
- Price is above the 200 MA, reinforcing the bullish bias.
Consider a long entry at today’s close or at the close of this 3D bar. However, note that on the 1D time frame, the price is still below the 200 MA, which could act as resistance.
The PSAR stop-loss is a good option for spot trading, given its placement.
Keep an eye on updates and thank you for reading! 📈📊

BTCUSDT – System-Based Long Signal (3D Timeframe)
📅 April 19, 2025
Yesterday’s 3D candle closed with a clear PSAR flip, shifting from bearish to bullish — an early signal of potential trend reversal.
In addition, price is now trading above the 200 MA, which confirms a return into long-term bullish territory.
🟢 Based on these two system signals, we have a valid long entry setup forming.
However, the system is not fully aligned yet:
⚠️ MLR < BB Center < SMA
This suggests the internal momentum structure is still weak.
We are above 200MA and have a PSAR trigger, but the trend metrics aren't in full confluence.
📌 Strategy suggestion:
- Consider a partial spot entry only
- Avoid leverage until full confirmation
- Wait for MLR to flip above BB Center for added strength
This is a trigger-before-confirmation type of setup — and in such cases, discipline > excitement.

SUPERUSDT – Dual Timeframe Long Signal (1D & 3D)📅 April 13, 2025
So, we have another long system entry — but this one is a bit special.
✅ The long signal is confirmed on both the 1D and 3D timeframes, which adds confidence to the setup.
✅ MLR > SMA > BB Center – strong technical confluence
✅ Price > PSAR – trend shift confirmed on both timeframes
However, risk context matters:
⚠️ On the 3D, price is still below the 50 MA
⚠️ On the 1D, price is still below the 200 MA
That means momentum is building, but we’re not in full bullish structure yet.
📌 My advice:
- Don’t use leverage on this entry
- Spot only, partial size
- Don’t go all-in — system says “yes,” but structure says “wait and scale”
Discipline protects you. Emotions don’t.

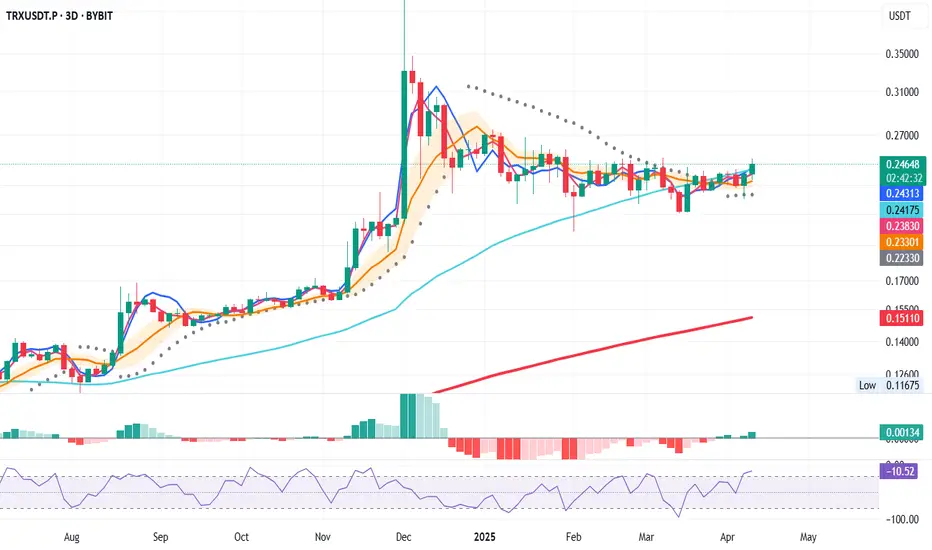
TRXUSDT – Bullish System Trigger (3D Chart)
📅 April 13, 2025
Today’s 3D bar close offers a strong bullish signal, aligning multiple system indicators in favor of a long entry.
Here’s what the system confirms:
✅ Price closed above the 50 MA – bullish structure
✅ MLR > SMA > BB Center – solid confluence
✅ Price > PSAR – trend shift confirmed
✅ Above the 200 MA – long-term trend support
Entry Strategy
- Open long at the 3D bar close
- Stop-loss below the latest PSAR dot for system integrity
📌 Note: This is a system-based entry — not a prediction.