VSAT 1W – signal restoredOn the weekly chart, ViaSat (VSAT) finally broke out of a long-term falling wedge — a textbook bullish reversal pattern. After the breakout, price pulled back perfectly into the buy zone, confirming a clean retest on the weekly.
All moving averages (MA/EMA) now sit below the price - a clear sign that buyers are in control.
Technically, the setup looks strong:
✅ wedge breakout confirmed with volume;
✅ weekly retest completed;
✅ bullish momentum building up.
First target stands at 47.11, with higher resistances at 68.63 and 97.34 if the bullish structure holds.
Fundamentally, the company is stabilizing after a tough period - cost control, steady contracts, and renewed investor interest could all support the recovery.
After all, the ticker VSAT stands for communication - and right now, the market’s message seems pretty clear: “connection restored.”
Tradingview

GOLD near Resistance ? What's next??#GOLD.. after a perfect move according to our last idea regarding gold and now market just reached near to our expected resistance area.
That is around 4115-22
Keep close and don't be lazy here.
Good luck
trade wisely

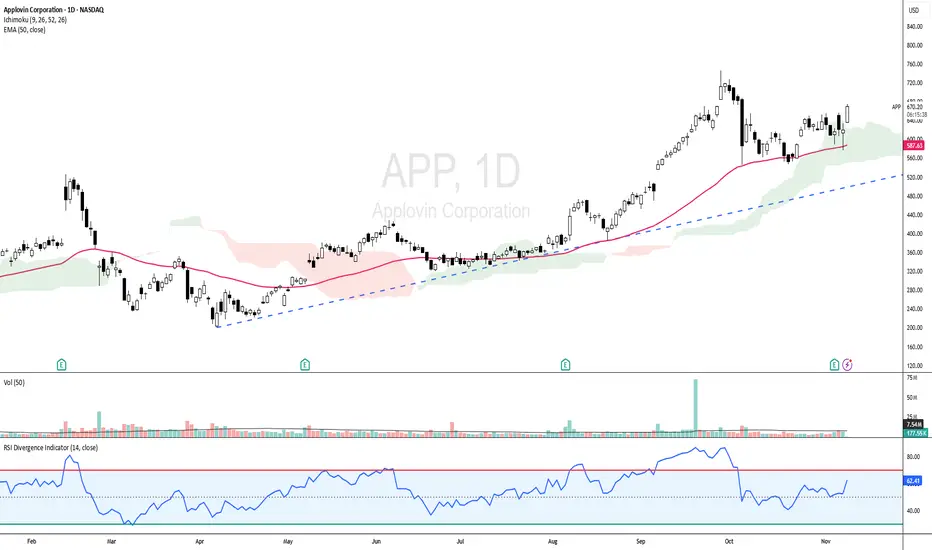
APP - UPTREND STILL INTACT!APP - CURRENT PRICE : 670.00 - 674.00
APP is showing strong bullish momentum as the price trades above the 50-day EMA and ICHIMOKU CLOUD , indicating a sustained uptrend. The RSI is in bullish territory but not yet overbought, indicating room for further upside. With the current setup, the stock has potential to retest its all-time high area if momentum continues.
ENTRY PRICE : 670.00 - 674.00
FIRST TARGET : 727.00
SECOND TARGET : 770.00
SUPPORT : 50-day EMA
Bitcoin Below a Key Resistance – Day 2👋🏻 Hey everyone! Hope you’re doing great! Welcome to SatoshiFrame channel.
✨ Today we’re diving into the 1-Hour BITCOIN analysis. Stay tuned and follow along!
🪙 On the 1-hour timeframe, Bitcoin is currently ranging below its key resistance zone at $106,590 in a multi-timeframe structure. A confirmed breakout above this level could potentially lead to further bullish momentum toward the next resistance area.
📊 Looking at Bitcoin’s volume, we can see that as price reached this crucial resistance, volume has decreased, showing more selling interest among traders. However, the interesting observation here is that even selling volume itself has slightly declined, and during the latest reaction to this resistance (in the 15-minute multi-timeframe), we witnessed an increase in buying volume.
✍️ The possible breakout scenario for this resistance is quite simple and comes with a small stop-loss range. You can consider entering a trade based on this scenario, but always remember proper risk and capital management.
↗️ Long Position Scenario 1 : Breakout above the $106,590 resistance accompanied by increasing buying volume on either the 1-hour or 15-minute multi-timeframe. If we get a candle setup (Indecision + SMA7) before and after the breakout, it can serve as a valid entry signal.
↗️ Long Position Scenario 2 : Breakout above the $106,590 resistance with rising volume and the formation of a higher low on the multi-timeframe compared to the previous low. In this case, we can enter a long position and set the stop-loss below the potential higher low.
❤️ Disclaimer : This analysis is purely based on my personal opinion and I only trade if the stated triggers are activated .

GOLD at Immediate support ? What's next ??#GOLD... Market made a fresh supporting area/region
That will be from 4078 to 4085
Keep close and sustain above means further rise expected..
Good luck
Trade wisely

XAUUSD – PRICE STRUCTURE UPDATE: MAINTAINING THE TRADING...💛 XAUUSD – PRICE STRUCTURE UPDATE: MAINTAINING THE TRADING SCENARIO 🎯
🌤 Overview
Hello everyone 💬
The price structure of gold is still on track as per the previous scenario — those who bought according to the earlier plan might have already profited and should continue to hold their position.
The price in the early Asian session has risen steadily, breaking through the 4021 area, confirming a short-term uptrend and aiming to retest the upper edge of the H4 price channel.
This is a positive signal before the market might enter a deeper correction in the mid-week sessions.
In terms of news, the latest statement from US President Trump indicates that the government shutdown might soon end — this is a factor that could cause significant USD volatility, thereby having a short-term impact on gold prices.
💹 Technical Analysis
📈 On the H4 timeframe, the price remains within the medium-term uptrend channel, maintaining the structure of “higher lows.”
🟣 The break of the 4021 area confirms that bullish momentum is prevailing, and the Sell Zone Liquidity area of 4090–4100 continues to be a short-term target for retesting.
🔹 After reaching this area, a correction is expected towards the 3920 – 3785 area (Buy Zone Fibonacci) – where buyers might return strongly.
💫 The current price signal perfectly aligns with the previous technical scenario, with no need to change the trading plan.
🎯 Reference Trading Plan
💢 SELL Scenario (short-term)
Entry: 4098–4102 | SL: 4112
TP: 4078 – 4025 – 3998 – 3920 – 3875 – 3785
💖 BUY Scenario (long-term strategy)
Entry: 3785–3789 | SL: 3777
TP: 3810 – 3865 – 3925 – 3988
🌷 Conclusion
Gold prices are moving exactly as predicted by the structure 💛
Be patient, stay disciplined, and stick to the key price areas – this is the time when persistence will provide the greatest advantage.

GOLD BUY Gold buying opportunity for a good price increase to the upside, will wait claim and use a buy limit to catch the trade

TradeCityPro | Bitcoin Daily Analysis #216👋 Welcome to TradeCity Pro!
Let’s dive into the Bitcoin analysis. The market has finally started an upward move, and the triggers we set yesterday have been activated.
⏳ 1-Hour Timeframe
Yesterday, Bitcoin created a smaller range box between the 10,601 and 10,2489 levels, and after breaking the upper range of the box, the price moved up to the upper boundary of the main box at 10,3855.
📊 Volume increased throughout this move, and the strength of the green candles grew significantly. The 10,3855 resistance was also broken, and with the RSI entering the overbought zone, a sharp upward move began.
✅ This upward move continued to 10,6412, and after reaching this level, momentum started to slow down, and RSI exited the overbought zone. The price is now ranging below 10,6412.
🚀 Today’s trigger:
The key trigger for Bitcoin today is breaking the 10,6412 level. If this level is broken, the upward move will continue.
🔽 In case of a correction, if the price forms a higher low above 10,3855, the bullish trend will remain intact, and the next upward leg could start.
⚖️ For a short position, I don’t think we should pursue it yet. We should wait for the trend to turn bearish again. The confirmation for a bearish trend will come if the price stabilizes below 10,3855.
❌ Disclaimer ❌
Trading futures is highly risky and dangerous. If you're not an expert, these triggers may not be suitable for you. You should first learn risk and capital management. You can also use the educational content from this channel.
Finally, these triggers reflect my personal opinions on price action, and the market may move completely against this analysis. So, do your own research before opening any position.

EURJPY BUY THE TREND Will be using a buy limit to enter a buy on Eurjpy and will be keeping things simple with the trend following , very good trade and low risk higher chance to buy than sell

It might let us down once again !!!Cardano’s price on the 1-hour timeframe is forming an ascending triangle pattern.
If this pattern breaks to the upside, there’s hope that the AB leg will equal the CD leg, potentially pushing the price up to around $0.60.
However, since crypto often disappoints expectations, it might let us down once again—so stay cautious.

TradeCityPro | WLFI Coin: Eyes on Trump’s Project for Big Moves👋 Welcome to TradeCity Pro!
In this analysis, I want to review the WLFI coin.
✔️ Before we dive into the analysis, let me tell you that this coin is part of the World Liberty Finance project.
🔔 This is a DeFi project linked to Trump, which hasn't fully launched yet, and its token was recently listed. Given Trump's significant influence on social media, it might be worth keeping an eye on this coin, as it could potentially make sharp moves.
📅 Daily Timeframe
Since its listing in September, this coin has been trading in a range below the 0.2423 resistance level for about a month. After that, it experienced a sharp drop in line with the overall market downturn on October 10th.
📊 Currently, the main support level for this coin is at 0.1127, and the price is facing resistance at 0.1518.
🧩 One thing to note is that this chart is only two months old, so all the support and resistance levels in it have been formed within this short period. Therefore, don't view these levels as extremely strong and unbreakable. The token hasn't fully discovered its real value yet.
🧮 Moving on with the analysis:
If the price breaks 0.1518, the next resistance levels are 0.1804 and 0.2423. I will personally start buying this coin once the 0.2423 level is broken. The earlier trigger would be the break of 0.1518.
💡 For a bearish scenario, it’s quite clear:
A break of 0.1127 would confirm the start of a downward move.
📝 Final Thoughts
Stay calm, trade wisely, and let's capture the market's best opportunities!
This analysis reflects our opinions and is not financial advice.
Share your thoughts in the comments, and don’t forget to share this analysis with your friends! ❤️

GOLD at support? holds or not??#GOLD... market just make a fresh supporting area that is around 4000
keep close and sustains above 4K means there is further bounce on the table.
stay sharp...
good luck
trade wisely

LiamTrading – XAUUSD | Early Week Bullish Scenario...LiamTrading – XAUUSD | Early Week Bullish Scenario: Successful Breakout, Awaiting Retest at 4056 & Deep Buy at 3998–4000
The price has just broken out of the accumulation box and accelerated as per the weekend scenario. Bullish bias for the day, with a near-term target of 4080 → 4110; the 4110–4112 zone is a suitable psychological resistance for scalping. Prioritize buying at the 4056 retest or deep buying at 3998–4000 after a liquidity sweep and rebound.
The U.S. Senate takes further procedural steps to end the shutdown. Systemic risk expectations cool down → pressure on USD decreases, supporting gold in the short term.
The process has a few steps left, volatility around news hours can be sharp → adhere to technicals, manage risks tightly.
Technical Analysis (H1/H2) – Volume Profile • Trendline • S/R • Fibonacci
Structure & Trendline: Breakout upwards, trend-following capital dominates. Short-term uptrend as long as price holds above 4056 (retest point of breakout zone).
Support/Resistance (S/R):
Support: 4056 (retest), 4025–4038 (FVG filling liquidity), 3998–4000 (Buy Zone Liquidity).
Resistance: 4110–4112 (psychological + short-term supply cluster), 4160–4165 (Fibo extension).
Fibonacci Extension:
1.618 coincides with 4110–4112 → likely reaction/scalping.
2.272 targets ~4160 → extended target/final profit-taking.
Today's Trading Scenario
Continuation Buy (priority)
Entry: 4056–4060 (retest breakout zone)
SL: 4048
TP: 4080 → 4110 → 4160
Management: Move SL to breakeven at +1R; partial take at 4080/4110.
Deep Liquidity Buy (cautious volume)
Entry: 3998–4000
SL: 3992
TP: 4020 → 4045 → 4080 → 4110
Note: Enter only with clear rejection candle (long lower wick, M1–M15 reversal) or after FVG fill and rebound.
Scalp Sell at Psychological Resistance (counter-trend)
Entry: 4110–4112
SL: 4118
TP: 4100 → 4080 → 4065
Note: Cancel trade if H1 closes strongly above 4112 or if bullish momentum is too strong (breakout with volume).
Invalidation Conditions & Notes
Short-term bullish bias invalidated if H1 closes below 4048 → may test deeper 4025–4038 or 3998–4000.
Avoid entering trades close to news hours about the U.S. government reopening process.
Risk per trade: 0.5–1%, adhere to discipline of moving SL at +1R.
If you find this useful, comment on the price levels you're watching and hit Follow on LiamTrading for daily updates.

ASTS 4H: space internet or orbital dream?AST SpaceMobile (ASTS) is consolidating above the $61–69 zone, right near the 0.618 Fibonacci level of its last major rally. On the 4H chart, momentum shows early reversal signs: falling volume on pullbacks, stochastic turning up, and buyers defending local lows. The bullish setup holds as long as price stays above $61, with upside targets at $100 and $135 where the extension projection aligns.
Fundamentally , as of November 2025, ASTS stands out as one of the most promising yet capital-intensive players in the satellite telecom industry. The company completed deployment of its BlueWalker test constellation and is preparing for commercial rollout of direct-to-cell satellite connectivity. Successful phone-to-satellite calls using standard smartphones - validated with AT&T and Vodafone - mark a true technological milestone, positioning ASTS as a potential first-mover in global space-based mobile internet.
Revenue for the first nine months of 2025 reached roughly $55M, almost double last year’s level, but operating losses still exceed $300M due to high manufacturing and launch costs. The company holds about $180M in cash versus ~$260M in debt, continuing to rely on strategic partnerships and funding programs to maintain liquidity. The key upcoming catalyst is the commercial network activation in 2026 in cooperation with AT&T, Vodafone, and Rakuten, which could dramatically change valuation if successful.
With investor attention shifting back to space communications, competition with Starlink and Lynk Global is heating up, but ASTS’s advantage lies in using standard smartphones without extra hardware. Risks remain - high capital needs, launch delays, and dependency on partner timelines - yet the reward potential is extraordinary if execution holds.
Tactically, staying above $61 keeps the bullish structure alive with $100 and $135 as primary targets. A breakdown below $60 would negate the setup.
They’ve already connected phones to space - now let’s see if they can connect revenue to profit.

$ASTER Update📊 SEED_WANDERIN_JIMZIP900:ASTER Update
SEED_WANDERIN_JIMZIP900:ASTER is testing the red resistance zone 🔴
If it breaks out above, it could confirm a bullish setup 📈
The first target would be the green line level 🟢

$ZEC Update📊 CRYPTOCAP:ZEC Update
CRYPTOCAP:ZEC is testing the red resistance zone 🔴
If it breaks out above, it could confirm a bullish setup 📈
The first target would be the green line level 🟢
$VIRTUAL Update📊 SPARKS:VIRTUAL Update
SPARKS:VIRTUAL is testing the red resistance zone 🔴
If it breaks out above, it could confirm a bullish setup 📈
The first target would be the green line level 🟢

$PUMP Update📊 NYSE:PUMP Update
NYSE:PUMP is testing the red resistance zone 🔴
If it breaks out above, it could confirm a bullish setup 📈
The first target would be the green line level 🟢

BTCUSD – Signs of Recovery Within the Downward Channel?Currently, BTC is moving within a clear descending channel on the 4H timeframe, but bearish momentum has started to weaken. The 99,600 USD zone is acting as a key support level , where strong buying pressure tends to appear whenever price approaches this area.
The price structure suggests a possible retest of this support zone , followed by a rebound toward the upper trendline of the channel around 105,000 USD. The formation of higher lows in the short term indicates that buyers are gradually regaining control of the market.
I expect BTC to hold above 99,600 USD and start forming a short-term bullish reversal . If price breaks above the 105,000 USD resistance zone, the uptrend will likely be confirmed, opening the way toward 108,000 USD in the upcoming sessions.
Main Scenario:
Prefer Buy positions near 99,600–100,000 USD, taking short-term profits at 105,000 USD.
The bullish outlook remains valid as long as price holds above 99,000 USD.

USDCAD: trend reversal confirmed, swing position in playPrice broke the descending trendline and retested it, confirming a structural reversal. After the breakout, USDCAD formed a correction and tested the trendline again, creating a demand zone. Price holds above EMA 50 / EMA 100 and is heading toward EMA 200, which may act as resistance before further continuation. The current move forms a swing structure: correction completed inside Fibonacci 0.382–0.618 (1.3793–1.3972), and buyers continue to defend the trendline. A breakout above 1.4148 opens the path to the resistance zone at 1.4265 (target 1) and 1.4380 (target 2). Tactical plan: look for long entries after confirmation on lower timeframes. Invalidation: breakdown of the trendline and move below 1.3850.
USD remains supported by strong macro data and higher rate expectations from the Fed. CAD is under pressure due to weak oil momentum and a dovish stance from the Bank of Canada. Divergence in monetary policy supports bullish continuation in USDCAD.
The swing remains valid as long as the trendline holds. No need to predict tops. Follow structure, not emotions.

TRUST Update📊 TRUST Update
TRUST is testing the red resistance zone 🔴
If it breaks out above, it could confirm a bullish setup 📈
The first target would be the green line level 🟢

$STRK Update📊 NASDAQ:STRK Update
NASDAQ:STRK is testing the red resistance zone 🔴
If it breaks out above, it could confirm a bullish setup 📈
The first target would be the green line level 🟢

$UNI Update📊 CRYPTOCAP:UNI Update
CRYPTOCAP:UNI is testing the 🔴 resistance zone — a breakout could confirm a bullish setup 📈
If confirmed, first target is the 🟢 level —
