EUR/USD: Cycle Analysis You Can’t IgnoreThis chart reveals a dominant 220-bar cycle in the EUR/USD pair ..a repeating rhythm that has shaped market structure for decades. Out of the last 13 major cycle signals, 10 have delivered strong trade results, each aligning closely with turning points in the broader trend.
Every major turning point has followed this same cyclical rhythm, proving that even through major global shifts, the market still moves in repeating, fractal patterns.
Cycle and fractal analysis continue to provide some of the most objective timing tools in modern trading. While many still dismiss cycles as “theoretical,” the data says otherwise.
Question for You:
Are you still dismissing cycle analysis, or are you ready to use it to stay ahead of the next major move? Watch the current cycle high!
Tradingview

GOLD Resistance? what's next??#GOLD.. perfect move as per our last idea regarding gold cut n reverse area.
now market just broke his supporting region and if market hold that region than it will convert to resistance area.
that is around 4281-892 to 4287-88
keep close and holding or that region means we can expect a further dip .
NOTE: we will go for cut n reverse above that region on confirmation.
good luck
trade wisely

TradeCityPro | Bitcoin Daily Analysis #202👋 Welcome to TradeCity Pro!
Let's dive into the Bitcoin analysis. The market has dropped again today. Let's review today's entry points together.
⏳ 1-Hour Timeframe
Yesterday, Bitcoin was rejected from the resistance it created at 111645, and with the bearish structure it formed, it made a bearish move after breaking 110213.
💥 The reason I removed the zone is that the price no longer reacts to it, and it seems that a box has formed between 111645 and 106319.
✅ The trigger that the price is currently on is the 107486 zone. Breaking this zone can give us a very risky and short-term short position.
✨ The RSI oscillator is near the Oversell zone, and with stabilization below this zone, there is a higher chance of a more significant bearish move with more momentum.
🔍 However, I can't rely much on momentum oscillators like RSI in these market conditions since there isn't a clear trend, and we don't have significant momentum to analyze the market with.
🧩 In these conditions, I believe the best tool to use is volume. Right now, selling volume is higher in the market, and in this bearish correction, the volume is decreasing. So, by breaking 107486, we can open a short position.
⚡️ If the market forms more structure and a long trigger appears, we can also open a long position after breaking the trigger.
💡 But the main triggers for long are breaking 111645, and for short, it's breaking 106319. The triggers between these two zones are very risky positions, and I won’t open a position with them. I prefer to wait for the main triggers.
❌ Disclaimer ❌
Trading futures is highly risky and dangerous. If you're not an expert, these triggers may not be suitable for you. You should first learn risk and capital management. You can also use the educational content from this channel.
Finally, these triggers reflect my personal opinions on price action, and the market may move completely against this analysis. So, do your own research before opening any position.

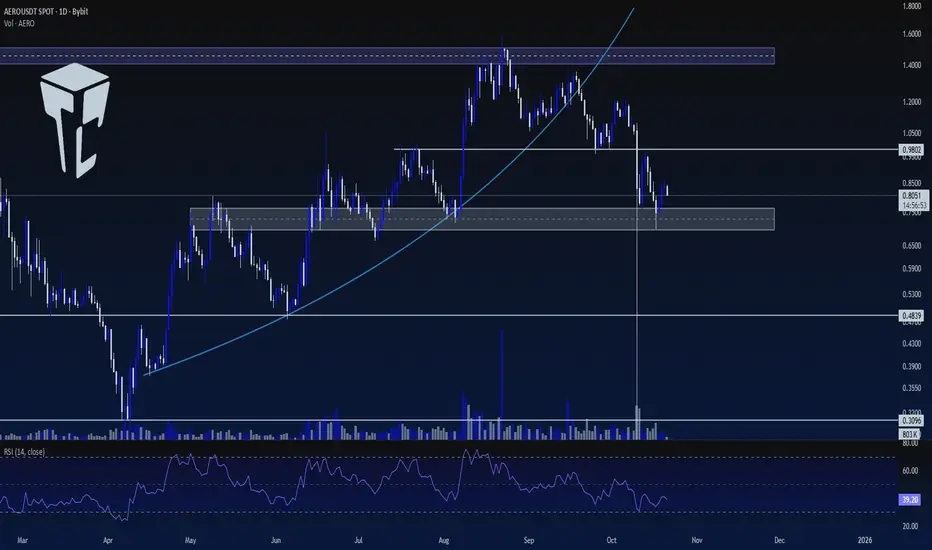
TradeCityPro | AERO: Testing Support After Trendline Break👋 Welcome to TradeCity Pro!
In this analysis, I want to review the AERO coin for you. This project is one of the well-known DEXs, ranked 84th on CoinMarketCap with a market cap of $727 million.
📅 Daily Timeframe
In the daily timeframe, since the last time I analyzed it for you, the coin has been rejected from its resistance zone and has broken its curved trendline.
✨ With the break of this trendline and the activation of the 0.9802 trigger, the bearish move of this coin has continued, and the price has dropped to around $0.7.
💥 Currently, the price is still sitting on this support zone and has penetrated it twice so far. If this level breaks, the trend of this coin will turn bearish.
🧮 In that case, we can open a short position on the break of this zone. The next support levels are 0.4839 and 0.3096.
📊 For a long position, we can act after the price stabilizes above 0.9802. The main trigger for the bullish trend will be breaking the 1.5$ zone.
📝 Final Thoughts
Stay calm, trade wisely, and let's capture the market's best opportunities!
This analysis reflects our opinions and is not financial advice.
Share your thoughts in the comments, and don’t forget to share this analysis with your friends! ❤️
BTC/USD: Downtrend After RecoveryHello Traders,
Bitcoin is facing a strong downtrend after the weekend recovery lost momentum, with the cryptocurrency lagging behind other risk markets in gaining momentum, thanks to easing US-China trade tensions. Despite an improved risk sentiment, Bitcoin failed to maintain above the 110,000 USD level.
The BTC/USD chart shows a strong bearish pattern. After hitting a high earlier in the month, a sharp decline pulled Bitcoin away from its record highs, wiping out approximately 500 billion USD in market capitalization.
Forecasts suggest that BTC/USD may continue to decline towards support levels at 103,500 USD and 97,900 USD, with TP1 and TP2 targets respectively.
Other News:
Bitcoin is struggling to maintain above 110,000 USD after a sudden drop in early October, increasing risk-averse sentiment in the cryptocurrency market. The optimism surrounding "uptober" is also quickly fading, with Bitcoin showing a loss of over 2% for the month.

BTC 1H Analysis | Day 6🥳 Hey everyone! Hope you’re doing great! Welcome to SatoshiFrame channel.
✨ Today we’re diving into the 1-Hour Bitcoin analysis. Stay tuned and follow along!
👀 After faking the 111377$ resistance area, Bitcoin ran its stop-hunts and then moved toward its supports. In the process, after breaking the 109383$ support, it headed toward its current support in the 107508$ price area.
🔍 The exhaustion of buyers’ strength and the unusual participation of TakerSeller at the 111377$ price caused selling pressure on Bitcoin, making sellers the winners from that area. Bitcoin is now near its support, and the next resistances are at 109383$ and 111377$. With a break of these zones, it can move further upward.
🧮 On the RSI oscillator, we see that after losing the 50 zone, it moved strongly toward the oversell area and stayed there for a very short time—so short that we can call it a fakeout—and it formed a low near the 30 area. Now, losing the 30 zone and entering Oversell can be a confirmation for more selling pressure. The RSI resistance zone is at 50, and once the oscillation range passes above this zone, long-side momentum increases.
🕯 We’re going to check volume to understand better and get more data. After approaching its resistance, Bitcoin was accompanied by a decrease in buy volume, and subsequently sellers took control of the market; with increasing sell volume, Bitcoin’s price moved downward.
🧠 For a Bitcoin position we have 2 scenarios on the table that, if they occur, we can evaluate a position.
🟢 Long scenario: Break of the 109383$ resistance area and the oscillation limit crossing above the RSI 50 zone, together with increasing buy volume, with maker buyers also participating in this scenario for a price jump.
🔴 Short scenario: Break of the current support along with more selling pressure on Bitcoin, losing the 30 oscillation zone and RSI entering the oversell area.
❤️ Disclaimer : This analysis is purely based on my personal opinion and I only trade if the stated triggers are activated .

US100: Needs a healthy pullback before breaking highs🧭 SKILLING:US100 (30-Min Chart) – The Market Needs a Pause Before the Breakout
After a strong recovery from the 24,200 area , the US100 has shown an impressive upward acceleration, forming a steep speed line that pushed price back toward the previous highs around 25,150 – 25,250 — a major resistance zone where sellers previously dominated.
However, as price reaches this area, the bullish momentum is starting to fade. Smaller candles and indecisive movements reveal hesitation — buyers are still in control, but the strength that carried the market this far is beginning to weaken.
If we look closely at the market structure, it’s clear that the index has been trying to reclaim the entire prior range, but that effort hasn’t come easy. After such a fast rally, the market looks overextended, and bulls may need a healthy pullback to gather enough energy for a real breakout.
________________________________________
🔍 Technical Outlook
• The 25,150 – 25,250 zone remains the key resistance area. If price keeps getting rejected here, short-term sellers might step in.
• A corrective move toward 24,850 – 24,950 (the pink zone) would not be surprising.
• That area should be watched closely — if buyers defend it strongly, it could become the launchpad for another push toward new highs.
________________________________________
🎯 Personal View
The overall structure still favors the bullish side, but momentum needs a reset.
A short-term pullback shouldn’t be seen as weakness — it’s an opportunity for the market to rebalance before the next leg up.
If the 24,850 zone holds, the probability of a true breakout above 25,250 increases significantly, potentially opening room toward 25,400 – 25,500 in the next sessions.
________________________________________
💬 In summary:
The US100 has worked hard to reclaim lost ground, but breaking above the previous top will require fresh momentum. A short-term correction could be exactly what the market needs to build a stronger foundation for a sustainable rally.
Please like and comment below to support our traders. Your reactions will motivate us to do more analysis in the future 🙏✨
Harry Andrew @ ZuperView

TSLA – Sideways Accumulation Phase Ahead of Major NewsTesla’s stock is currently showing a stable sideways movement around the 430–445 USD range as the market awaits the company’s Q3 earnings report (on October 22).
Recent news reflects cautious investor sentiment , especially after ISS recommended rejecting Elon Musk’s massive compensation package and amid forecasts suggesting a slight decline in Q3 profits.
On the 4-hour chart, TSLA continues to maintain a medium-term uptrend, with prices oscillating around the EMA34 and EMA89, which act as equilibrium zones.
The 432 USD area remains the main support, while 493 USD stands as a key resistance level.
The chart indicates a high likelihood that the price will continue sideways within this range until the market reacts more clearly after the earnings release.
Summary
Currently, TSLA is in an accumulation phase , reflecting a tug-of-war between expectations of increased production and concerns over profit margin pressures.
In the short term, the trend is expected to remain sideways with a slight bullish bias, awaiting a potential breakout driven by the upcoming earnings announcement.

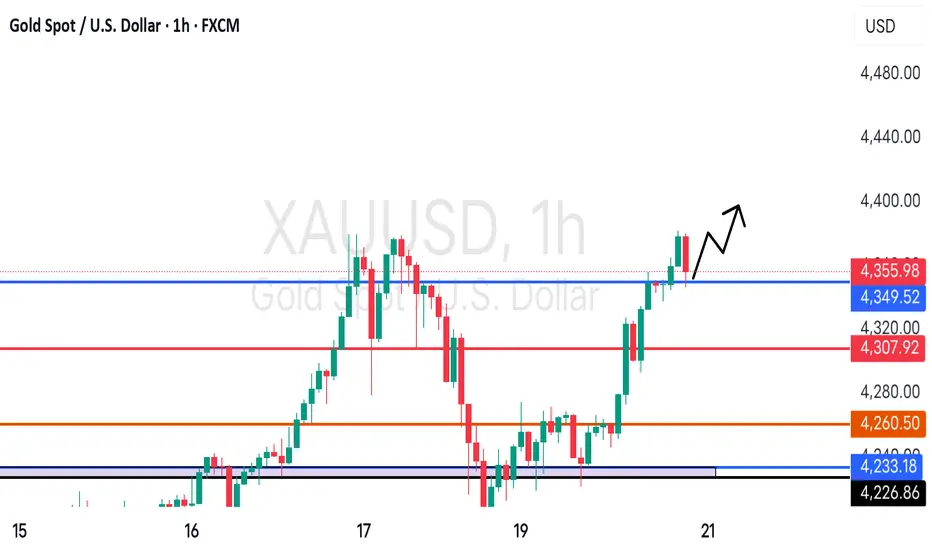
GOLD at Immediate supporting area? What's next??#GOLD.. perfect move as per our last couple of ideas regarding gold and now again market at his current immediate supporting level.
Tha tis around 4349-50
Keep close and sustain above means another rise can happen anytime..
Note: we will go for cut n reverse below 4349 on confirmation.
Good luck
Trade wisely
TradeCityPro | WALUSDT Could We See a 50% Move Soon?👋 Welcome to TradeCityPro Channel!
Let’s take a closer look at the WALUSDT chart on the 4-hour timeframe — a setup that might be preparing for a major move.
🌐 Overview of Bitcoin
Before we begin, let me remind you that we’ve moved the Bitcoin analysis section to a separate daily report at your request, so we can go into more detail about Bitcoin’s condition, price action, and dominance:
After the sharp breakdown from the 0.3633 level, WAL experienced a strong bearish wave that pushed the price down to a new support zone. Since then, the price has started to accumulate within a clear 4-hour range, suggesting that market participants are waiting for confirmation before the next big move.
This accumulation phase is important because such zones often act as the foundation for explosive movements once price breaks out — either upward or downward.
🔹 Bullish scenario (Long setup):
If price manages to break above 0.2520 with noticeable volume, it could trigger a strong bullish move. This breakout would signal that buyers have regained control, and we could see a rapid move toward higher resistance zones — potentially offering up to 50% upside from the current range. The key here is volume confirmation — without it, the breakout could turn into a fake-out.
🔹 Bearish scenario (Short setup):
On the other hand, the bearish trigger lies at the 0.1993 support. If the price decisively breaks and closes below this level, it would confirm that sellers are in control. However, before opening a short position, we want to see the price retest this zone (a rejection from below) to confirm the breakdown. This would reduce risk and provide a safer entry opportunity.
In summary, WALUSDT is currently in a neutral-to-accumulation zone — the breakout direction will define the next strong move. Traders should stay patient, monitor volume closely, and be ready to act once one of these key levels gives way.
📝 Final Thoughts
Stay calm, trade wisely, and let's capture the market's best opportunities!
This analysis reflects our opinions and is not financial advice.

ZONAUSDT Coin Analysis and CommentaryZONAUSDT Coin Analysis and Commentary
ZORA Coin indicators are currently in a negative condition. In the daily technical outlook, selling pressure is expected to continue. In a possible pullback, the 0.08479 support level will be monitored. If this level is broken downward, a decline toward the 21-day moving average (0.074807) may occur. If the price stabilizes around this average, it could create an opportunity for another upward move in the coming weeks. In a potential positive scenario, the 0.100768 resistance level is significant, and the price must break above it. Due to the negative indicators, our overall outlook for ZORA Coin remains bearish.
Resistance: 0,100768 - 0,119190
Support: 0,084799 - 0,73306
We’d appreciate it if you could boost our posts and share them on your social media. 🚀
Legal Disclaimer:
The information, comments, and recommendations contained herein do not constitute investment advice. Investment advisory services are provided only within the framework of an investment advisory agreement to be signed between the investor and authorized institutions such as brokerage firms, portfolio management companies, and non-deposit banks.
The opinions expressed here are personal views and may not be suitable for your financial situation, risk profile, or return preferences. Therefore, no investment decisions should be made based solely on the information and opinions presented on this page.

TradeCityPro | Bitcoin Daily Analysis #201👋 Welcome to TradeCity Pro!
Let’s dive into Bitcoin analysis—its bullish trend seems to have started again, so it’s very important to analyze it well for the new week.
⏳ 1-Hour Timeframe
Yesterday, Bitcoin formed a range box between 106319 and 107301, and by breaking the top of this box, it began an upward move.
📊 After breaking this box, buying volume increased sharply, and after a pullback to this area, the move continued up to 111645.
✔️ Now the price has returned above the 109000 zone, but it still hasn’t managed to hold above this area.
⭐ With a break of 111645, we can confirm that price has stabilized above the 109000 zone.
🔍 In that case, we can enter a long position on the break of 111645; and at the same time, we’ll confirm that the break of 109000 was a fake-out.
💥 The trigger on the RSI is the 74.53 level. With RSI entering Overbought and breaking 74.53, the next bullish leg can begin.
❌ Disclaimer ❌
Trading futures is highly risky and dangerous. If you're not an expert, these triggers may not be suitable for you. You should first learn risk and capital management. You can also use the educational content from this channel.
Finally, these triggers reflect my personal opinions on price action, and the market may move completely against this analysis. So, do your own research before opening any position.

GOLD at Breakout Level? what's next??GOLD -- perfect move as per our last couple of ideas regarding gold and now market again near to his current resistance and upside breakout area that is 4260-61
keep close that area because if market sustain above that level than we can expect further rise in gold prices.
good luck
trade wisely

ETH 4H Analysis | Day 4🥳 Hey everyone! Hope you’re doing great! Welcome to SatoshiFrame channel .
✨ Today we’re diving into the 4-Hour Ethereum analysis. Stay tuned and follow along!
👀 Ethereum, the best and largest altcoin in our market, has also broken its descending trendline just like Bitcoin, and the long position scenario we discussed earlier has pretty much played out — I hope you took advantage of it.
🔍 After breaking through its previous resistances, Ethereum is now facing a new resistance area where some sellers have stepped in and some buyers are taking profits. There’s a possibility of a short-term pause in price movement. This zone has created a trigger for us, and the next, more logical long triggers for Ethereum are at $4,252 and $4,723. A breakout above these levels could kick off a strong upward move.
🧮 Looking at the RSI oscillator, it’s approaching the 70 zone but has been rejected near that level. For a confirmed breakout above $4,078, RSI needs to enter the overbought region. There’s also a support zone around 50, which could act as a rebound area for oscillatory movement. Right now, RSI has two key zones — 50 and 70 — that define its structure.
🕯 Notice the Ethereum volume behavior: to break through both static and dynamic resistance zones, the volume increased — this happened because a large number of sell orders were stacked in that area, and those orders needed to be filled before price could move upward smoothly. After that breakout, buying volume started to decline slightly, meaning both price and volume are now resting. For Ethereum to break this resistance zone, we either need sell orders to be absorbed or short positions to get squeezed by trapped traders.
🧠 We can outline a few possible scenarios for Ethereum’s position — some of them might be slightly more complex to manage:
🟢 Long Position Scenario 1
We need patience and a price cooldown. Wait for Ethereum to touch its nearest support zone, then rise with increasing volume. If during this move we see setup candles along with a resistance breakout, we can enter the position with a tight stop size.
🟢 Long Position Scenario 2
We can use an order-book stop-buy setup at Ethereum’s resistance and place a wider stop to catch any breakout spike. This allows participation in a potential price surge and can yield solid profit — though these setups usually take longer to reach an ideal risk-to-reward ratio.
🟢 Long Position Scenario 3
This one’s less likely but still worth noting: Ethereum could break its resistance with rising volume, then pull back to retest that same resistance (now turned support). Afterward, if we see volume increase, setup candles, and a confirmed pullback breakout, we can enter with a small stop size.
🔴 Short Position Scenario
A short setup would only make sense if the micro-buyer zone fails, accompanied by heavy whale candles, strong selling pressure, and an overall market crash.
❤️ Disclaimer : This analysis is purely based on my personal opinion and I only trade if the stated triggers are activated .

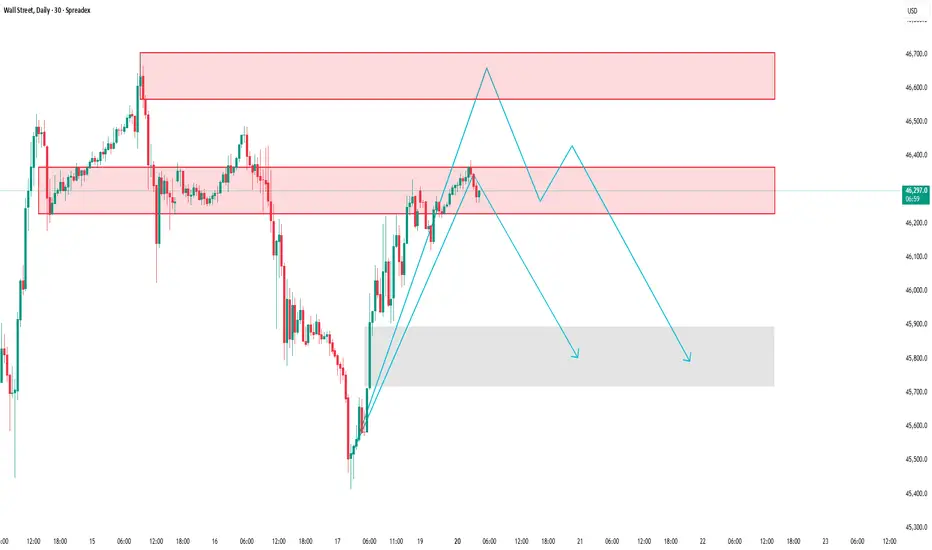
US30: Testing key supply zone, possible pullback ahead
SPREADEX:DJI – Price Reaction at Supply Zone | Possible Short-Term Correction
Timeframe: 30-Minute Chart
Analysis Style: Price Action • Supply & Demand • Market Structure
________________________________________
🧭 Market Context
After a strong rally from the lower demand zone, the Wall Street Index is now approaching a key supply area that previously triggered a sharp downward move.
At this level, sellers are beginning to step in again, and price momentum is starting to fade — suggesting a potential short-term correction ahead.
________________________________________
🧩 Market Structure & Key Zones
🔴 Supply Zone #1: 46,227 – 46,370
→ The first reaction zone, where previous selling pressure started a strong decline.
🔴 Supply Zone #2 (Major Resistance): 46,572 – 46,700
→ A higher zone where strong bearish momentum originated before.
🟢 Demand Zone: 45,900 – 45,700
→ A previous accumulation area that fueled the recent bullish leg — possible support zone if price pulls back.
________________________________________
📊 Current Price Behavior
Price has reached the 46,227 – 46,370 area and is showing signs of buyer exhaustion.
Multiple rejections and slower bullish candles near this level indicate a loss of momentum.
If the short-term bullish structure breaks, the market may shift toward a corrective phase.
________________________________________
📉 Trading Scenario
✅ Primary Scenario (Bearish Reaction Expected):
1. Price might retest 46,229–46,400 once more.
2. Failure to break above this level could lead to a downward “push.”
3. Target zone for the correction: 45,800 – 45,900.
⚙️ Alternative Scenario:
• If price closes clearly above 46,400, the short-term bearish setup becomes invalid.
• In that case, the next resistance to watch lies around 46,600 – 46,700.
________________________________________
💡 Conclusion
The Wall Street Index is currently testing a critical supply zone with visible signs of slowing momentum.
Unless bulls regain control above 46,400, the market may experience a short-term pullback toward the lower demand area.
This analysis is for educational and informational purposes only — not financial advice. Always confirm with your own price action and risk management strategy before making any trading decisions.
Please like and comment below to support our traders. Your reactions will motivate us to do more analysis in the future 🙏✨
Harry Andrew @ ZuperView
BTC 4H Analysis | Day 5🥳 Hey everyone! Hope you’re doing great! Welcome to SatoshiFrame channel .
✨ Today we’re diving into the 4-Hour Bitcoin analysis. Stay tuned and follow along!
👀 After breaking out of the descending channel and confirming the long setup I explained in the previous post, Bitcoin moved upward and easily broke through its Maker-buyer zone.
🔍 Over the past two market-holiday days, Bitcoin consolidated in a multi-timeframe accumulation phase with a ceiling at $107,356, which was easily breached. The price then advanced toward its higher-level key resistances. It’s now trading between $110,500 and $113,000 — the $113,000 zone is our long trigger since price has struggled there multiple times before. This makes it a bit risky, but if the upward movement continues, the next resistances could be at $115,800 and $120,836.
🧮 Looking at the RSI oscillator, it has comfortably passed the 50 level on the 4-hour chart and is now heading toward the overbought zone, facing a key resistance at 70. This 70 level overlaps with the 50 zone on the daily timeframe, meaning that if RSI enters overbought on the 4-hour, the daily will just be shifting from a bearish swing phase to a long-position momentum phase — so the 70 zone is crucial.
🕯 If you check the lower-volume section of the chart, you’ll notice something interesting: the breakout above the two-day accumulation range came with a clear rise in buy volume, which helped Bitcoin easily break both the resistance area and the descending trendline (the upper boundary of the previous channel). This suggests Bitcoin may soon take a volume or price correction to gain more strength for another upward move.
⏰ During today’s New York session, we might see some strong moves. Remember last week when U.S. investors were selling off their ETF holdings, and the market was hesitant to buy? That fear caused weak participation. This time, we may have a reason to stay active during New York hours as sentiment shifts.
🧠 Here are the two key scenarios to watch:
🟢 Long Position Scenario
Wait for Bitcoin to react either to the micro-buyer zone or to the $113,000 area. If we see a pullback followed by an indecision candle (confirmation setup) touching the SMA-7, that’s our entry cue — ideally with a tighter stop size.
🔴 Short Position Scenario
Ignore shorts for now. Bitcoin already completed its second downward wave with an imbalanced slope, and over the last two days, seller momentum has weakened. Buyers are now driving price through resistance levels, so shorting here would go against the current flow.
❤️ Disclaimer : This analysis is purely based on my personal opinion and I only trade if the stated triggers are activated .

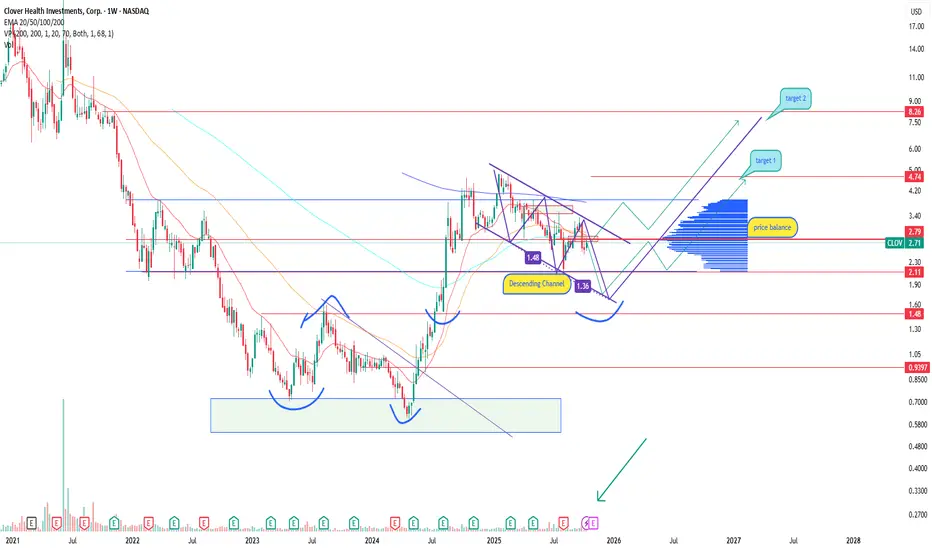
Topic: Clover Health growth emerging after a long declineClover Health (CLOV) stock is trading within a descending channel, approaching the lower boundary around 1.36–1.48, which previously acted as a demand zone. Rising volume suggests renewed buyer interest, and the flattening EMA 50/200 lines point to a potential trend reversal. A breakout above 2.80 could unlock targets at 4.74 and 8.26 — key supply levels.
Clover Health is a health-tech company providing AI-driven healthcare insurance and analytics solutions. After a restructuring phase and a reduction in losses, the company shows signs of stabilization. Improved financials and the growing focus on healthcare innovation could serve as catalysts for a new growth phase.
As long as the price holds above 2.10, the recovery scenario remains valid. A breakout from the descending channel may confirm the start of a mid-term bullish trend. Still, given the sector’s volatility, risk management is crucial.
Baidu -the awakening of the Chinese giantBaidu (BIDU) has been moving within a descending channel, and the price is now testing the lower boundary of a key demand zone. On the monthly chart, the stock is attempting to hold above the 115–120 range, which could signal the beginning of a mid-term reversal. The upside potential extends toward 163, 205, and 357, where major supply zones and the upper border of the long-term channel are located.
Baidu remains a leader in China’s AI and internet search industries. The company continues to invest heavily in autonomous driving and cloud technologies, reinforcing its long-term position. With the yuan weakening and expectations of a softer monetary stance from Beijing, the tech sector gains additional tailwinds.
The stock is consolidating near key support, and a breakout above the range may trigger a new bullish phase. Investors should watch the 115–120 zone as a potential launch point for growth. Volatility may stay elevated, so risk management remains essential.

BTCUSDT – Correction Pressure ReturnsHello traders,
After a weak rebound earlier this week, Bitcoin is showing signs of losing momentum as it continues to face rejection around the 110,000 USD zone. On the 4-hour chart, price action remains clearly within a descending channel, indicating that the short-term trend still favors the bearish side.
From a technical perspective, BTC is currently being capped by the EMA 34 and EMA 89, both acting as dynamic resistance levels. The recent bounce appears to be merely a technical pullback following the previous strong sell-off, but lacks the strength to establish new upward momentum. The price structure is forming a tight consolidation zone near the upper boundary of the channel — typically a signal of “a pause before continuation of the prior trend.”
On the news side – Policy and sentiment headwinds
This week, the FSB (G20) warned of “major gaps” in global crypto regulation — a negative sign for market confidence, especially after a massive mid-month liquidation shook investor sentiment.
At the same time, China’s tighter stance on stablecoins is raising concerns about slower Asian inflows, while institutional demand remains weak.
Together, these factors create a market environment of low buying pressure and rising risk , giving bears the upper hand in the short term.
Possible Scenario
At the moment, BTCUSDT is trading within the 106,000 – 110,000 USD range.
If the price fails to make a decisive breakout above 110,000 USD, a continuation of the correction toward the 100,000 USD area remains highly possible — aligning with the lower boundary of the descending channel and a key psychological support zone.

ZONAUSDT Coin Analysis and CommentaryZONAUSDT Coin Analysis and Commentary
ZORA Coin has broken above its 21-hour moving average (0.097681) on the 15 min. technical chart. Indicators appear to have turned positive. If the support holds, upward price movements may occur.
Resistance: 0.103941 – 0.100768
Support: 0.097023 – 0.095786
We’d appreciate it if you could boost our posts and share them on your social media. 🚀
Legal Disclaimer:
The information, comments, and recommendations contained herein do not constitute investment advice. Investment advisory services are provided only within the framework of an investment advisory agreement to be signed between the investor and authorized institutions such as brokerage firms, portfolio management companies, and non-deposit banks.
The opinions expressed here are personal views and may not be suitable for your financial situation, risk profile, or return preferences. Therefore, no investment decisions should be made based solely on the information and opinions presented on this page.

ZORAUSDT Coin Analysis and CommentaryZONAUSDT Coin Analysis and Commentary
ZORA Coin has broken above its 21-hour moving average (0.090380) on the 1-hour technical chart. Indicators appear to have turned positive. If the support holds, upward price movements may occur.
Resistance: 0.095186 – 0.099178 – 0.104103 – 0.114402
Support: 0.086196 – 0.082988 – 0.079251
We’d appreciate it if you could boost our posts and share them on your social media. 🚀
Legal Disclaimer:
The information, comments, and recommendations contained herein do not constitute investment advice. Investment advisory services are provided only within the framework of an investment advisory agreement to be signed between the investor and authorized institutions such as brokerage firms, portfolio management companies, and non-deposit banks.
The opinions expressed here are personal views and may not be suitable for your financial situation, risk profile, or return preferences. Therefore, no investment decisions should be made based solely on the information and opinions presented on this page.

TradeCityPro | DASHUSDT One of the Strongest Long Setups🔹 DASHUSDT Technical Analysis — One of the Strongest Long Setups in the Market!
Let’s dive into the analysis of DASH, one of the older yet technically impressive coins in the crypto market. Despite the recent volatility, DASH has shown stronger bullish structure compared to most altcoins — making it one of the few charts currently setting up for a potential long opportunity.
🌐 Market Overview
Before diving deeper, keep in mind that today and tomorrow the global crypto market will have lower liquidity due to the weekend. This often leads to lighter trading volume and potentially unpredictable price spikes.
If you’re planning to open a position during this period, it’s highly recommended to reduce your risk and avoid over-leveraging.
📈 Bullish Scenario (Long Setup)
The DASHUSDT chart is showing a strong bullish structure and currently consolidating below a key resistance level at 49.22.
Once this level is broken with confirmation and volume, it will likely trigger a sharp upward continuation — supported by the strong uptrend that has been forming over recent sessions.
✅ Long Trigger: Break and close above 49.22
🎯 Target 1: 55.00
🎯 Target 2: 60.13
The area around 60.13 is crucial, as breaking it could lead to a parabolic move, especially if market volume returns early next week.
📉 Bearish Scenario (Short Setup)
In case of an early rejection from 49.22 or a sudden drop due to the low-volume weekend conditions, we should monitor the 39.34 support zone closely.
A confirmed break below 39.34 could signal a shift in short-term momentum, opening room for a short position.
However, it’s worth noting that other coins — particularly TON and IMX — currently show cleaner short triggers and may offer better setups in case the market turns bearish.
⚙️ Risk Management Tip
Since the market is in a low-liquidity phase, it’s important to:
Use smaller position sizes
Wait for candle confirmation on the breakout
Set tight stop-losses just below local supports
🎯 Summary
🟢 Long Setup: Break above 49.22 → Target 55.00–60.13
🔴 Short Setup: Break below 39.34 → Conservative entry (better shorts on TON & IMX)
⚠️ Note: Trade lighter due to low weekend volume
💬 Final Thoughts:
DASH stands out among altcoins this week with a notably stronger bullish chart structure. The trend is constructive, and if momentum continues next week, a confirmed breakout could deliver one of the best long trades of the week.
Stay patient, watch the 49.22 level closely, and let the market confirm the move before entering.

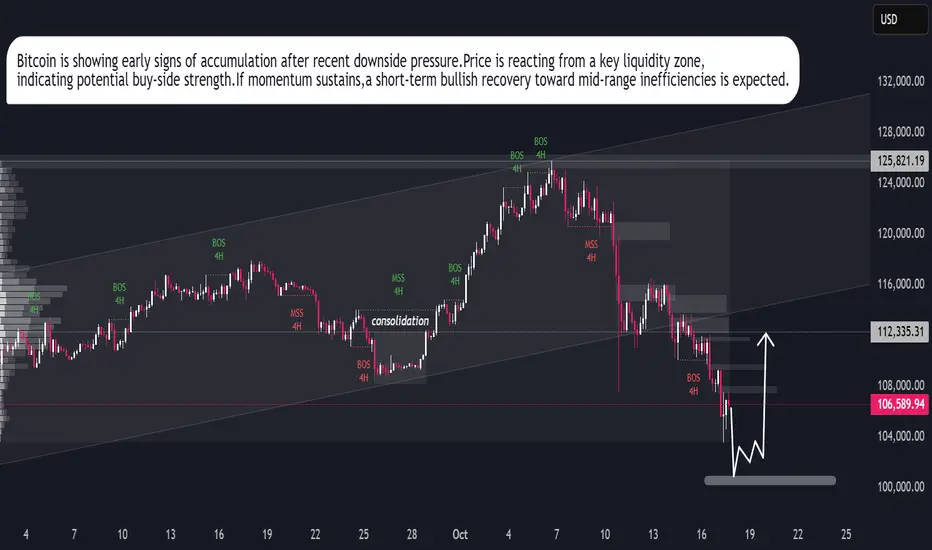
Bitcoin Market Preparing for Upside MoveBitcoin is currently stabilizing after a sharp corrective phase.The market is showing early signs of demand re-entry near the liquidity base,indicating potential exhaustion of selling pressure.Recent structural reactions hint that buyers are preparing to reclaim control,which could initiate a short-term recovery leg toward the mid-range inefficiency zone.If momentum sustains,Bitcoin may expand higher,confirming a potential buy phase aligned with institutional accumulation signals.Overall,the outlook remains cautiously bullish as long as the market holds above its newly formed demand area.