SOLUSDT – Weak rebound, bears back in controlAfter a sharp drop on October 14, Solana made a slight recovery but quickly hit resistance at the downtrend line — where sellers stepped back in strongly. The $208 zone continues to act as a tight lid on price action, signaling that current buying pressure isn’t strong enough for a reversal.
With U.S.–China trade tensions still simmering, the overall crypto market — including SOL — remains under pressure. If the price fails to break above this descending trendline, SOL could likely fall back toward the $188 support zone, or even $175 in the next move.
In short, the main trend remains bearish, and current rebounds look more like opportunities for sellers to reload for the next push downward.
Tradingview

BTC/USDT – Downtrend ContinuesBitcoin is facing downward pressure after the escalation of US-China trade tensions. Although President Trump made more conciliatory remarks, which helped ease short-term concerns, the global economic uncertainty remains a major factor driving BTC/USDT into a downtrend.
On the chart, BTC/USDT is moving within a clear downtrend channel. Despite a slight recovery, the price is currently fluctuating around $113,129 and could continue to adjust towards the 106,500 USD and 101,800 USD targets in the near term.
With ongoing macroeconomic instability and no strong signs of recovery, Bitcoin may continue to decline in the short term.

GOLD Breakout area? What's next??#GOLD ... Now market have upside breakout and current resistance is is 4207-08
Keep close that area because sustain above means further rise expected.
SteroidsFX
Trade wisely

TradeCityPro | Bitcoin Daily Analysis #197👋 Welcome to TradeCity Pro!
Let’s go over the Bitcoin analysis; today Bitcoin is still in a downtrend, so let’s review the market together.
⏳ 1-Hour Timeframe
After the double top that was activated yesterday near the 0.5 Fibonacci level, Bitcoin entered a corrective phase after reaching the double top target.
✨ The double top peaks formed around 115,698, but after completing the downward move and starting the correction, the price created lower highs around 113,218, and now with the break of 111,975, a new high-volume downward move has started.
📊 The price is moving back toward the supply zone it had, and reaching this area is not a good sign for the upward trend we see on higher timeframes.
🔽 The more the price approaches this zone and reacts to it, the weaker the zone becomes, and the probability of it breaking increases in subsequent attempts.
✔️ Currently, this is the third time the price is approaching this zone, and each time it comes with higher volume and a stronger bearish structure; if this pattern repeats several times, the zone could break.
🔍 Whether the price breaks or finds support at this zone can determine the market’s direction for the upcoming period.
⚡️ If the zone breaks, Bitcoin could enter a corrective and range-bound phase for weeks or even months, and we wouldn’t be able to open positions effectively in that environment.
📈 If the zone holds as support, with a break above 115,698, we would get confirmation of Bitcoin’s bullish trend and could expect the next upward move to begin.
❌ Disclaimer ❌
Trading futures is highly risky and dangerous. If you're not an expert, these triggers may not be suitable for you. You should first learn risk and capital management. You can also use the educational content from this channel.
Finally, these triggers reflect my personal opinions on price action, and the market may move completely against this analysis. So, do your own research before opening any position.

XAUUSD | Gold Holds Firm as Buyers Dominate the MarketGold continues to demonstrate a strong and orderly bullish structure, with momentum sustained by a combination of market confidence and macroeconomic positioning. The metal’s consistent upward drive reflects ongoing demand for safety amid lingering inflationary concerns and uncertainty surrounding global economic recovery. Institutional accumulation remains visible, suggesting that investors are positioning ahead of potential policy adjustments and currency fluctuations.
The recent moderation phase appears to be a controlled pause rather than weakness, indicating that buyers are maintaining control while the market digests prior gains. Should current stability in yields persist and geopolitical tensions remain elevated, gold could extend its advance in the medium term, reaffirming its role as a key hedge within diversified portfolios.

MARA: shoulders done, now walk toward the targetOn the daily chart, MARA completed a textbook inverse Head & Shoulders reversal with a clear breakout above the descending trendline. A corrective pullback followed, and the price is now heading into the key buy zone at 15.21–15.77 - aligning with the 0.72 and 0.79 Fibonacci retracements, and the upper boundary of the broken channel. This is the area to watch for a potential continuation of the bullish impulse.
Volume on the breakout was above average, confirming strong buyer interest. The EMAs are trending below the price, supporting the upward structure. The first target is located at 21.57 (previous resistance), with a potential extension to 28.77 (Fibonacci 1.618).
Fundamentally, MARA remains highly correlated with BTC and crypto sentiment. As interest returns to crypto-related assets due to ETF flows and possible Fed easing, mining stocks like MARA gain attention. Recent reports also show improved production efficiency and lowered costs - a tailwind for bulls.
Tactically, the best setup would be a confirmed reaction from the buy zone — whether a strong candlestick formation, volume surge, or reclaim of a key level. If that happens, aiming for 21.57 and 28.77 becomes a solid plan.
The pattern played out - now it's time for the market to walk the talk.

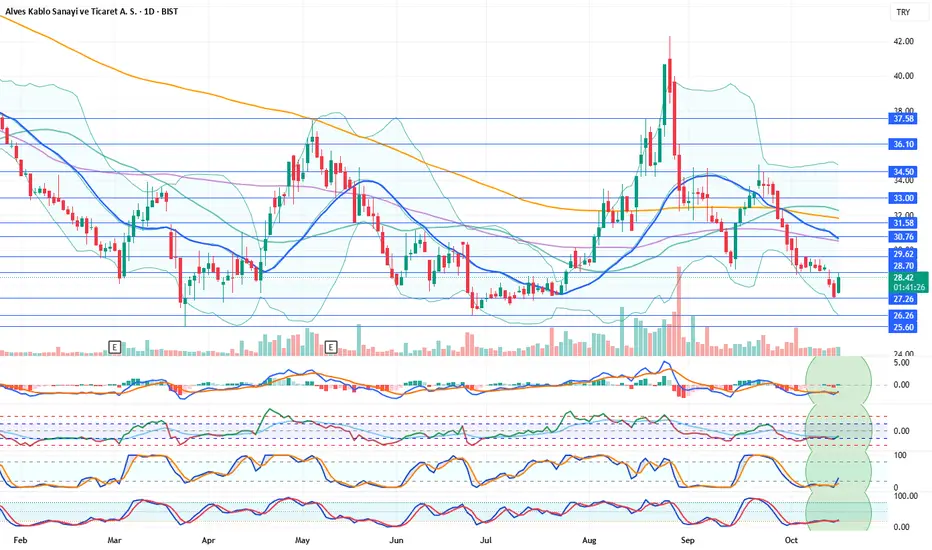
ALVES Stock Analysis & CommentaryALVES Stock Analysis & Commentary
Daily technical indicators are positive. After forming support at 27.26, the stock appears to be recovering from that level. With indicators also showing positive momentum, we believe further recovery may occur. In a potential bullish scenario, the stock could have a chance to test the 21-day moving average (30.68).
Resistance Levels: 28.70 – 29.62 – 30.76 – 31.58
Support Levels: 27.26 – 26.26 – 25.60
We’d appreciate it if you could boost our posts and share them on your social media. 🚀
Legal Disclaimer:
The information, comments, and recommendations contained herein do not constitute investment advice. Investment advisory services are provided only within the framework of an investment advisory agreement to be signed between the investor and authorized institutions such as brokerage firms, portfolio management companies, and non-deposit banks.
The opinions expressed here are personal views and may not be suitable for your financial situation, risk profile, or return preferences. Therefore, no investment decisions should be made based solely on the information and opinions presented on this page.
UP TREND BUY Eurjpy will be buying and it would be best to follow the trend to the up side and make sure to maximise profits have set a buy limit to catch the trend trade

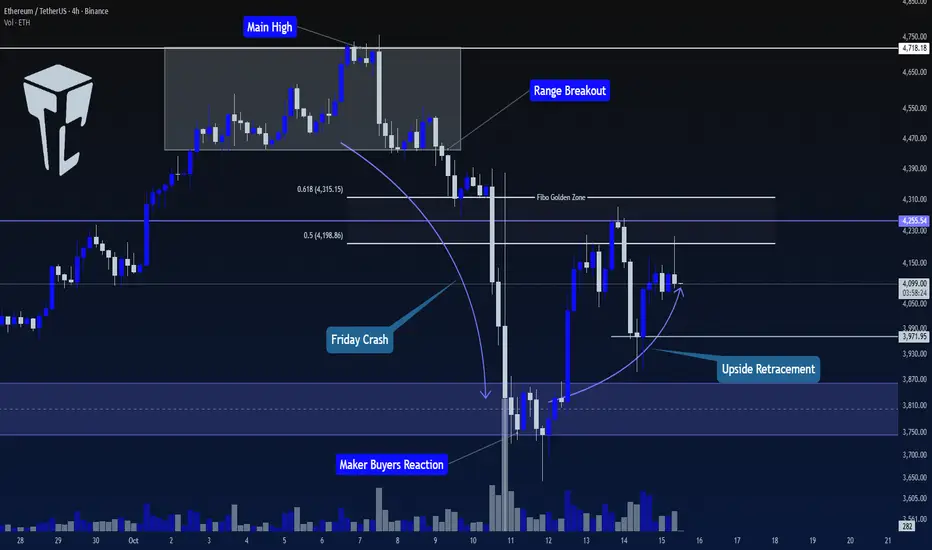
TradeCityPro | Ethereum: Break Key Levels for Bullish Momentum👋 Welcome to TradeCity Pro!
In this analysis, I want to examine Ethereum for you. The queen of the crypto market, with a $497 billion market cap, is ranked 2nd on CoinMarketCap.
⏳ 4-Hour Timeframe
This coin, in the 4-hour timeframe, after breaking the range box at the ceiling and moving towards the $3800 level, is now in a corrective phase and has made an upward movement.
⭐ The $3800 range is a very important level for Ethereum, and this zone was not broken even during the Flash Crash that occurred on Friday, and it managed to hold the price.
🚀 Now, the price has moved towards the range between 0.5 and 0.618 Fibonacci, and has been rejected once from this zone.
📊 The volume has not increased significantly during this move and has mostly been range-bound, but since the price has created a higher low at the $3971 level, if the buying volume increases, we can get a bullish confirmation with a break of the $4255 level.
💥 Since this coin is bullish on higher timeframes and is currently undergoing a correction on lower timeframes, if the price gives us a small bullish confirmation, we can take advantage of it and open a long position.
💡 The main resistance for Ethereum is the $4718 level. Breaking this level will initiate the next wave for Ethereum on higher timeframes, such as weekly charts. Therefore, I will try to open a long position on Ethereum before this level is broken.
📈 The suitable trigger right now seems to be a break of $4255. With this break, the price can move towards $4718, and if this level is broken, we will have a very good and attractive entry point for a long position on Ethereum.
📝 Final Thoughts
Stay calm, trade wisely, and let's capture the market's best opportunities!
This analysis reflects our opinions and is not financial advice.
Share your thoughts in the comments, and don’t forget to share this analysis with your friends! ❤️
BUY GOLD Gold will be buying and I’ve set a buy limit to make sure I’ll be able to catch it at the right time join in with me but keep it all professional and not too risky as we are following the trend

Ethereum 1H Analysis – Key Battle at $4,278 Resistance | D1👋 Hey everyone! Hope you’re doing great!
💥 Welcome to Satoshi Frame — today we’re diving into the 1-hour Bitcoin analysis. Stay tuned and follow along!
👀 1-hour timeframe of Ethereum, and we can see that Ethereum, after the heavy drop it experienced, broke down from the 4278$ area and moved toward its lower support levels. A major support level has formed around the 3692$ area, where we saw strong buyer support, and they pushed the Ethereum price upward. After the upward movement and buyer support, as Ethereum approached its resistance in the 4278$ area, the buying volume decreased, and then buyers’ strength ended. Sellers, with strong momentum and multiple red candles, pushed the price down toward the 3941$ support, where the price was supported again. Now a higher low has formed compared to the 3941$ bottom, and the price is moving toward its key resistance area at 4278$.
🧮 We can see in the RSI oscillator that there is a key level around 70, which is the OverBuy boundary. If the fluctuation limit passes this area, Ethereum can break its resistance around 4278$.
🕯 Regarding volume, there is an educational note that when the price approached the 4278$ resistance, it faced a decrease in buying volume and was rejected from this area with many red candles. Now that the price is moving toward this resistance, if it is accompanied by an increase in buying volume, it increases the probability of breaking this resistance for us.
🧠 For the Ethereum position, a breakout of the 4278$ area is needed, and now if the price moves toward this area, it will form our second touch and create several scenarios for us.
↗️ First scenario for long position: breakout of resistance accompanied by an increase in volume and setting the trigger at 4278$, which gives us a large stop size and reaches its risk-to-reward ratio later.
↗️ Second scenario for long position: wait for the price to have a reaction to the 4278$ area and then create a higher high and higher low for us, and we can enter on the created higher low and place our stop below that same low.
❤️ Disclaimer : This analysis is purely based on my personal opinion and I only trade if the stated triggers are activated .

BTC 1H Box Breakout Setup | D1👋 Hey everyone! Hope you’re doing great!
💥 Welcome to Satoshi Frame — today we’re diving into the 1-hour Bitcoin analysis. Stay tuned and follow along!
👀 On the 1-hour timeframe of Bitcoin, we can see that after its recent drop, Bitcoin has entered a one-hour consolidation box. The top of this box is around $115,802, and the bottom is at $110,224. A breakout from this box could lead to the next impulsive move. Currently, Bitcoin’s price is near the midline of the box at $113,222 — and if it breaks and stabilizes above this level, Bitcoin could start moving toward the top of the box and potentially break above it.
Notice that Bitcoin reacted to the buyer-maker zone near the bottom of the box, showing a reversal pattern. With buying pressure pushing it upward and a higher low forming, the probability of a midline breakout has increased.
🧮 Looking at Bitcoin’s RSI oscillator, it’s currently near the static resistance around the 54 range. If RSI breaks and stabilizes above this level, long-trade momentum is likely to increase, which could help Bitcoin break through the midline and become more bullish.
🕯 Let’s first discuss the maker-buyer zone, which acts as a major support area for buyers and institutions that accumulate their positions here. This area tends to create counter-direction reactions in Bitcoin. Right now, Bitcoin has formed a higher low just below the midline and is showing increasing buying volume, with larger candle sizes appearing on the chart.
🧠 For Bitcoin’s trading setup, once the midline breaks, we can consider entering a position, forming a potential long scenario:
↗️ Long Position Scenario:
If Bitcoin breaks and stabilizes above $113,222, accompanied by an RSI breakout above 54 and a rise in buying volume, it could move toward the top of the box and provide a solid long opportunity.
❤️ Disclaimer : This analysis is purely based on my personal opinion and I only trade if the stated triggers are activated .

BTCUSD Plunges: USD Intensifies Downward Pressure!BTCUSD is currently in a downtrend, with the chart showing Bitcoin's price moving below a clear downward trendline. The resistance level at 116,100 USD remains a key point to watch. If the price fails to break this level, BTCUSD is likely to continue its decline towards the next support levels at 104,500 USD.
A strong increase in USD buying by hedge funds and asset managers, combined with rising trade tensions between the US and China, is driving the strength of the US dollar. As the USD strengthens, BTCUSD faces downward pressure, as risk assets like Bitcoin tend to decrease in value.
With fundamental factors supporting the USD and the chart showing a bearish adjustment, BTCUSD is likely to continue its downward trajectory in the short term, targeting the support zone at 104,500 USD.

TradeCityPro Academy | Support & Resistance Part 1👋 Welcome to TradeCityPro Channel
🎓 Educational Section Technical Analysis Training Series
Welcome to the Educational Content Section of our channel!
Here, we aim to teach you technical analysis from A to Z through structured playlists.
We’ll cover everything from risk and capital management, Dow Theory, support and resistance, trends, and market cycles, to more advanced concepts.
Our lessons are based on both real market experience and The Handbook of Technical Analysis.
🎨 What is Technical Analysis?
Technical Analysis (TA) is a method used to forecast price movements in financial markets by analyzing historical data, especially price and volume.
It’s based on the idea that history tends to repeat itself, and that recurring patterns can reveal profitable trading opportunities.
🧩 The Human Concept of Support and Resistance
Support and resistance aren’t just numbers on a chart — they’re the result of collective human behavior.
When large groups of traders make similar decisions — buying or selling — at a certain level, that area becomes psychologically important in the market.
Support forms where fear of missing out (FOMO) drives people to buy.
Resistance forms where fear of loss motivates people to sell.
💭 The Psychology Behind Formation
In a downtrend, when prices fall too much, traders start thinking “It can’t go any lower”, and buying pressure increases — forming support.
In an uptrend, when prices rise sharply, traders think “It’s too expensive now”, and selling pressure builds — forming resistance.
So, these levels reflect emotions like fear, greed, and FOMO, rather than being purely technical.
🌍 Real-World Example
When the USD price drops so low that everyone rushes to buy it — that’s support.
When gold becomes so expensive that no one wants to buy anymore — that’s resistance.
Markets operate on these same human instincts — only visualized through candlesticks and numbers.
🧩 Introduction
In technical analysis, two key concepts exist in nearly every strategy:
Support and Resistance.
These are areas on the chart where the probability of price reaction or reversal is high.
🟢 What is Support?
A support level is where buying pressure is expected to increase and prevent further price decline.
It acts like a floor that supports price.
📘 Example:
If Bitcoin repeatedly bounces from the $60,000 level, that area is considered a support zone.
🔴 What is Resistance?
A resistance level is where selling pressure increases, preventing further price growth.
It acts like a ceiling that stops price movement upward.
📘 Example:
If Ethereum fails multiple times to break above $3,800, that area is a resistance zone.
📈 How to Identify Support and Resistance
There are several methods to detect these levels:
Previous Highs and Lows:
The most common method — look for areas where price has reacted before.
Trendlines:
In an uptrend, connecting higher lows gives you a dynamic support line.
Moving Averages (MA):
MAs like MA50 or MA200 often act as dynamic support or resistance.
Supply and Demand Zones:
Areas where heavy buying or selling previously occurred.
⚙️ Market Psychology
Support and resistance are emotional memory points for traders.
When price reacts to a level once, it becomes mentally significant, leading to similar reactions in the future.
That’s why these zones often repeat over time.
🔄 Breakouts and Role Reversal
When price breaks a support or resistance level with strong volume and momentum, that level changes its role:
Broken resistance → becomes new support
Broken support → becomes new resistance
This concept is known as Role Reversal.
🎯 Importance of Timeframes
Support and resistance zones on higher timeframes (Daily, Weekly) carry greater significance, since more traders and larger volumes are involved.
🧠 Pro Tips
✅ Always treat support and resistance as zones, not fixed price points.
✅ If price approaches a level with strong momentum, it’s more likely to break it.
✅ Combine S/R with candlestick reactions, volume, and indicators for confirmation.
✅ Levels that repeat multiple times usually grow stronger over time.
💬 Summary
Support and resistance are the foundation of technical analysis.
Understanding them helps you find better entry and exit points and gain a deeper insight into market psychology.
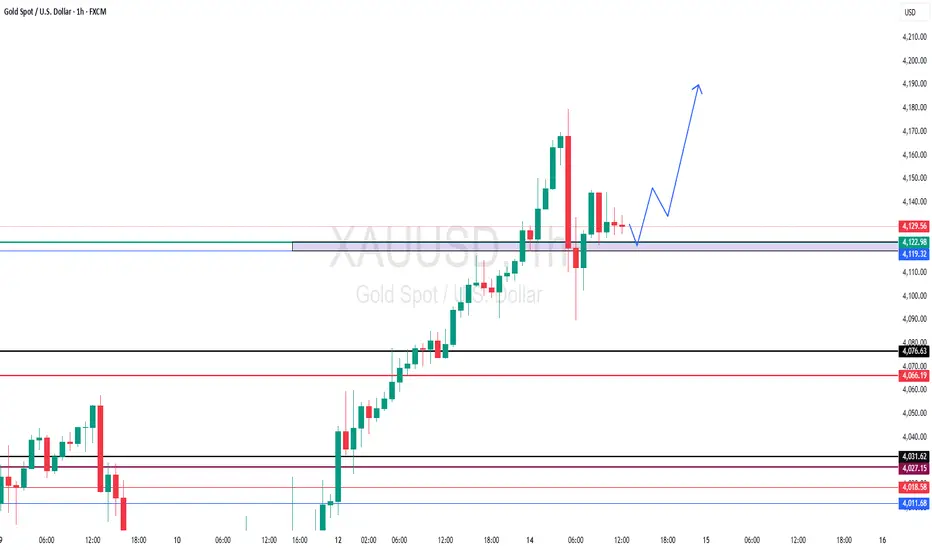
GOLD at current support? holds or not??#GOLD. perfect move as per our last couple of ideas regarding gold and now again market just near to his current supporting area.
that is around 4119 to 4123
keep close and if market holds then we can expect again bounce from here.
NOTE: we will go for cut n reverse below that region on confirmation.
good luck
trade wisely
GOLD Breakout ? Further rise expected??#GOLD... market trade and sustain above his resistance area.
So keep close our immediate area is now 4075-76 and after that a deep supporting area 4065-66
Good luck
Trade wisely

TradeCityPro | Bitcoin Daily Analysis #196👋 Welcome to TradeCity Pro!
Let’s go over Bitcoin's analysis. The price is moving down again, so let’s review Bitcoin's movement together.
⏳ 1-Hour Timeframe
Yesterday, we had a trigger at the $115,698 zone, but the price couldn't sustain above this level, and Bitcoin's downward movement has started again.
✔️ A double top pattern has formed in this timeframe, and the trigger for this pattern activation was $113,991, which has now been activated. With the large volume, the price has managed to stabilize even below the $111,278 zone.
💥 The RSI oscillator has once again entered Oversell, and the price has reached near our support zone.
⚡️ If this support zone is broken, we can open a short position. Otherwise, I won’t be opening any short positions with other triggers.
📈 For a long position, we need a very strong reaction and significant bullish momentum at the support zone. In this case, the main trigger for a long would be $115,698, but we can also use earlier triggers if they form.
📊 For now, I will wait to see how the price reacts to the zone and then look for the trigger. The only trigger I have at the moment is $115,698.
❌ Disclaimer ❌
Trading futures is highly risky and dangerous. If you're not an expert, these triggers may not be suitable for you. You should first learn risk and capital management. You can also use the educational content from this channel.
Finally, these triggers reflect my personal opinions on price action, and the market may move completely against this analysis. So, do your own research before opening any position.

TradeCityPro | LINK: Eyeing $18 for Potential Drop👋 Welcome to TradeCity Pro!
In this analysis, I’m going to review the LINK coin — one of the RWA projects, currently ranked 12th on CoinMarketCap with a market capitalization of $12.57 billion.
⏳ 1-Hour Timeframe
In the 1-hour timeframe, after Friday’s drop, the price fell to $16.78.
💫 Following this decline, the price made an upward correction up to the 0.618 Fibonacci level. After one reaction to this zone, bearish momentum returned to the market, and volume has been increasing.
✅ Currently, the price is moving toward the $18.31 level. Breaking this zone could trigger the start of the next downward leg.
⭐ The main support level remains at $16.78, and as long as the price stays above this zone, I won’t be opening any short positions.
📊 For long positions, the current trigger is $20.02.For earlier triggers, we need to wait for the market to form more structure and generate new entry signals.
📝 Final Thoughts
Stay calm, trade wisely, and let's capture the market's best opportunities!
This analysis reflects our opinions and is not financial advice.
Share your thoughts in the comments, and don’t forget to share this analysis with your friends! ❤️

TradeCityPro | Bitcoin Daily Analysis #195👋 Welcome to TradeCity Pro!
Let’s move on to Bitcoin analysis. Yesterday, price started an upward move, so let’s see what triggers we have today.
⌛️ 1-Hour Timeframe
Yesterday, price found support at our key zone and also activated the 112,420 risk trigger we had identified.
✨ If you opened a position, it’s not a bad time to take profits, since this was a risky setup, and such positions should be managed quickly.
🧮 Currently, a resistance high has formed around 115,698. If this level breaks, price could continue its upward movement.
💫 As long as price stays above 112,420, this trigger remains active and can be used to open positions.
✔️ For shorts, I personally won’t be taking any until price breaks below 107,000 and stabilizes under that zone.
❌ Disclaimer ❌
Trading futures is highly risky and dangerous. If you're not an expert, these triggers may not be suitable for you. You should first learn risk and capital management. You can also use the educational content from this channel.
Finally, these triggers reflect my personal opinions on price action, and the market may move completely against this analysis. So, do your own research before opening any position.

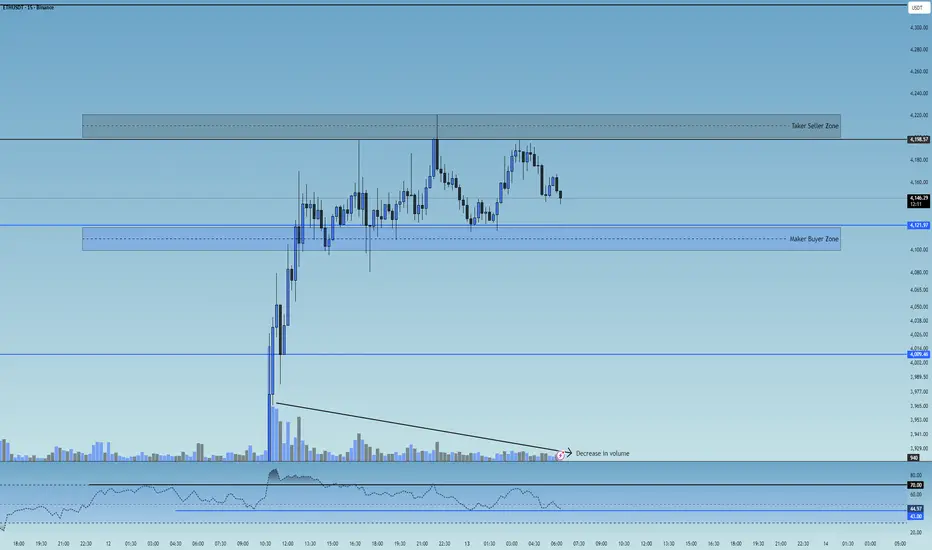
ETH 15M Analysis - Key Triggers Ahead | Day 33☃️ Welcome to the cryptos winter , I hope you’ve started your day well.
⏰ We’re analyzing ETH on the 15-Minutes timeframe .
👀 On the 15-minute timeframe for Ethereum, we can see that after an impressive 10% rally, ETH showed one of the strongest recoveries in the market compared to other major coins — managing to climb above $4,100 and form a new trading range early in the week. Currently, Ethereum is consolidating within a range between $4,200 (top) and $4,121 (bottom). A breakout from this range could create either a long or short setup. Keep in mind that following this strong bullish move, trading volume has started to decline inside this range.
🧮 Looking at the RSI oscillator, we can see that after the recent surge, ETH’s momentum is now fluctuating between 43 and 70. A breakout above or below this RSI range would likely increase volatility and accelerate Ethereum’s next move — potentially with fewer candles but stronger momentum.
🕯 The size and volume of recent candles during Ethereum’s rally have been exceptional. Major buyers and institutional players have added substantial ETH positions to their portfolios. The large, high-volume bullish candles leading up to the current range reflect Ethereum’s strong momentum. Now, while the price is oscillating inside the range with reduced volume, a clear volume expansion is expected once the range breaks.
🧠 As Ethereum remains trapped inside this trading range, a breakout will require increased volume and RSI confirmation beyond the defined thresholds. This setup gives us two potential scenarios:
↗️ Long scenario: If Ethereum breaks above $4,200, which acts as a taker-seller resistance, and RSI pushes above 70 (Overbought zone), ETH could launch another bullish leg early in the week — showing an even stronger recovery compared to the rest of the market.
📉 Short scenario: If Ethereum breaks below $4,121, which is a maker-buyer support, and RSI drops under 43 toward the Oversold zone, it could continue its downward correction. However, given ETH’s strong bullish momentum, this bearish scenario would likely require negative market fundamentals to fully play out.
❤️ Disclaimer : This analysis is purely based on my personal opinion and I only trade if the stated triggers are activated .
TradeCityPro | BNB Surges Beyond All-Time Highs👋 Welcome to TradeCity Pro!
In this analysis, I’m going to review BNB, the official token of Binance Exchange, which currently holds the #3 spot on CoinMarketCap with a market capitalization of $188 billion.
⌛️ 4-Hour Timeframe
On the 4-hour chart, after the broad market downturn, this coin managed to recover very well. Supported from the 1100 zone, BNB began to move upward again.
📊 A risky long trigger appeared on the lower timeframes around 1143, and if you entered based on that trigger, your position should now be sitting in good profit.
🎲 BNB has now broken through its all-time high after surpassing 1317, and the next corrective wave could potentially begin from here.
✔️ So far, the volume and momentum have both been strong, and there are no signs of weakness in the trend yet—meaning the upward movement can still continue.
✨ However, if this move turns out to be a fake breakout and the price stabilizes below 1317, BNB could enter a longer corrective phase. In that case, with confirmation of the fake breakout below 1317, a short position could also be considered.
📝 Final Thoughts
Stay calm, trade wisely, and let's capture the market's best opportunities!
This analysis reflects our opinions and is not financial advice.
Share your thoughts in the comments, and don’t forget to share this analysis with your friends! ❤️

BTC 15M Analysis - Key Triggers Ahead | Day 55☃️ Welcome to the cryptos winter , I hope you’ve started your day well.
⏰ We’re analyzing BTC on the 15-Minutes timeframe .
👀 On the 15-minute timeframe for Bitcoin, we can see that after breaking out and consolidating above the $114,351 zone, BTC began moving upward and is now trading within a 15-minute range. A breakout from this range could trigger the next move. The top of this trading range sits at $115,715 and the bottom at $114,750 — breaking and holding beyond either level could start a strong leg for Bitcoin as the new week begins.
🧮 The RSI oscillator on the 15-minute timeframe shows Bitcoin currently moving within a range capped at 64 on the top and 42 on the bottom. A breakout from this RSI range could significantly increase buying or selling momentum, adding fuel to Bitcoin’s next move.
🕯 The size, volume, and count of green candles have increased since the flash crash, and institutions like BlackRock, World Liberty, and Trump-aligned funds have been averaging solid buy positions. With rising buying volume, Bitcoin could break through its ticker-seller resistance at $115,715 and continue its bullish move following the recent dramatic flash crash.
🔍 Despite concerns like the ongoing U.S.–China economic (tariff) war, the market remains in a risk-off mode on higher timeframes. If entering trades, we aim to manage capital across multiple entries — for example, allocating only 0.25% risk per position or averaging in gradually.
🧠 Two trading scenarios are considered for Bitcoin, both offering clear opportunities for structured entries.
↗️ Long scenario (breakout above the range):
If Bitcoin breaks above $115,715 with rising buy volume and RSI crossing above 64, it could initiate another strong bullish leg toward higher resistance levels.
📉 Short scenario (breakdown below the range):
If the micro-buyer support at $114,750 — a key demand zone — breaks, Bitcoin may extend its correction downward. This move should coincide with RSI losing the 42 level and increasing sell volume. Note: in short positions, take profits quickly and maintain tight risk-to-reward control.
❤️ Disclaimer : This analysis is purely based on my personal opinion and I only trade if the stated triggers are activated .

BTCUSDT – When the U.S.–China Trade War Fills Bitcoin’s SailsTrade tensions have resurfaced after U.S. President Donald Trump announced a 100% tariff on Chinese exports. The renewed fear of a trade war has pushed investors toward decentralized assets like gold and Bitcoin as a hedge against uncertainty. While the USD saw a slight uptick, the risk-off sentiment has driven capital into BTC — now viewed as a modern safe-haven asset.
On the daily chart, BTC continues to maintain its bullish structure within a broad ascending channel that has been in place since June. After a sharp drop to the $108,000 support zone, strong buying pressure quickly stepped in, forming a long-tailed candle — a clear sign that the bulls are still in control. If the price holds above $110,000, BTC is likely to extend its recovery toward the next major resistance around $128,000 in the coming weeks.
