ETH 1H Analysis - Key Triggers Ahead | Day 14💀 Hey, how's it going ? Come over here — Satoshi got something for you!
⏰ We’re analyzing ETH on the 1-hour timeframe timeframe.
🔭 On the 1H timeframe for Ethereum, we can see that after yesterday’s news, ETH pushed upward toward the top of its range but failed to break out. From that resistance, it faced a heavy rejection, and this drop happened within just two 1H candles! At the moment, ETH is in a consolidation zone, and breaking out of this compression could provide us with an entry.
⛏ The key RSI oscillator levels are at 38 and 50. Once RSI breaks above or below these zones, Ethereum could start its next move following the effects of yesterday’s NFP news.
💰 The size and volume of red candles have increased sharply, showing strong selling pressure. The corrective bounce happened step by step, but then another fairly large red 1H candle was printed. With continued selling pressure, Ethereum may test lower price levels.
🪙 On the 1H timeframe for the ETHBTC pair, we can see it is moving inside a multi-timeframe range. Each time it reaches the bottom of the box, volume increases and the price reacts with zig-zag moves. Note that the bottom of this box is at 0.03864, which has already been tested twice. This area should be considered as a short alert zone for ETHBTC.
💡 The alert zones for Ethereum itself are at 4,272$ and 4,338$. If either of these levels is broken, ETH could start a strong move, especially considering the momentum after yesterday’s NFP News.
❤️ Disclaimer : This analysis is purely based on my personal opinion and I only trade if the stated triggers are activated .
Tradingview
BTC 1H Analysis - Key Triggers Ahead | Day 34💀 Hey, how's it going ? Come over here — Satoshi got something for you!
⏰ We’re analyzing BTC on the 1-hour timeframe timeframe.
👀 On the 1H timeframe for Bitcoin, we can see that after yesterday’s NFP news, Bitcoin moved toward its resistance levels but then faced a very strong rejection. Personally, I expected some big green candles after that news. Right now, Bitcoin is consolidating, and the top and bottom of this range should be considered as breakout zones.
⚙️ The key RSI levels for Bitcoin are around 42 and 53. Once RSI breaks out of this range, Bitcoin can start its new move following the impacts of yesterday.
🕯 The size and volume of the red candles after the news increased sharply, and with one strong selling-pressure candle, the price dropped from the top of the range to the bottom.
💵📊 On the 1H timeframe for USDT.D, we can see that after yesterday’s news it had a very strong reaction from its support area and, with one massive hourly whale candle, pushed up toward its resistance at 4.49%. From there, it got rejected with several red candles and formed a higher low compared to its previous bottom. Keep in mind that if 4.49% is broken, Bitcoin could go into a deeper correction.
🔔 The alert zones for Bitcoin are the top and bottom of this range, which can give us entry signals. Our long alert zone is at 11,600$, and if this level breaks, Bitcoin could move higher. On the other hand, 11,056$ is our short alert zone, and with a breakdown of this level and selling pressure, Bitcoin could push toward lower levels.
❤️ Disclaimer : This analysis is purely based on my personal opinion and I only trade if the stated triggers are activated .
USD/JPY - Multi timeframe breakdown🔎 Weekly View (Macro Bias)
Trend: Long-term structure is still bullish, but the most recent weekly close reacted strongly from supply.
Demand Zones: Price is hovering above a weekly demand block around 145.0 – 146.0, which aligns with prior structure.
Implication: We could see a deeper retracement into weekly demand before the pair makes another attempt higher.
📉 Daily View (Intermediate Bias)
Shift in Sentiment: Daily chart shows a clear bearish structure, with lower highs and a supply rejection around 151.2.
Liquidity Map:
Sell-side liquidity sits below 146.0.
Buy-side liquidity rests above 151.0–152.0.
Key Demand: Daily demand zones between 144.5 – 146.0 are holding price for now.
Implication: Market is ranging. Bears have momentum, but if demand continues to hold, buyers may attempt a reversal toward 150+.
⏱ 8H View (Execution Frame)
Structure: Strong liquidity sweep into daily demand, followed by a bounce.
Supply vs. Demand:
8H supply zones are capping rallies (148.5 – 149.5).
8H demand zones at 146.0 – 146.5 remain intact.
Note: The repeated retests suggest buyers are losing interest, but demand has not fully broken yet.
📊 1H View (Fine-Tuned Entry)
Confluence Zone: Price reacted strongly from the 71% fib retracement and supply rejection.
Support: Strong support seen at 146.0–146.5, aligned with daily demand.
Resistance: Multiple layers of resistance at 148.5, 150.0, and 151.2.
✅ Trade Outlook
Preferred Setup:
Option 1 (Bullish Reversal): Look for longs from 146.0–146.5 daily demand into 150–151.2 liquidity.
Option 2 (Bearish Continuation): If 146.0 breaks clean, expect continuation toward 144.0 – 143.0 (deeper weekly demand).
Bias: Currently neutral-to-bearish unless demand proves strong. Bulls need a confirmed break above 148.5–149.5 supply to flip bias back to bullish.

TESLA 5TH SEP 2025 PRICE ACTION Price action for Tesla is here. I have clearly explained my plan on how to trade tesla considering every factor in market.
NOTE: OPTION WILL BURN YOUR CAPITAL

Master TradingView Like a Pro – Tools, Alerts, and Hidden Gems!Are you really using everything TradingView has to offer?
In this video, I’m breaking down 8 powerful features inside TradingView that most traders don’t fully use — even though they can save time, improve your analysis, and help you catch better setups.
Here’s what I’ll walk you through step by step:
✅ How I use Drawing Tools to map market structure
✅ Why I rarely use indicators — but why you should still know them
✅ How to scan markets fast using the Screener & Heatmap
✅ The right way to use the Economic Calendar and avoid news traps
✅ The feature I use daily: Price Alerts (a total game changer)
✅ How to practice with zero risk using Paper Trading
✅ Using Multi-Chart Layouts to watch multiple timeframes
✅ And finally — how the TradingView Community helped me grow and connect
Whether you're just getting started or already experienced — this video is packed with value.
Watch it till the end, and if you find it helpful — like, comment, and share it to support my work!
Best, Arman Shaban

GOLD - current support ? Holds or not??#GOLD... Perfect move as per our analysis and now market have 3541-42 as im ediate supporting area
Keep close and if market hold it in that cDe we can expect further bounce.
Good luck
Trade wisley

ETH 1H Analysis - Key Triggers Ahead | Day 13💀 Hey , how's it going ? Come over here — Satoshi got something for you !
⏰ We’re analyzing ETH on the 1-hour timeframe timeframe .
🔭 On the 1H timeframe of Ethereum, we can see that ETH has had a solid upward move and is now facing resistance at $4416. If this level breaks, price could move toward the next resistance at $4481. A early trigger for a long position is right at the current level, which I’ve already used to open a trade. I’ve also set a low-risk order around $4481, which is the top of ETH’s box structure on the multi-timeframe view.
⛏ The key RSI zones for ETH are around 50 and 70. Breaking out of these levels could trigger a strong leg. With news coming, volatility is expected to increase sharply. ETH is currently trading below 70 but above 50, which suggests long setups have more momentum.
📊 The size and volume of ETH’s green candles are increasing, showing clear buying strength. If today’s NFP news comes out positive, ETH could make a very strong upward leg.
💸 On the 1H ETHBTC chart, the pair is inside a descending channel, and within this channel, it has formed a tight box-like consolidation. The box top is at 0.03999, while the bottom sits at 0.0387. With higher volume and volatility, ETHBTC could break out, leading to either a pump or a dump in Ethereum.
💡 The alarm zones for Ethereum are set at $4416 and $4481. Breaking and holding above these levels can provide strong trading opportunities. Personally, I’ve already opened a position on the $4416 breakout, and I plan to add more size if the $4481 zone is taken out. The NFP release could bring momentum similar to last time, with sharp and powerful moves.
❤️ Disclaimer : This analysis is purely based on my personal opinion and I only trade if the stated triggers are activated .

BTC 1H Analysis - Key Triggers Ahead | Day 33💀 Hey , how's it going ? Come over here — Satoshi got something for you !
⏰ We’re analyzing BTC on the 1-hour timeframe timeframe .
👀 On the 1H timeframe of Bitcoin, we can see that BTC moved upward after breaking through its taker-seller zone, with the breakout fueled by high volume and a whale candle. A strong resistance has now formed at $113,000, while a solid support floor is holding at $110,400. With today’s news, one of these levels is very likely to break. Keep in mind, today’s news is extremely important—if it turns out positive for crypto, the market could push higher and start a strong bullish leg.
⚙️ The RSI key zones are at 50 and 70. If volatility increases and momentum crosses above these levels, Bitcoin could kick off a strong move.
🕯 The size and volume of green candles have increased, building a very solid support around $110,400. Price is currently sitting in a resistance area, and with the NFP release we could see strong candles forming with high volume.
📊 On the 1H timeframe of Tether dominance (USDT.D), we see that after its recent bullish leg, it formed a trendline which has now been broken, followed by a pullback. Currently, USDT dominance is sitting at a very important support floor. If this floor breaks, a significant amount of Tether could flow into Bitcoin and altcoins.
🔔 The alarm zones for Bitcoin are set at $113,000 and $110,400—these are the levels to watch and place alerts on. Since we have the NFP news release today, a potential whale move is likely. If you’re planning to trade the news, define a small risk, use trigger orders, and make sure to apply strict risk management!
❤️ Disclaimer : This analysis is purely based on my personal opinion and I only trade if the stated triggers are activated .
Euro holds firm as dollar slips on Fed cut betsEuro holds firm as dollar slips on Fed cut bets
The euro traded near $1.167, steady despite U.S. dollar weakness fueled by soft labor data. Private payrolls rose 54,000 in August versus 65,000 expected, job openings fell to 7.18 million, the lowest since September 2024, and jobless claims hit a two-month high—signaling a cooling labor market.
Markets now expect a 0.25% Fed rate cut in September, which could further weigh on the dollar and support EUR/USD. Traders should monitor upcoming U.S. data for additional easing signals.
In France, a confidence vote on Prime Minister François Bayrou’s budget plan is unlikely to impact the euro significantly, ING says. Even if Bayrou loses, President Macron is expected to appoint a new centrist or center-right PM with a softer fiscal plan. While political uncertainty remains, it’s largely priced in.

Labor Market vs. Inflation Risks: What Traders Should WatchCME_MINI:NQ1! CME_MINI:ES1! CME_MINI:MNQ1! CME_MINI:MES1! CBOT_MINI:YM1! CBOT:ZN1! CBOT:ZB1! ECONOMICS:USNFP
The stock market is currently holding near all-time highs. Today, the BLS (Bureau of Labor Statistics) report, which includes the NFP (non-farm payrolls), will be released at 7:30 am CT.
Market participants are closely watching the non-farm payrolls, with the forecast at 75K, as well as any prior revisions to earlier NFP numbers. The unemployment rate is expected at 4.3%, a slight increase of 0.1%.
Looking ahead, upcoming key events include inflation data and the September FOMC rate decision:
• Aug PPI (Sep 10): A gauge of upstream price pressures. Hot numbers would signal renewed inflation risks.
• Aug CPI & Core CPI (Sep 11): Critical headline data. A softer print would support the dovish case.
• Fed Decision (Sep 17): This meeting comes after the Aug NFP data release (Sep 5).
While there is broad optimism and euphoria in the market, we remain cautious based on our analysis of major futures indexes. Traders should be mindful of signals that could point to a pullback.
Our reasoning:
Markets are currently pricing in two 25 bps cuts for the September and October FOMC meetings, which would bring the target rate down to 3.75%–4.00%.
Additionally, markets are now pricing in four 25 bps cuts in 2026. Prior to the Jackson Hole meeting and recent Fed-related developments, expectations were for three cuts in 2025 and two cuts in 2026.
Does this imply that the effective tariff rate is benign? Is inflation expected to fall, or does this suggest that the Fed is willing to tolerate average inflation in the 2.5%–3.0% range?
The upcoming Fed meeting is likely to emphasize risks to the labor market, while downplaying inflation risks, highlighting the tradeoff within the Fed’s dual mandate.
Other considerations:
Seasonal and cyclical flows also suggest that equity indexes tend to underperform in September and October on average.
Risk-Monitoring Framework: Signs of a Pullback
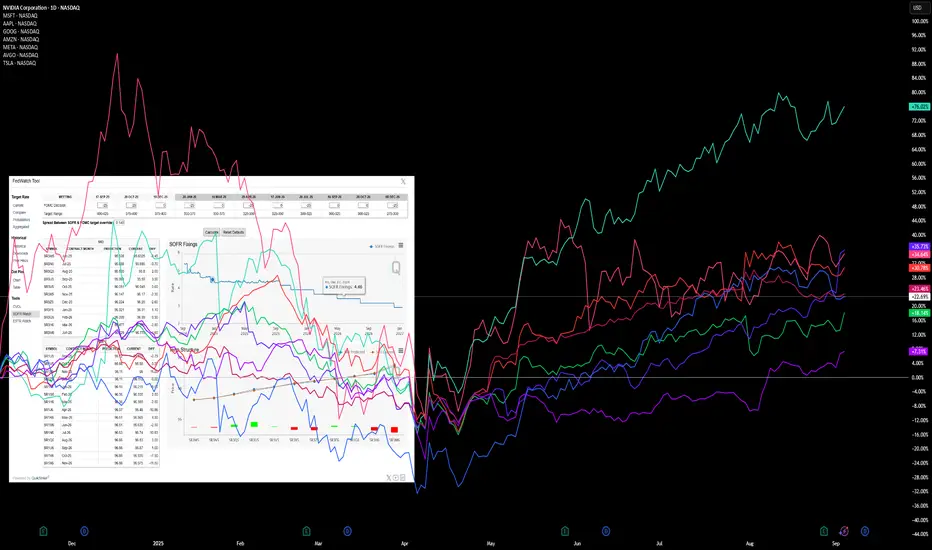
Given the deteriorating macro backdrop, further steepening of the yield curve, persistently high long-end yields, and the heavy concentration of stock market capitalization in the Mag 9 stocks, it is critical to monitor:
1. Rates & Yield Curve
• 2s10s & 5s30s steepening: Excess steepening with long-end yields above 4.5% would tighten financial conditions.
• SOFR futures spreads: Divergence vs. FOMC guidance can signal rate-path misalignment.
2. Labor Market Signals
• NFP revisions: Downward revisions of >50K would reinforce labor weakness.
• Unemployment rate: Sustained above 4.3% could mark a turning point for the Fed’s labor mandate.
3. Inflation Data
• PPI upside surprises: A risk that supply-side shocks re-ignite inflationary pressures.
• CPI/Core CPI stickiness: Core >3.1% YoY would challenge the market’s dovish pricing.
4. Equity Market Internals
• Mag 9 leadership: Watch for relative weakness in NVDA, AAPL, MSFT, AMZN, META, TSLA, GOOG, AVGO, and BRK.A.
• Breadth indicators: Advance/decline line and % of S&P 500 above 200-day MA. Narrowing breadth = fragility.
• Volatility (VIX): A spike above 20 would indicate stress returning to equity risk sentiment.
5. Cross-Asset Indicators
• Credit spreads (IG & HY): Widening signals stress in funding markets.
• USD & Commodities: Rising USD and higher energy prices would tighten global liquidity.
Conclusion
While optimism remains strong, we caution that macro deterioration, yield curve dynamics, and concentrated equity leadership create fragility. Pullback risks rise if:
• NFP disappoints sharply,
• inflation re-accelerates, or
• outperformance in the Mag 9 begins to roll over.
Traders should monitor these risk indicators closely, as they often precede market drawdowns in September–October.
U.S. Natural Gas holds near 4-week highU.S. Natural Gas holds near 4-week high as storage builds match forecasts
U.S. natural gas stayed near a four-week high Thursday after EIA data showed inventories rose by 55 Bcf to 3,272 Bcf for the week ending Aug. 29, in line with expectations. Stocks remain 2.2% below last year but 5.6% above the five-year average, signaling ample supply despite record LNG exports and strong demand.
Higher production, with dry gas output at 107.1 Bcf/day, continues to pressure prices, while weather forecasts calling for warmer temperatures in mid-September may support short-term demand. LNG flows hit 15 Bcf/day, near record highs, as U.S. exports remain strong amid European and Asian demand.

Bitcoin faces bear market risk despite short-term rallyBitcoin faces bear market risk despite short-term rally
Bitcoin may enter a bear market by October 2025 if historical 4-year cycles play out, with a possible bottom near $50,000 by October 2026. Analysts project BTC could hit $140,000 before year-end but warn of a sharp drop afterward. While the “Repetition Fractal Cycle” signals a bearish shift, strong ETF inflows ($29.4B in 2025) and institutional demand could alter the pattern.
Currently, BTC is testing a key resistance trendline. A break below $100,000 would confirm a bearish outlook, while a move above $113,650 could revive momentum toward $140,000. Polymarket assigns a 59% chance of BTC falling under $100,000 by 2026. Macroeconomic headwinds and tighter regulations could accelerate a downturn.
In the short term, Bitcoin is up 2.1% at $112,876 — its highest in a week — ahead of U.S. jobs data, as markets bet on Fed rate cuts from September 17. Weaker ADP payrolls data boosted expectations for soft nonfarm payrolls Friday, which may support risky assets like crypto.

XAU/USD – FED dovish, gold extends momentum; SELL only for scalp⚓️ Captain Vincent – Gold Plan XAU/USD
1. Market Waves 🌍
The probability of a FED rate cut in September has surged to 96.6% (from 90.4% earlier) after the JOLTS report showed weakening job prospects.
Several FED officials, from Kashkari to Bostic, turned dovish. Only Musallim maintained a hawkish stance, with a scenario of just one cut.
As a result, flows rushed back into gold as the #1 safe haven , fueling a strong rally last night.
📌 Key data today (04/09 – US time):
ADP Nonfarm (7:15)
Jobless Claims (7:30)
ISM Services PMI (9:00)
👉 This trio of data could trigger significant volatility for GOLD.
2. Technical Outlook ⚙️
M30/H1 Chart: gold keeps forming bullish BOS , with the main trend still upward.
Golden Harbor 🏝️ (Buy Zone 3,477 – 3,479): old Order Block, strong support if price retraces.
Quick Boarding 🚤 (Sell Scalp 3,561 – 3,563): suitable only for short-term scalps.
Storm Breaker 🌊 (Sell Zone 3,573 – 3,575): aligned with fibo 0.618–0.786 resistance, high chance of strong supply.
Captain’s Shield 🛡️ (Support): 3,526 – 3,515 – 3,508
3. Captain Vincent’s Map – Trade Scenarios 🪙
🔺 Golden Harbor 🏝️ (BUY – Priority)
Entry: 3,477 – 3,479
SL: 3,470
TP: 3,480 → 3,483 → 3,486 → 3,491 → 349x → 35xx
🚤 Quick Boarding (SELL Scalp – short-term only)
Entry: 3,561 – 3,563
SL: 3,569
TP: 3,558 → 3,555 → 3,552 → 354x
🌊 Storm Breaker (SELL Zone – strong resistance)
Entry: 3,573 – 3,575
SL: 3,581
TP: 3,570 → 3,565 → 3,560 → 3,555 → 35xx
4. Captain’s Note ⚓
“The gold sail is filled with dovish winds from the FED. Golden Harbor 🏝️ 3477 remains the safe anchor to ride the trend. SELL setups are just Quick Boarding 🚤 scalps at Storm Breaker 🌊 , not long voyages.”

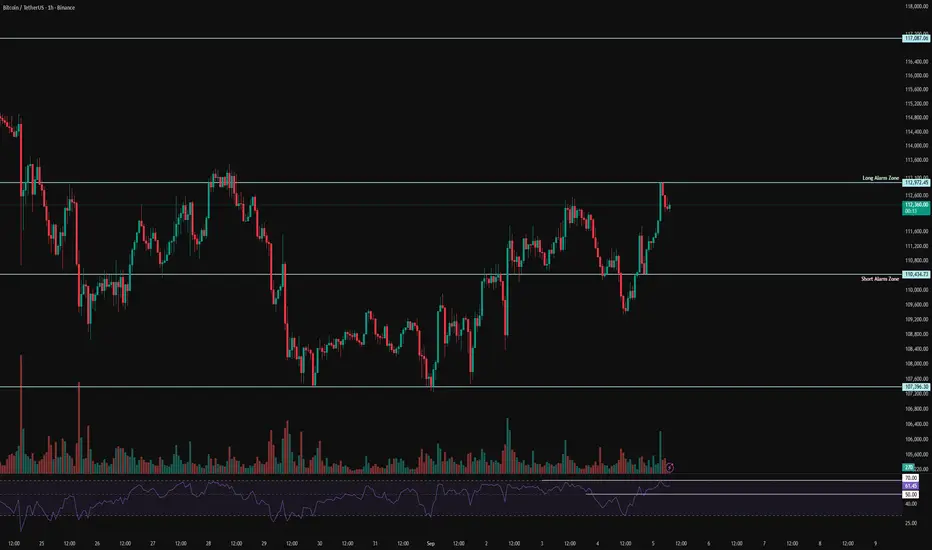
TradeCityPro | Bitcoin Daily Analysis #169👋 Welcome to TradeCity Pro!
Let’s move on to analyzing Bitcoin. It has had a very important reaction to the resistance zone we had, and we need to see which direction its next move will be. So stay with me as we review it.
⏳ 4-Hour Timeframe
After breaking its descending trendline, Bitcoin made a short upward move and reached the resistance zone.
🔍 However, once it touched this zone, the price was rejected and corrected down to 109577. This correction can extend further as a pullback to the trendline or even to the 107467 zone.
💥 If this deeper correction occurs and selling volume increases at the same time, the probability of breaking 107467 rises. This would not be favorable for Bitcoin’s bullish trend, and it would be better for this zone not to be lost.
📊 In case 107467 breaks with higher volume, we can open a short position. This would be considered a very risky trade, and I would personally put very little risk into it.
📈 On the other hand, if an upward move resumes and the resistance zone breaks, the price could begin a new bullish move toward higher resistances such as 117048, 119096, or even 122545.
📰 Tomorrow, the U.S. unemployment rate report will be released, which can significantly affect the market. The probability of a new wave beginning after this news is high, so make sure you’re on alert to have an open position if the market decides to move.

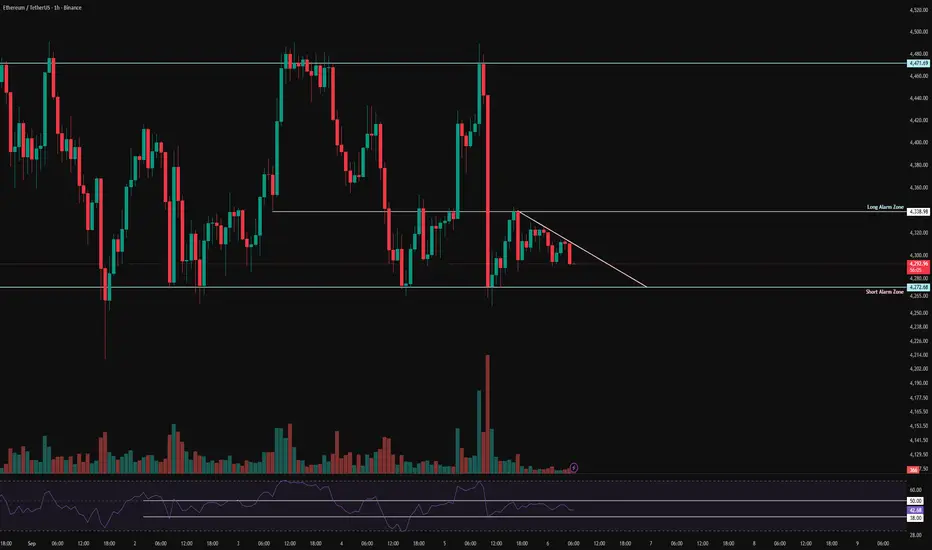
ETH 1H Analysis - Key Triggers Ahead | Day 12💀 Hey , how's it going ? Come over here — Satoshi got something for you !
⏰ We’re analyzing ETH on the 1-hour timeframe timeframe .
🔭 On the 1H timeframe of Ethereum, we can see that ETH is moving inside a very tight consolidation box along with heavy profit-taking. It has been strongly supported around the $4277 level. As a result, both the top and bottom of this 1H range appear very solid. Ethereum is currently in an accumulation phase, and it could break out of this box with tomorrow’s news. The key levels to watch are exactly the top and bottom of this range.
⛏ On the RSI, the critical zones are around 40 and 70 (Overbought). If price momentum pushes beyond these zones, Ethereum could experience a strong move. Tomorrow’s news is likely to have a significant impact on ETH volatility.
💰 The size, volume, and number of green candles are greater compared to the red ones. This structure indicates a price compression pattern. A taker-seller zone exists around $4480, where more sell orders keep activating. On the other hand, there’s a maker-buyer zone at the bottom of the box that supports ETH whenever price reaches it.
📊 On the 4H timeframe of ETHBTC, the pair is moving inside a descending channel. Each time price touches the channel’s bottom, it finds support. Currently, ETHBTC has formed a V-pattern, and if it breaks the neckline, more Bitcoin could be converted into Ethereum. However, for this breakout to happen, the RSI across the 1H–4H multi-timeframes needs to move into the Overbought zone.
💡 The alarm zones for Ethereum are set at $4272 and $4480. Breaking either of these levels could trigger a strong move. For a long setup, breaking above $4480 requires high volume and strong buying pressure to absorb the sell orders placed there. Tomorrow’s news is extremely important—most of the market is waiting for it. There’s a lot of talk about a potential interest rate cut, which will directly affect Ethereum’s trend. From a technical perspective, strong patterns have already formed, and their breakout will likely align with the NFP news release tomorrow.
❤️ Disclaimer : This analysis is purely based on my personal opinion and I only trade if the stated triggers are activated .

TradeCityPro | HYPE Weakens Inside Ascending Channel👋 Welcome to TradeCity Pro!
In this analysis, I want to review the HYPE coin for you. It is one of the coins that has recently trended and with a market cap of 15.31 billion dollars is ranked 12th on CoinMarketCap.
📅 Daily Timeframe
In the daily timeframe, this coin has had a very long-term upward trend that has now shown weakness after breaking the 31.132 zone, and its slope has decreased significantly.
✨ After the 31.132 break, an ascending channel has formed, and the price is correcting in the direction of the trend.
📊 The volume has gradually decreased, indicating weakness in this upward move, and on the other hand, RSI has shown a strong divergence.
💥 Of course, the RSI divergence has not yet been activated, and it is natural for RSI to show divergence when the price is in a correction and consolidation phase.
✅ Currently, the price is in the lower half of the channel and has reacted several times to the bottom and midline of the channel. If the resistance at 49.223 is broken, the price structure can change, and if volume starts to increase, the probability of breaking the channel top rises significantly.
⚡️ On the other hand, considering all the negative signs that have led to this trend weakness, the possibility of breaking the channel to the downside is also high.
📈 In that case, with the break of the 40.625 or 36.871 triggers, we can open a short position, but in my opinion, as long as the price is above the 31.132 zone, short positions are not logical and the market trend remains bullish.
📝 Final Thoughts
Stay calm, trade wisely, and let's capture the market's best opportunities!
This analysis reflects our opinions and is not financial advice.
Share your thoughts in the comments, and don’t forget to share this analysis with your friends! ❤️

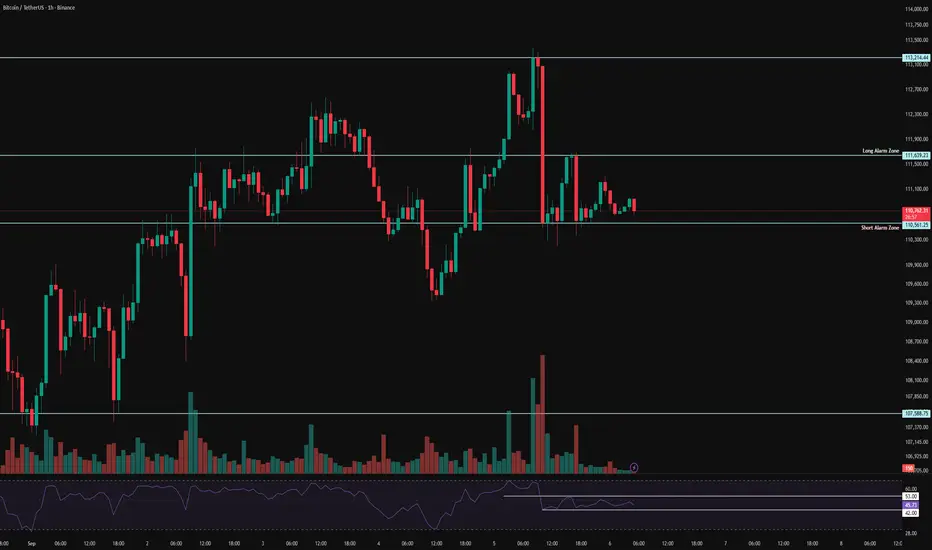
BTC Analysis 1H - Key Triggers Ahead | Day 32💀 Hey , how's it going ? Come over here — Satoshi got something for you !
⏰ We’re analyzing BTC on the 1-hour timeframe timeframe .
👀 On the 1H timeframe of Bitcoin, we can see that after yesterday’s news BTC moved upward but got rejected at the $112,300 zone. It then found support at the bottom of its ascending channel. Bitcoin is now waiting for tomorrow’s NFP release. The key level that price reacted to is $112,300 — a breakout above this zone could trigger another move to the upside. The current support is around $110,340, and if this level breaks, the next major support lies near $107,500.
⚙️ RSI key zones are at 36 and 70. If momentum breaks through these areas, Bitcoin could start a stronger move.
🕯 The size and volume of the recent red candles indicate selling pressure. However, when price bounced from the channel bottom, the bearish momentum weakened. If selling pressure increases and the support is lost, red candles may grow even larger.
📊 Looking at the 1H Tether dominance (USDT.D), after the recent drop it shows signs of a rebound and is completing its pullback on this timeframe. The key zones to watch are 4.39% and 4.47%. A breakout above these levels could bring significant trading volume into Bitcoin.
🔔 Alert zones for Bitcoin are set at $110,340 and $112,334. A breakout of either zone could provide us with trade opportunities. Keep in mind that the current structure is ranging and compressed, so it’s better to trade with lower risk.
❤️ Disclaimer : This analysis is purely based on my personal opinion and I only trade if the stated triggers are activated .

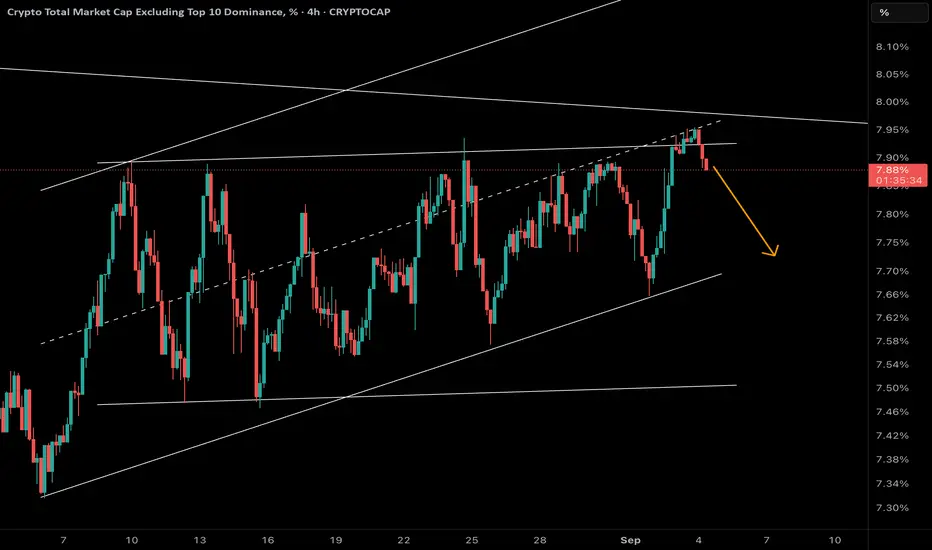
Altcoins Under Pressure–Others Dominance Rejected at Channel TOPOthers Dominance has just reacted negatively after touching the upper boundary of its rising channel and aligning with the midline of a larger channel. This confluence has triggered a bearish rejection.
📉 Likely Scenario:
If this rejection holds, Others Dominance could decline toward the channel bottom near 7.7%, signaling increased selling pressure on altcoins.
⚡ Conclusion:
As long as the resistance zone holds, the short-term outlook remains bearish. A clean breakout above resistance would be needed to shift this bias.
GOLD: market at a crossroads after the impulseOn the 1H chart, gold remains in an uptrend channel, but after testing the 3545–3550 zone, a corrective pullback is possible. The red lines represent a projected head-and-shoulders scenario, but the pattern is not yet confirmed - it remains only a forecast. Key levels to watch: 3510 as initial support and 3480 as a deeper target if price breaks the channel to the downside. As long as price holds above, the broader trend remains bullish.
From a fundamental perspective , weak ADP employment data provided short-term support, yet the market reaction was muted since dovish Fed expectations are already priced in. Stronger dollar data or rising Treasury yields could put renewed pressure on gold. Fed commentary in the coming days will be crucial for market direction.
Tactical plan: monitor the 3545–3550 zone where sellers may step in. A confirmed break below 3510 opens the way to 3480, but without a completed head-and-shoulders, the move remains speculative. Gold is notorious for punishing premature shorts, so caution is warranted.

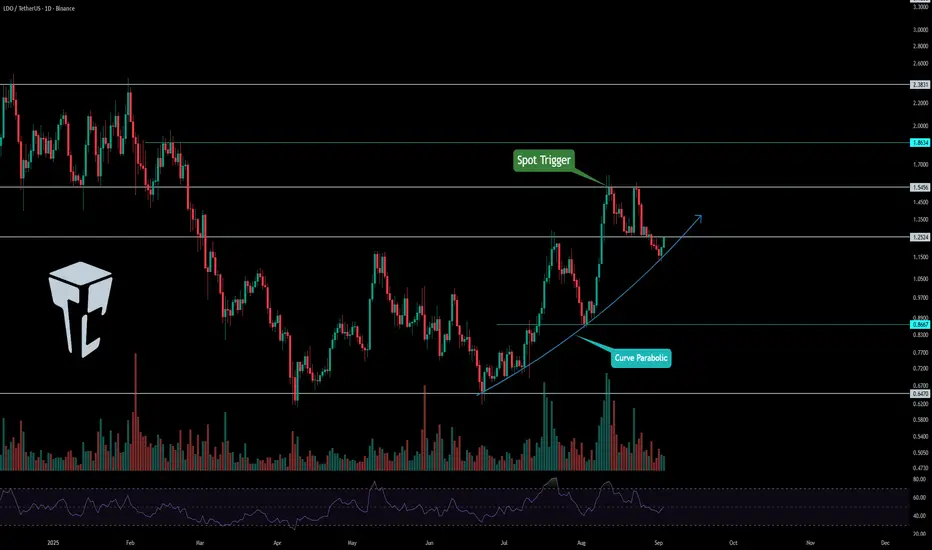
TradeCityPro | LDOUSDT The Best Spot Entry Point👋 Welcome to TradeCityPro Channel!
Let's move on to the LDO analysis, which has the most Ethereum possible in this staking network, and its job is to form nodes and structure transactions, and it has solved the problem of having 32 Ethereum to be a validator.
🌐 Overview of Bitcoin
Before starting the analysis, let me remind you again that we moved the Bitcoin analysis section out of this part and made it a separate daily analysis as per your request, so we can discuss Bitcoin’s condition in more detail and analyze its charts and dominance separately.
This is the general Bitcoin dominance analysis that we promised to cover separately and analyze in longer time frames:
🔗
📊 Weekly Timeframe
After the previous decline, LDO reached the important weekly support at 0.647 and showed a reaction.
With buyer presence, the price moved upward and is now sitting right under a resistance that once acted as a strong support. After breaking that level in the past, the price made a sharp move which makes this an important zone to watch.
🔗
📊 Daily Timeframe
On the daily chart, after bouncing from the 0.647 support area, LDO built a new structure.
Gradually, this move formed into a parabolic curve where every bounce from it triggered sharp upward movements.
For a spot buy entry, a risky strategy would be to buy on this curve reaction with a wide stop-loss (e.g., 0.8667).
However, I personally prefer waiting for the breakout of 1.5450, since that will allow me to set a tighter stop-loss and manage my capital more effectively, enabling me to take on higher risk within my risk management rules.
📝 Final Thoughts
Stay calm, trade wisely, and let's capture the market's best opportunities!
This analysis reflects our opinions and is not financial advice.
Share your thoughts in the comments, and don’t forget to share this analysis with your friends! ❤️
TradeCityPro | Bitcoin Daily Analysis #168👋 Welcome to TradeCity Pro!
Let’s move on to the Bitcoin analysis. Yesterday Bitcoin made an upward move and has now reached an important zone. Let’s see how the market wants to react to this resistance.
⏳ 1-Hour Timeframe
Yesterday Bitcoin briefly faked a breakout of its trendline but then broke it again and also activated its trigger.
🔍 Currently, the price has reached the resistance zone and is trying to penetrate it. The volume has increased throughout this upward move, which shows the strength of the buyers.
📊 If you opened a position with the triggers we had, now is not a bad time to take some profit and secure your position. But definitely leave a portion of it open so that in case the zone breaks, you won’t be left without a position.
🔔 Even with the breakout of this zone, a new long position can be opened. This zone has a lot of sell orders, and if the price manages to push through them, it can begin a sharp upward move.
💥 The RSI oscillator is stabilizing above the 64.09 level, which is a very good sign for buyers and increases the probability of breaking the zone.
✔️ However, if this RSI level fakes out, the chance of rejection from the zone rises, and in that case, the price correction can continue down to the 110721 and 109577 levels.
❌ Disclaimer ❌
Trading futures is highly risky and dangerous. If you're not an expert, these triggers may not be suitable for you. You should first learn risk and capital management. You can also use the educational content from this channel.
Finally, these triggers reflect my personal opinions on price action, and the market may move completely against this analysis. So, do your own research before opening any position.

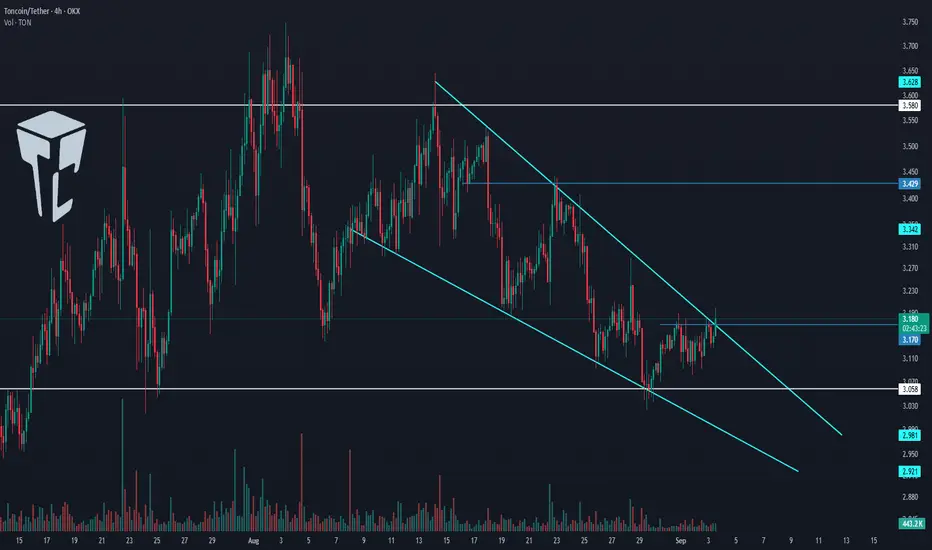
TradeCityPro | TON Testing Wedge Breakout Amid Key Support🙏 Welcome to TradeCity Pro!
In this analysis I want to review the TON coin for you. One of the popular crypto coins that with a market cap of 8.09 billion dollars is ranked 22 on CoinMarketCap.
⏳ 4-Hour Timeframe
In the 4-hour timeframe this coin has formed a descending wedge and has reached the support of 3.058.
📊 Currently the price has reached the top of the wedge and if 3.170 is broken its upward movement can begin.
🧩 Considering that the price has reached the end of this wedge the reduction in volume is logical and with the breakout of the wedge whether from above or below a lot of volume will enter the market.
📈 If the wedge is broken from above and the 3.17 trigger is activated I will try to open a long position. Breaking this level can start a new upward leg in higher cycles.
🔔 In case of rejection from the top of the wedge and moving towards the 3.058 support if this level breaks the price can start a downward leg and even break the wedge from below.
📝 Final Thoughts
Stay calm, trade wisely, and let's capture the market's best opportunities!
This analysis reflects our opinions and is not financial advice.
Share your thoughts in the comments, and don’t forget to share this analysis with your friends! ❤️
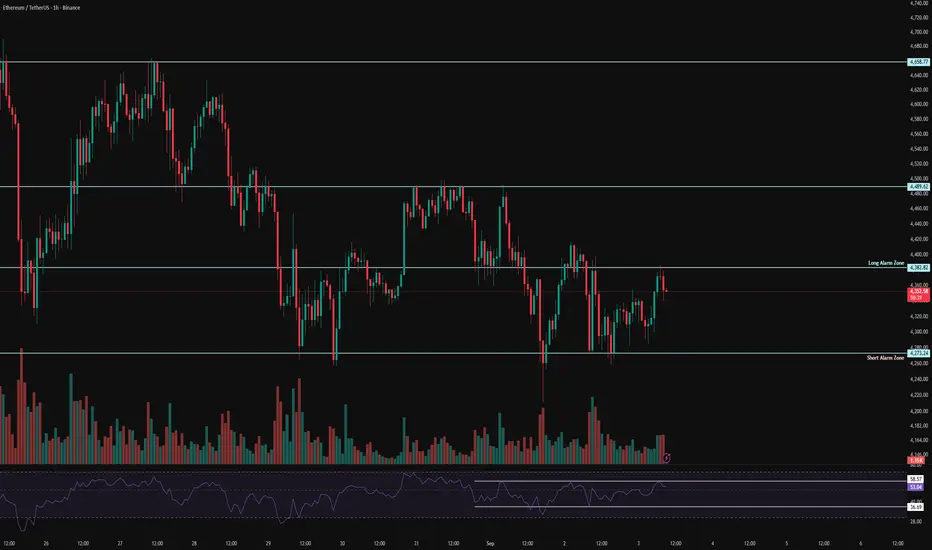
ETH 1H Analysis - Key Triggers Ahead | Day 11💀 Hey , how's it going ? Come over here — Satoshi got something for you !
⏰ We’re analyzing ETH on the 1-hour timeframe timeframe .
🔭 On the 1-hour timeframe of Ethereum, we can see that ETH has a similar situation to yesterday. It has an important resistance at $4382, and with a breakout and confirmation above this level, Ethereum could experience a good bullish leg. Keep in mind, according to the data we posted in the channel, yesterday people in the U.S. sold their ETH and bought Bitcoin.
⛏ Two key RSI zones for Ethereum are considered: 58 and 37. Once the oscillation limit crosses these numbers, ETH can start its move.
💰 The volume and the size of green candles in Ethereum have slightly increased, and with more volume and the filling of sell orders at the $4382 resistance, Ethereum could move upward.
🪙💸 On the 1-hour timeframe of the ETHBTC trading pair, we can see that this pair had a resistance at 0.03909, which was successfully broken with higher volume. With a completed pullback and breakout above 0.03939, Ethereum could move upward. Note that this level is directly related to the maker buyers of this pair, and in this timeframe, it’s almost at its bottom.
🔔 Two alarm zones are considered for Ethereum: the $4382 level as our long trade alarm zone, where with a breakout and confirmation above it ETH could move higher; and the $4273 level as the short trade alarm zone, where a breakdown could give us a short position.
❤️ Disclaimer : This analysis is purely based on my personal opinion and I only trade if the stated triggers are activated .