JetBlue- tie with recent lows? Or plowing through all-time highs 1. Mixed Financial Results and Volatility
JetBlue’s Q4 2025 earnings revealed the airline still isn’t consistently profitable — EPS of -$0.49 missed expectations and margins remain negative — yet revenues slightly beat forecasts and unit revenue improved, showing that demand isn’t collapsing.
Thi
Next report date
—
Report period
—
EPS estimate
—
Revenue estimate
—
−1.94 USD
−602.00 M USD
9.06 B USD
298.67 M
About JetBlue Airways Corporation
Sector
Industry
CEO
Joanna L. Geraghty
Website
Headquarters
Long Island City
Founded
2021
IPO date
Apr 12, 2002
Identifiers
3
ISIN US4771431016
JetBlue Airways Corp. engages in the provision of air transportation services. Its brands include jetBlue, jetBlue Vacations, Paisly, and TrueBlue. It operates through the following geographic segments: Domestic and Canada, Caribbean and Latin America, and Atlantic. The company was founded by David Gary Neeleman in August 1998 and is headquartered in Long Island City, NY.
Related stocks
JetBlue Airways | JBLU | Long at $5.92JetBlue NASDAQ:JBLU - Earnings and revenue beat today, stock drops -26% by noon.
2025 Outlook:
"For the first quarter of 2025, JetBlue expects its available seat miles (ASM) to decline 2% to 5% year-over-year, with revenue per ASM projected to range from a 0.5% decline to a 3.5% gain, while an
JBLU Gamma Squeeze Potential — Weekly Trade📈 JBLU Weekly Trade
Direction: Speculative bullish / Call
Instrument: JBLU $5.50 Call
Expiry: Feb 6, 2026 (Friday)
Entry Zone: $0.11 – $0.12
🎯 Targets
Target 1: $0.14 (+25%) → scale 50%
Target 2: $0.19 (+60%+) → let runner ride
Risk: Stop loss: $0.085 (-25%)
Hard exit: JBLU below $5.00
Trade
Key LevelsJBLU Setup: High-Confluence Rejection at the 50 EMA & Fibonacci Golden Zone
JetBlue (JBLU) is displaying a high-probability bullish reversal setup as the minor pullback from December highs appears to be exhausting. We have a clear Hammer candle printed precisely at the 50 EMA ($4.65), which is over
Low Risk, Newbie Swing TradeJetBlue Airways (JBLU) Trade Plan
Ticker: JBLU
Exchange: NASDAQ
Current Price: ~$4.72
Chart Timeframe: 1D (Daily)
Upcoming Catalyst: Earnings – October 28, 2025
Resistance Zones:
$5.55 – Strong resistance from past highs.
$5.07 – Near-term resistance where price has repeatedly rejected.
Su
JBLU: Breakthrough and growth potentialAn analysis of JetBlue Airways (JBLU) shares on the daily chart indicates the formation of a bullish pattern with a clear breakout of the resistance level. After consolidation and a rebound from significant support levels, the price broke through the upper boundary of the descending triangle, which
Jetblue Stock Chart Fibonacci Analysis 082225Trading Idea
1) Find a FIBO slingshot
2) Check FIBO 61.80% level
3) Entry Point > 5.0/61.80%
Chart time frame:B
A) 15 min(1W-3M)
B) 1 hr(3M-6M)
C) 4 hr(6M-1year)
D) 1 day(1-3years)
Stock progress:C
A) Keep rising over 61.80% resistance
B) 61.80% resistance
C) 61.80% support
D) Hit the bottom
E)
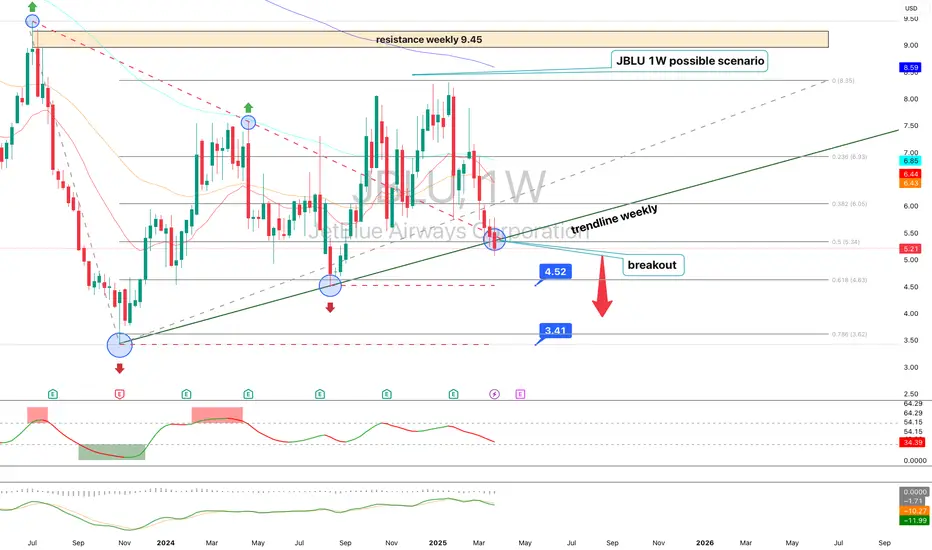
JetBlue Airways (JBLU) – Technical Analysis 1WJetBlue shares have broken a key weekly trendline, reinforcing a bearish outlook. After breaking support at $5.21, the price is heading toward $4.52 and potentially $3.41.
Technical indicators confirm the weakness: RSI shows declining momentum, MACD signals a bearish crossover, and EMA 50/200 indi
See all ideas
Summarizing what the indicators are suggesting.
Neutral
SellBuy
Strong sellStrong buy
Strong sellSellNeutralBuyStrong buy
Neutral
SellBuy
Strong sellStrong buy
Strong sellSellNeutralBuyStrong buy
Neutral
SellBuy
Strong sellStrong buy
Strong sellSellNeutralBuyStrong buy
An aggregate view of professional's ratings.
Neutral
SellBuy
Strong sellStrong buy
Strong sellSellNeutralBuyStrong buy
Neutral
SellBuy
Strong sellStrong buy
Strong sellSellNeutralBuyStrong buy
Neutral
SellBuy
Strong sellStrong buy
Strong sellSellNeutralBuyStrong buy
Displays a symbol's price movements over previous years to identify recurring trends.
Frequently asked questions
The current price of JBLU is 4.70 USD — it has decreased by −0.63% in the past 24 hours. Watch JetBlue Airways Corporation stock price performance more closely on the chart.
Depending on the exchange, the stock ticker may vary. For instance, on NASDAQ exchange JetBlue Airways Corporation stocks are traded under the ticker JBLU.
JBLU stock has fallen by −7.66% compared to the previous week, the month change is a 2.84% rise, over the last year JetBlue Airways Corporation has showed a −3.09% decrease.
We've gathered analysts' opinions on JetBlue Airways Corporation future price: according to them, JBLU price has a max estimate of 8.00 USD and a min estimate of 2.00 USD. Watch JBLU chart and read a more detailed JetBlue Airways Corporation stock forecast: see what analysts think of JetBlue Airways Corporation and suggest that you do with its stocks.
JBLU reached its all-time high on Oct 9, 2003 with the price of 31.43 USD, and its all-time low was 2.81 USD and was reached on Mar 5, 2009. View more price dynamics on JBLU chart.
See other stocks reaching their highest and lowest prices.
JBLU stock is 2.15% volatile and has beta coefficient of 2.04. Track JetBlue Airways Corporation stock price on the chart and check out the list of the most volatile stocks — is JetBlue Airways Corporation there?
Today JetBlue Airways Corporation has the market capitalization of 1.76 B, it has decreased by −7.81% over the last week.
Yes, you can track JetBlue Airways Corporation financials in yearly and quarterly reports right on TradingView.
JetBlue Airways Corporation is going to release the next earnings report on Aug 4, 2026. Keep track of upcoming events with our Earnings Calendar.
JBLU earnings for the last quarter are −0.87 USD per share, whereas the estimation was −0.73 USD resulting in a −19.49% surprise. The estimated earnings for the next quarter are −0.79 USD per share. See more details about JetBlue Airways Corporation earnings.
JetBlue Airways Corporation revenue for the last quarter amounts to 2.24 B USD, despite the estimated figure of 2.24 B USD. In the next quarter, revenue is expected to reach 2.66 B USD.
JBLU net income for the last quarter is −319.00 M USD, while the quarter before that showed −177.00 M USD of net income which accounts for 0.00% change. Track more JetBlue Airways Corporation financial stats to get the full picture.
No, JBLU doesn't pay any dividends to its shareholders. But don't worry, we've prepared a list of high-dividend stocks for you.
EBITDA measures a company's operating performance, its growth signifies an improvement in the efficiency of a company. JetBlue Airways Corporation EBITDA is 311.00 M USD, and current EBITDA margin is 3.86%. See more stats in JetBlue Airways Corporation financial statements.
Like other stocks, JBLU shares are traded on stock exchanges, e.g. Nasdaq, Nyse, Euronext, and the easiest way to buy them is through an online stock broker. To do this, you need to open an account and follow a broker's procedures, then start trading. You can trade JetBlue Airways Corporation stock right from TradingView charts — choose your broker and connect to your account.
Investing in stocks requires a comprehensive research: you should carefully study all the available data, e.g. company's financials, related news, and its technical analysis. So JetBlue Airways Corporation technincal analysis shows the strong sell today, and its 1 week rating is strong sell. Since market conditions are prone to changes, it's worth looking a bit further into the future — according to the 1 month rating JetBlue Airways Corporation stock shows the strong sell signal. See more of JetBlue Airways Corporation technicals for a more comprehensive analysis.
If you're still not sure, try looking for inspiration in our curated watchlists.