BTC/USDT – 4H Technical OutlookBTC/USDT – 4H Technical Outlook
📊 Market Structure:
Bitcoin recently experienced a bearish shift in structure (CHoCH + BOS to the downside) after being rejected from the premium zone around 115,000.
After forming a strong swing low near 108,000, the market rebounded and printed a higher low, suggesting short-term bullish correction within an overall bearish context.
Currently, price is testing the EMA confluence zone near 111,000, which is acting as short-term resistance.
📈 Key Levels:
Resistance Zone (Equilibrium / Supply Zone): 113,500 – 115,000
Current Reaction Zone: 110,500 – 111,500
Support Zone: 108,000 – 109,000
⚙️ EMA Confluence:
The 89 EMA (blue) and 200 EMA (yellow) are both positioned above current price, confirming a bearish market structure.
Price is now testing the 89 EMA from below — a typical retracement area before continuation down.
📉 Momentum (Stochastic RSI):
The Stochastic RSI has turned down sharply from the overbought zone, indicating decreasing bullish momentum and possible continuation of the downtrend.
🎯 Trading Scenarios:
Scenario 1 – Sell (Trend Continuation)
Entry: 110,800 – 111,500 (retest of EMA zone)
Stop Loss: 113,000
Take Profit: 108,000 → 107,000
Confluence: EMA rejection + bearish structure + RSI reversal from overbought
Scenario 2 – Buy (Reversal Confirmation Only)
Entry: 113,500 – 114,000 (after clear breakout & retest)
Stop Loss: 112,500
Take Profit: 115,000 → 116,000
Confluence: Break above 89/200 EMA + BOS confirmation
💡 Summary Insight:
BTC/USDT remains bearish-biased below 111,500–113,500.
Expect a possible retest of EMA resistance before continuation toward 108,000.
Only a strong 4H candle close above 113,500 would shift momentum to bullish.
Tradingview

Major Breakout Setup Forming on Bitcoin’s 1-Hour Chart👋🏻 Hey everyone! Hope you’re doing great! Welcome to SatoshiFrame channel.
✨ Today we’re diving into the 1-Hour Bitcoin analysis. Stay tuned and follow along!
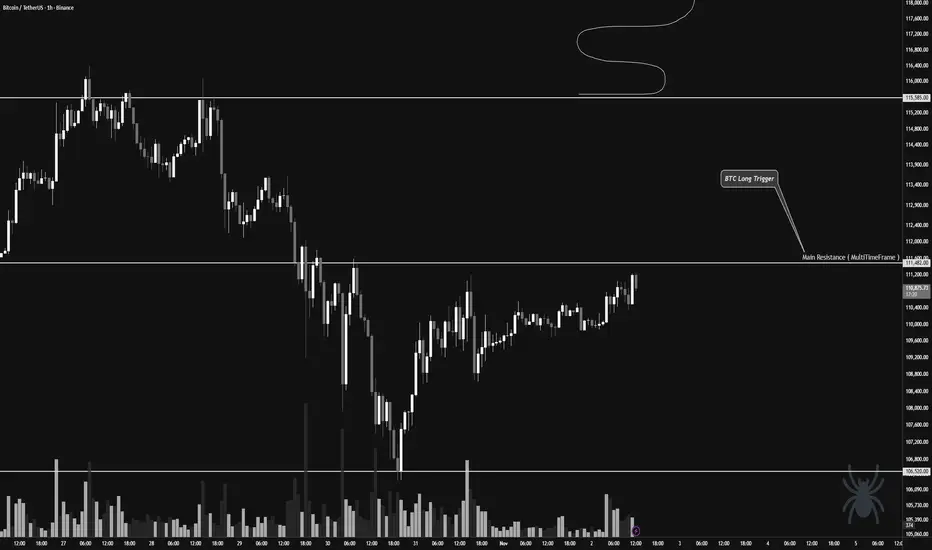
👀 On Bitcoin’s 1-hour timeframe, we can see that Bitcoin has built a multi-timeframe accumulation zone as the weekend began. It has now successfully broken above the top of this range, but we have a notable resistance area to keep an eye on.
The $111,482 price zone is a strong resistance level, and when price reached this zone, it faced heavy rejection and selling pressure. This area could provide the best trigger for a breakout. If Bitcoin manages to break above it, we could see a strong bullish leg and further upside momentum.
🧲 Bitcoin’s trading volume has slightly decreased over the past few days, so we’re waiting for volume expansion during the New York session to see what kind of reaction we get — this will guide our trade setup. Since there’s also a meeting between the U.S. and Chinese presidents tomorrow, we might prepare a speculative position ahead of that event to capture potential volatility and profits.
My current bias on Bitcoin remains bullish, as the trend hasn’t broken any significant support levels yet.
💵 Meanwhile, Tether Dominance (USDT.D) has reacted three times to its upper resistance zone on higher timeframes but failed to break above it. This suggests a bullish outlook for the crypto market, as a rejection in Tether Dominance could lead to downside movement there — fueling a strong bullish leg across the market.
✍️ The main long setup will trigger on a break above the $111,482 resistance zone. Confirmation can be taken from RSI oscillator signals and increasing buying volume.
We can open this low-risk long position (around 0.5% risk), and if tomorrow’s session brings clear bullish triggers, we can add to the position for larger exposure.
❤️ Disclaimer : This analysis is purely based on my personal opinion and I only trade if the stated triggers are activated .
TWLO - Downtrend line BROKEN!TWLO - CURRENT PRICE : 134.88
The chart shared here is the weekly chart, where TWLO broke above its downtrend line with strong volume — a signal of growing bullish momentum. On the daily chart, TWLO formed a rising window (gap-up) last Friday — a bullish signal that often indicates strong buying momentum and potential continuation of the uptrend.
From a pattern analysis perspective, some traders may interpret the current setup as a bullish symmetrical triangle, indicating potential continuation to the upside. Next target will be 154.00 and 174.00. Support level is 114.73 (the low of window area based on daily chart).
ENTRY PRICE : 132.00 - 135.00
FIRST TARGET : 154.00
SECOND TARGET : 174.00
SUPPORT : 114.73 (CUTLOSS below this level on closing basis)

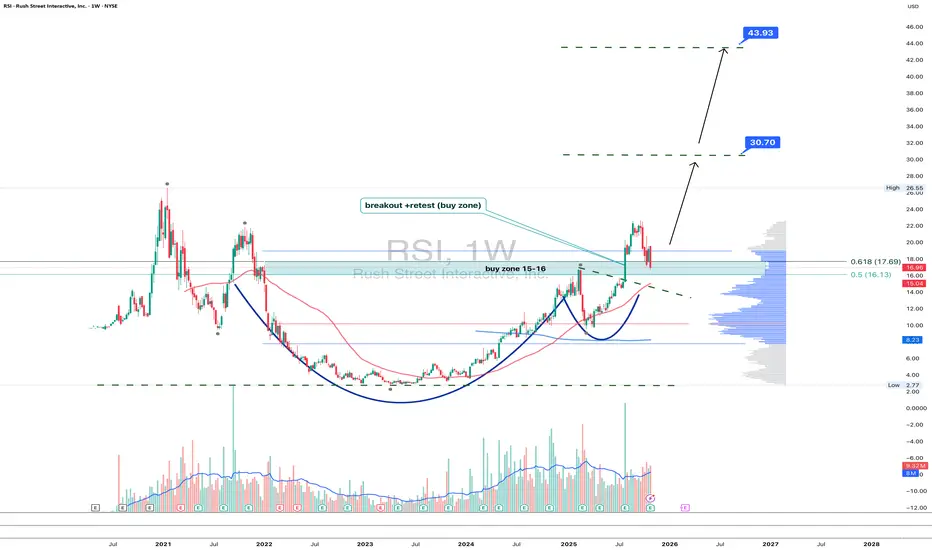
RSI 1W - gambling or smart retest?Rush Street Interactive (RSI) just confirmed a breakout above the 15–16 zone with a textbook retest - a classic bullish setup. The weekly chart shows a clean “cup and handle” structure backed by rising volume. Current pullback is forming right inside the buy zone, suggesting potential continuation.
Fibonacci extensions highlight 30.7 and 43.9 as key upside targets. As long as price holds above 15.5–16.0, the bullish bias stays intact. A breakout above 18.0 would confirm the next leg higher.
Fundamentally , RSI benefits from ongoing online gambling legalization across the US and improving profitability in core states, which could attract institutional inflows.
In the gambling world, luck rarely repeats - but this chart looks like the house might finally lose.
GBP/USD (4H) – Technical OutlookGBP/USD (4H) – Technical Outlook
📊 Market Structure:
The pair is in a clear bearish trend, consistently forming lower highs and lower lows.
Recent structure shows a Break of Structure (BOS) confirming continued bearish dominance.
Current candle action is forming a temporary bullish correction from the PDL (Previous Day Low) and demand zone, suggesting a short-term buy before further downside.
📉 Key Levels:
Resistance (Premium Zone): 1.3330 – 1.3400
Support (Discount Zone): 1.3100 – 1.3120 (current demand zone)
Equilibrium Zone: Around 1.3240
PDH: 1.3200
PML: 1.3300
📈 EMA Confluence:
Price remains below both the 89 EMA (blue) and 200 EMA (yellow) — confirming the bearish trend.
The gap between these EMAs shows strong downside momentum.
Any bullish movement toward 1.3240–1.3300 is likely to be a pullback rather than a reversal.
🎯 Trade Scenarios:
Scenario 1 – Short-Term Buy (Retracement Play):
Entry: 1.3120–1.3150 (PDL demand zone)
Take Profit: 1.3240–1.3300
Stop Loss: Below 1.3090
Confluence: Demand zone + bullish RSI divergence
Scenario 2 – Continuation Sell (Trend Resumption):
Entry: 1.3280–1.3330 (premium zone retest)
Take Profit: 1.3120 or lower
Stop Loss: Above 1.3370
Confluence: EMA resistance + supply zone rejection
📊 Indicators Insight:
Stochastic RSI rising from oversold territory — early sign of retracement, but momentum remains weak.
A bounce toward EMA or equilibrium zone may offer the next selling opportunity.
Summary:
GBP/USD remains in a bearish trend, trading below both the 89 EMA and 200 EMA.
Current move is likely a temporary correction from demand before trend continuation.
Watch for selling pressure to resume around 1.3240–1.3330

StevenTrading - $XAUUSD$: New Week Perspective – Prioritize...StevenTrading - OANDA:XAUUSD $: New Week Perspective – Prioritize BUYING According to Elliott Wave 5, Awaiting Range $3961$
Hello everyone, StevenTrading is back with the Gold scenario for the new trading week!
After a period of strong volatility, I am leaning towards more buying scenarios according to Elliott Wave 5.
Although retesting deeper support levels is possible, the technical structure still shows potential for price increase.
Initially, the structure on H1 is showing that the price is moving sideways within a wide range.
We will watch the price range to trade before Gold officially breaks the barrier!1.
📊 TECHNICAL STRUCTURE ANALYSIS
Elliott Wave: Prioritize the development scenario of Wave 5. This reinforces the medium-term upward trend.
H1 Structure: The price is fluctuating within a wide range, creating opportunities for Scalping/Day Trade at the upper/lower boundaries.2.
🎯 DETAILED TRADING PLAN (ACTION PLAN)
Our trading strategy this week is to actively buy at the lower boundary and defensively sell at the upper boundary to maximize the price range.
Primary BUY Scenario (BUY Primary):
We will patiently wait for Gold to adjust to the $3961$ area, an important liquidity support zone (near the Buy Liquidity/Buy Zone on the charts).
This is an ideal entry point to join the upward momentum according to Elliott Wave 5.
The Buy order will be activated at $3961$ with a stop loss SL $3950$ (set below support $3954$) to preserve capital.
Profit targets are divided into ascending levels: TP1 $3975$, TP2 $3990$, TP3 $4012$, and the final target is $4035$ as the price approaches the upper boundary.
SELL Scalping Scenario: To defend and take advantage of the adjustment, we will watch to Sell just below the strong resistance area at $4050$ (near old resistances and barrier zones). The Sell order will be placed with a tight stop loss SL $4060$. Profit targets will be prioritized for short-term (Scalping) to quickly secure profits.3.
📌 SUMMARY & DISCIPLINE (Steven's Note)The goal is to patiently wait for $3961$ to execute the BUY position with the lowest risk, pursuing the Elliott Wave 5 target. Capital management discipline and compliance with SL are mandatory in this wide range trading phase.
Are you ready to take advantage of this price range?

NAS100 | US100 (Nasdaq 4H) – Technical OutlookUS100 (Nasdaq 4H) – Technical Outlook
📊 Market Structure:
Price has recently formed a weak high around 26,200, rejecting from a premium / supply zone, signaling potential short-term bearish pressure.
The previous upward structure showed a BOS (Break of Structure) near 25,000, confirming bullish intent earlier — but now momentum is slowing as price returns below the PDH (Previous Day High).
The current 4H candles show strong bearish reaction, indicating sellers defending the premium zone.
📉 Key Levels:
Supply Zone (Premium Area): 26,000 – 26,200
Equilibrium Zone: Around 24,800 – 25,000
Immediate Support: 25,800 (current PD level)
Weekly Pivot (PW): 25,400 (potential short-term target)
📈 EMA Confluence:
Price has rejected from above the 89 EMA (blue) and is now testing below it.
The 200 EMA (yellow) continues to trend upward, showing long-term bullish momentum, but the shorter EMAs suggest a short-term pullback.
As long as price stays below 89 EMA, bias remains bearish to neutral in the near term.
🎯 Trade Scenarios:
Scenario 1 – Short-Term Sell Setup:
Entry Zone: 25,950 – 26,100 (retest of premium area or EMA rejection)
Take Profit: 25,400 (PW)
Stop Loss: Above 26,250
Confluence: Supply zone + weak high + bearish EMA alignment
Scenario 2 – Bullish Continuation (after retracement):
Wait for price to retrace to the equilibrium zone (24,800–25,000)
Look for bullish reaction with confirmation from Stochastic RSI divergence
Target: Return to 26,000
📊 Indicators Insight:
Stochastic RSI: Currently dropping from overbought territory, indicating possible continuation of short-term downside.
Momentum slowing — ideal for short retracement trades before potential reversal.
Summary:
US100 is rejecting from premium resistance near 26,200.
Short-term bias: bearish retracement toward 25,400 or deeper 25,000 equilibrium zone.
Long-term bias remains bullish, supported by 200 EMA structure — watch for confirmation before re-entry buys.

US Dollar Index (DXY) – 4H Technical OutlookUS Dollar Index (DXY) – 4H Technical Outlook
DXY has shown a clean bullish structure shift, breaking above previous highs and confirming multiple Breaks of Structure (BOS) around the 99.00–99.20 zone.
Currently, price is trading at 99.33, inside the premium zone, and testing the weak high area near 99.40–99.60.
📊 Market Structure:
The structure has turned bullish after a confirmed Change of Character (CHoCH) and a clean BOS above 98.80.
The equilibrium zone (98.40–98.60) previously acted as strong demand and was respected multiple times.
Price is now in a premium range, suggesting potential for a short-term pullback before further continuation.
🎯 Key Levels:
Premium / Supply Zone: 99.40–99.60 (possible liquidity grab or rejection zone)
Equilibrium / Demand Zone: 98.40–98.60 (ideal re-entry zone for continuation buys)
PDH (Previous Day High): 99.40
PDL (Previous Day Low): 98.60
🧭 Trade Scenarios:
Scenario 1 – Short-term Rejection:
If DXY rejects the 99.40–99.60 supply area, expect temporary USD weakness.
This could cause pairs like EUR/USD and GBP/USD to bounce up short-term.
Scenario 2 – Continuation Buy:
If price pulls back into 98.60 equilibrium zone and forms bullish confirmation, expect continuation toward 99.80–100.00.
Supported by the 50 EMA (blue) and 200 EMA (yellow) dynamic trend alignment.
📈 Momentum Indicators:
RSI/Stochastic are both near overbought zones, indicating short-term exhaustion.
A minor retracement is likely before continuation of the bullish leg.
Summary:
The DXY remains structurally bullish but short-term overextended.
Look for a pullback toward equilibrium (98.60 zone) before the next impulse move.
This macro setup supports short-term pullbacks on USD pairs, but the broader trend remains USD bullish

USD/JPY Technical Analysis (4H Chart)USD/JPY Technical Analysis (4H Chart)
USD/JPY is currently consolidating around 154.00, after a strong bullish impulsive move that broke structure (BOS) above 153.00. The pair is now reacting to the equal highs (EQH) zone near 154.50, which acts as a liquidity area.
📊 Market Context:
The recent BOS confirms a bullish structure.
Price is now in the premium zone, suggesting limited upside potential before a pullback.
The RSI/Stochastic show overbought conditions, indicating possible short-term exhaustion.
🎯 Key Levels:
Resistance / Liquidity Zone: 154.40–154.60 (EQH area – potential for liquidity grab and rejection)
Support / Re-entry Zone: 152.00–152.50 (Equilibrium + previous demand + EMA confluence)
Structure Confirmation: BOS at 153.00 remains valid for bullish bias.
🧭 Trade Scenarios:
Short-term Sell Setup:
Wait for rejection at 154.40–154.60 (EQH).
Target 153.00 → 152.50.
SL above 154.80 (liquidity sweep protection).
Continuation Buy Setup:
If price retests 152.50–152.00 equilibrium zone and forms bullish SMC confirmation.
Target new high above 154.60.
🧠 Pro Tip:
USD/JPY is heavily influenced by U.S. yields and DXY. If DXY weakens near its resistance zone, expect USD/JPY to correct lower before any continuation

TradeCityPro | Bitcoin Daily Analysis #207👋 Welcome to TradeCity Pro!
After a short break, let's get back to the daily Bitcoin analysis. The market is still in a very large range box.
⏳ 1-Hour Timeframe
Currently, Bitcoin is recovering after the drop to the 106319 level and has moved up to 110803.
✅ Today is Saturday, and as you can see, the market volume has dropped significantly. It seems that the market may range until tomorrow afternoon and won't move much upwards, with the main movement starting next week.
⚡️ The triggers we have for opening positions right now are:
For long: 110803
For short: 108844 and 106319
💥 Overall, Bitcoin is in a very large range box between 106319 and 115808, and as long as the price stays between these two levels, I will open my positions with very low risk.
❌ Disclaimer ❌
Trading futures is highly risky and dangerous. If you're not an expert, these triggers may not be suitable for you. You should first learn risk and capital management. You can also use the educational content from this channel.
Finally, these triggers reflect my personal opinions on price action, and the market may move completely against this analysis. So, do your own research before opening any position.

ASPN - cup, handle, and maybe the moonAspen Aerogels (ASPN) shows a textbook “cup and handle” pattern on the daily chart. The stock broke above the MA50 and MA200, forming a golden cross - a clear signal of trend reversal. The buy zone sits around 7.4–7.8 , where price has twice found support. Holding above 8.0 keeps the door open toward 11.3, 13.7, and possibly 16.0 - key supply levels from previous distribution.
On the fundamental side , ASPN benefits from strong interest in energy-efficient materials and aerogels used in green construction and EV insulation. With US policy support for clean tech, the company may catch a new growth wave.
Tactically , as long as price stays above 7.8 , the setup remains bullish. Break above 9.0 confirms further upside, while a drop below 7.0 cancels the pattern.
Every cup looks perfect until someone shakes the table - let’s see if this one stays steady.

SILVER 4H - double top before the dropAfter a strong rally, silver retested the 49.0–49.5 area aligning with the key 0.618 Fibonacci level. On the 4H chart, we see a clear double-top pattern with falling volume and oscillator divergence. Price already broke below the short-term trendline and failed to hold above resistance - a classic sign of fading bullish momentum.
Fundamentally, silver faces pressure as the dollar stabilizes and rate-cut expectations fade. Industrial demand from Asia is cooling too, reducing the “safe-haven” appeal.
Tactically, while price stays below 49.5, the path of least resistance is down toward 43.8 and possibly 41.1 - key accumulation zones. A breakout above 50.0 would cancel the bearish setup.
Every silver rally ends the same way - right when everyone starts to believe it’ll never end.

Will Ethereum’s tight range lead to a breakout? | Day 34☃️ Welcome to the cryptos winter , I hope you’ve started your day well.
⏰ We’re analyzing BTC on the 1-Day timeframe .
👀 Ethereum on the daily timeframe. Ethereum is currently inside a box-like structure in a trading range format. The top of this trading range is in the $4,161 area, and the bottom of this trading range is in the $3,801 price area, where by breaking these zones, Ethereum can start a stronger and more impulsive leg of movement.
🧮RSI oscillator, which has now formed two important oscillation zones for us — one around 54, which overlaps with our long trigger, and the other around 40, which overlaps with our short trigger. The fluctuation limit crossing these zones can give more momentum to Ethereum’s next move on the daily timeframe.
🕯 Ethereum’s volume, after the flash crash the market experienced, has increased sharply, but the tendency has been pushed toward selling pressure, which has caused Ethereum’s corrections to always come with selling pressure.
📈 For Ethereum positioning, the specified zones have high price action validity, where you can set alerts so that if the price reaches these zones, you can open a position. Or, in the multi-timeframe, you can find the identified support and resistance zones and open positions with lower risk around these areas, moving toward anticipating higher or lower levels, so that in each level, you can add some risk to your position.
❤️ Disclaimer : This analysis is purely based on my personal opinion and I only trade if the stated triggers are activated .

Has Bitcoin already priced in its next move ? | Day 56☃️ Welcome to the cryptos winter , I hope you’ve started your day well.
⏰ We’re analyzing BTC on the 1-Day timeframe .
👀 Bitcoin on the daily timeframe. After the flash crash it experienced, Bitcoin is almost building a box with a top at $114,559 and a bottom at $106,431, which by breaking these areas, it can get out of this trading range and give us a position.
The noteworthy point in the recent days is the Monday meeting between Trump and the President of China, which can determine the destiny of the market and give it a good direction.
🧮 The RSI oscillator, two key zones have formed for us in the areas of 54.5 and 36, and by the fluctuation limit crossing these areas, the next move of Bitcoin can begin.
🕯 Bitcoin’s volume on the daily timeframe has increased sharply after recording a new all-time high, and this has been a tendency toward increasing selling pressure. In the image, it is completely clear that you can see exactly what happened to the market after the flash crash it experienced.
📈 To take a position with this structural style that we currently have, you can refer to the multi-timeframe analysis of Bitcoin and extract the long and short position triggers, and if Bitcoin gives you an entry, enter the position around the anticipated top or bottom with low risk so that later you can add more volume to your position at higher or lower levels.
❤️ Disclaimer : This analysis is purely based on my personal opinion and I only trade if the stated triggers are activated .

FLNC 1D – The power comeback!On the daily chart, Fluence Energy (FLNC) shows a clean cup and handle formation followed by a golden cross (MA50 crossing above MA200) - a textbook bullish reversal setup.
Price broke out of the structure and is now pulling back into the buy zone ($14.57–$16.80) - a confluence of Fibonacci support and previous resistance.
✅ Golden cross confirms trend reversal
✅ Rising volume supports the move
✅ MAs below price - bulls are in control
The first target sits near $27.43, while the second projection extends to $40.28 if momentum continues.
Fundamentally, Fluence remains a leader in energy storage and grid technology - a hot spot for global investment as the renewable sector accelerates.
Let’s just say - this chart looks fully charged ⚡️

ARDX – Double Rising Window Hints Bullish ContinuationARDX – CURRENT PRICE : 6.06
The stock has broken above its long-term downtrend line accompanied by strong volume (look at red arrow). This breakout was confirmed by the formation of a Rising Window (1), signaling the end of the previous bearish phase.
Another Rising Window (2) appeared recently, again on high trading volume, reinforcing bullish sentiment and indicating the likelihood of a continuation in the uptrend. Take note also that the RSI has climbed into bullish territory (above 50), suggesting a shift in momentum towards buyers’ control and further room for upside before reaching overbought conditions.
ENTRY PRICE : 5.80 - 6.10
FIRST TARGET : 7.00
SECOND TARGET : 8.00
SUPPORT : 5.11 (bottom of the Rising Window area)

Has Bitcoin entered the distribution phase yet?👋🏻 Hey everyone! Hope you’re doing great! Welcome to SatoshiFrame channel.
✨ Today we’re diving into the 4-Hour Bitcoin analysis. Stay tuned and follow along!
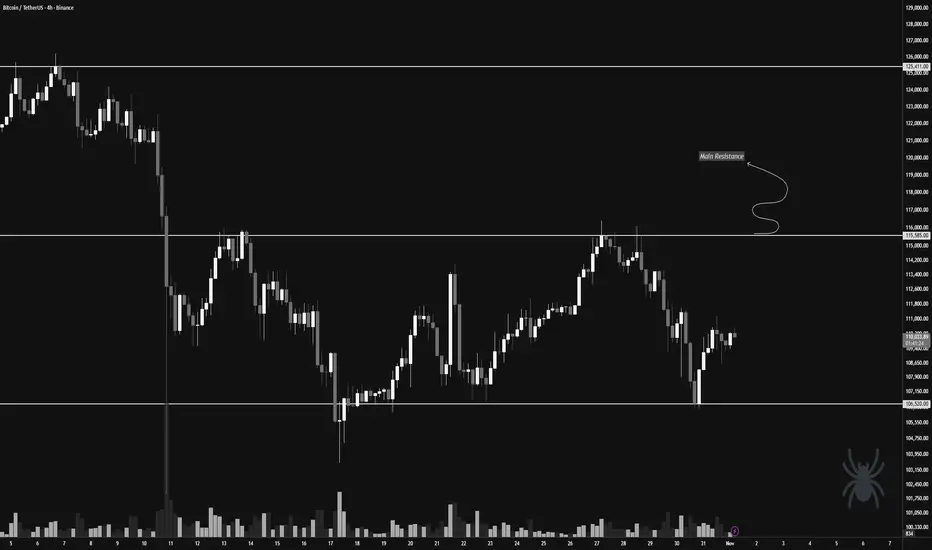
👀 On the 4-hour timeframe, we can see that Bitcoin recently dropped due to the impact of the FOMC news but then rebounded from the key support level at $106,520 and is now facing its multi-timeframe resistances. Looking at the chart more broadly, we notice equal highs and lows around the $115,585 and $106,520 zones. With a breakout of either of these levels, Bitcoin could experience a sharp and significant move.
🧲 Bitcoin’s selling volume has slightly increased, and if the supports break, this selling could turn into pressure — collectively applying downward force on the market price. Then, buyers may re-enter and start buying Bitcoin again. The hypothesis of a possible distribution phase could turn into a valid theory; however, we must be cautious — if Bitcoin decides to move upward after Monday’s session, it could confirm a new all-time high and continue its upward trend.
✍️ The main scenario for Bitcoin lies around the $115,585 price zone. If this level breaks, we could enter a long position and stay with it for a potentially extended upward move. It’s worth noting that an increase in buying volume along this path could serve as a strong confirmation for our long position.
On the other hand, the short position scenario would become valid if the price breaks below the support and selling pressure intensifies, giving us a high-momentum short setup.
❤️ Disclaimer : This analysis is purely based on my personal opinion and I only trade if the stated triggers are activated .
PRICE ACTION – The True Language of the MarketIn the noisy world of trading, filled with indicators, signals, and formulas, Price Action brings you back to the core: price. When you remove all indicators, erase moving averages, and forget RSI, the only thing left on your chart is the footprint of the market – the candles telling their story.
What is Price Action – and why is it the “true language”?
Price Action is not a “magic trick” or an infallible trading system. It is the art of listening to the market, the ability to read the rhythm of money flow and human emotions reflected in every price movement. Each candle is not just data – it is a story of hope and fear, of buyers and sellers, of greed and doubt. A Price Action trader does not predict the market – they observe how the market reacts.
Price – where emotions are written in candles
Price never moves randomly. Every high and low is the result of millions of human decisions.
When price breaks a high: it’s confidence and euphoria.
When price breaks a low: it’s fear and panic.
When price moves sideways: it’s waiting and doubt.
Price Action teaches you to read the emotions behind each click, not just the shape of the candle.
Market structure – the backbone of Price Action
Behind every trend lies a clear structure. The market cycles through three phases:
Accumulation – buyers and sellers struggle, price moves sideways.
Expansion – one side dominates, trend forms.
Distribution – winners take profits, losers retreat.
Understanding market structure means knowing where you are in the cycle, avoiding blind trades, and acting with purpose.
Every candle – a small story in the bigger picture
A long lower shadow signals strong buying pressure.
A pinbar at resistance shows price rejection.
A series of small candles indicates accumulation and an impending breakout.
A Price Action trader does not see candles individually but connects them into the full story – where every move has a reason.
The power of simplicity
Price Action is simple, yet far from simplistic. It is not lagging like indicators, not dependent on false signals, and can be applied across all markets – from Forex and gold to crypto. When you read price action, you are no longer passive, waiting for a signal; you become the navigator, following the market’s heartbeat.
The mindset of a professional Price Action trader
A professional Price Action trader doesn’t ask, “When should I enter?” Instead, they ask:
Who is controlling the market?
Where is the money flowing?
Has this price area reversed before?
Am I moving with the money or against it?
The difference lies not in technique, but in mindset and reaction. The market doesn’t need you to win. It rewards those who understand how it operates.
When you read price, you understand people
Price Action is not a tool; it is a living perspective on market psychology. It doesn’t promise perfection, but it gives you profound understanding. When you read price – you are reading human psychology. When you understand structure – you grasp the rhythm of emotional cycles. And when you immerse yourself in Price Action, you are no longer guessing prices – you move with the market, heartbeat by heartbeat, move by move, opportunity by opportunity.

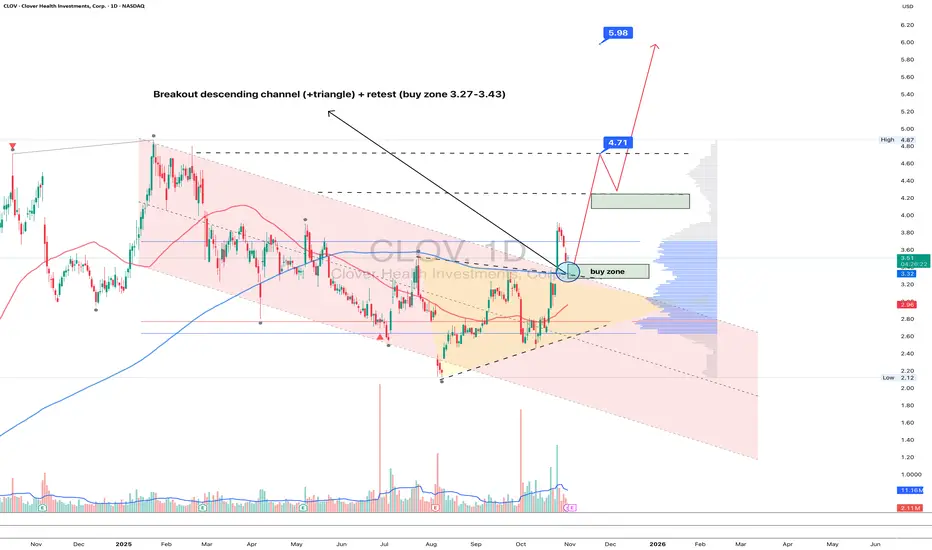
CLOV 1D - Health Is Back in TrendOn the daily chart, Clover Health (CLOV) has broken out of its descending channel and triangle, now pulling back for a retest near 3.27–3.43 - a key buy zone aligned with the MA50. Buyers are clearly regaining control, and the setup looks ready for continuation.
Technically:
– first clean breakout of the downtrend since January 2025;
– volume expansion on bullish candles, suggesting institutional accumulation;
– holding above the former resistance turned support.
Upside targets: $4.71 (local volume peak) and $5.98, offering +70% potential upside if momentum sustains.
From a fundamental perspective, Clover Health is stabilizing its business:
– a leading player in Medicare Advantage, with an expanding senior member base;
– Q3 results show 40% reduction in net loss and +18% YoY revenue growth;
– leveraging AI-driven healthcare analytics to improve efficiency and patient outcomes;
– with high short interest, a confirmed breakout above $4.70 could ignite a short squeeze.
Tactical plan: accumulation near 3.27–3.43, add above 4.70, targets 4.71 → 5.98. Sometimes the healthiest trend is the bullish one.
Did you Know ?!!!Did you really think that profiting from the current bull run (a comprehensive upward market) would be easy? Don't be naive. Do you think they will let you buy, hold, and sell at low levels without any struggle? If it were that simple, everyone would be rich. But the truth is: 90% of you will lose. Why? Because the crypto market is not designed for everyone to win. They will shake you. They will make you doubt everything. They will panic you and sell at the worst possible moment. Do you know what happens next? The best players in this game buy when there is fear, not sell; because your panic gives them cheap assets. This is how the game goes: strong hands feed off weak hands. They exaggerate every dip, every correction, every sale. They make it look like the end of the world so that you abandon everything, and when the market starts up again, you'll sit there saying, "What the heck just happened?" This is not an accident. It's a system. The market rewards patience and punishes weak emotions. The big players already know your thoughts. They know exactly when and how to stir fear to make you give up. Because when you panic, they profit. They don't play the market. They play you. That's why most people never succeed. Because they fall into the same traps over and over again. People don't realize that dips, FUD (fear, uncertainty, doubt), and panic are all part of the plan. But the winners? They digest the noise. They know that fear is temporary, but smart decisions last forever. We've seen this hundreds of times. They pump the market after you sell. They take your assets, hold them, and sell them to you at the top, leaving you with nothing, wondering how it happened. Don't play their game. Play your own.
REMEMBER

"ETH - Time to buy again!" (Update)The ETH will increase $2K and reach to the top of the wedge in the coming weeks .
Best regards CobraVanguard.💚

TRX's situation+ Target PredictionFinally, the price broke the wedge, and the price experienced a significant drop. I think is the time for TR to rise again to 0.73 after more correction . STRONG SUPPORT 0.26.
Previous analysis
Give me some energy !!
✨We spend hours finding potential opportunities and writing useful ideas, we would be happy if you support us.
Best regards CobraVanguard.💚
_ _ _ _ __ _ _ _ _ _ _ _ _ _ _ _ _ _ _ _ _ _ _ _ _ _ _ _ _ _ _ _
✅Thank you, and for more ideas, hit ❤️Like❤️ and 🌟Follow🌟!
⚠️Things can change...
The markets are always changing and even with all these signals, the market changes tend to

OPEN 1D - Flag Ready for Takeoff?On the daily chart, Opendoor Technologies (OPEN) is forming a clean bullish flag - a consolidation phase following a massive +400% rally since spring 2025. Price action remains tightly contained within the pattern, with strong support from the MA50 and the 6.3–7.4 buy zone, aligning with the 0.618 Fibonacci retracement.
Technically , the setup looks mature: MA50 is trending upward, MA200 sits far below, and volume contraction hints at a breakout ahead. The first target sits at $16.50 (1.618 extension), while the second target lies at $25.60 (2.618 extension) - a potential +200% move from current levels.
Fundamentally, Opendoor is finally emerging from its downturn:
– +37% YoY growth in property transactions;
– operating costs reduced by ~25%;
– positive operating cash flow for the first time in three years;
– partnerships with Zillow and Redfin driving stronger customer acquisition.
With the U.S. housing market showing signs of recovery and potential Fed rate cuts on the horizon, OPEN stands out as a high-upside play in the proptech sector.
Tactical plan: watch for accumulation near 6.3–7.4, add on breakout confirmation. Profit targets: 16.5 → 25.6.
After all, in both trading and real estate - it’s all about timing and location.
