ATHUSDT.P – Trap Zone Absorption → Reversal | High-Timeframe ValBITGET:ATHUSDT.P
🕐 Timeframe: 1H
📊 Strategy: Trap Zone Reversal | Absorption + Delta Flip + HTF Value Reclaim
⸻
📘 CONTEXT:
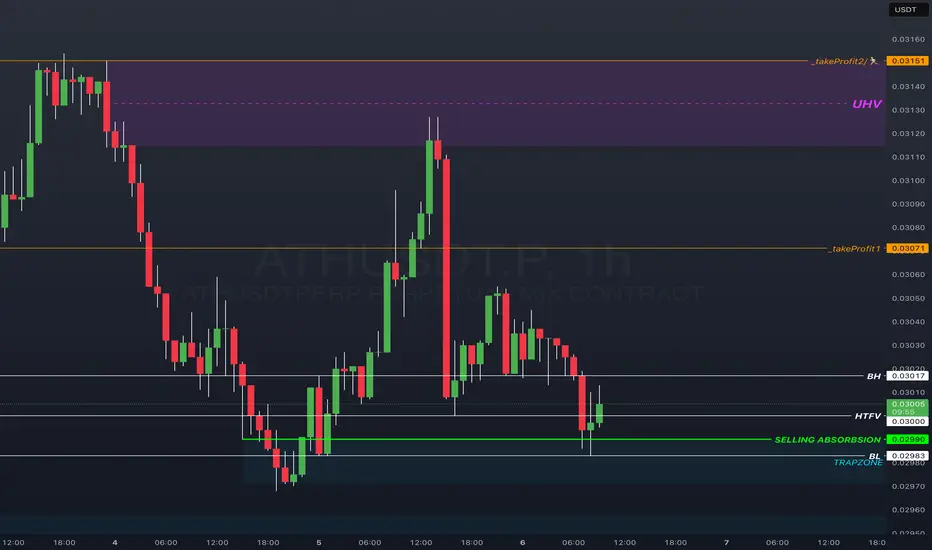
We’re observing a reversal setup on the 1H chart of ATHUSDT.P (BitGet Mix Perpetual).
Price has recently swept a key trap zone and shown aggressive selling absorption near the lows. We’re now seeing reversal momentum building as price reclaims structure.
This follows a period of:
• Failed sell climaxes at the trap zone
• Absorption of aggressive sellers
• Re-entry above higher timeframe value (HTFV)
These are classic markers of a shift from distribution (short bias) into accumulation (long bias).
⸻
🔍 STRUCTURE BREAKDOWN:
• 🔲 Contraction Box High (BH): 0.03017
• 📉 Higher Timeframe Value (HTFV): 0.03006
• 💚 Trap Zone Absorption Level: 0.02990
• 🔵 Trap Zone Low: 0.02983 (Suggested stop-loss zone)
The chart also marks:
• 📈 Sell climaxes that failed to follow through
• 📉 Buy climaxes that have now been absorbed
This suggests wholesale price acceptance has shifted to the upside.
⸻
🎯 TRADE PLAN:
• Entry Zone: Around 0.02990
• Stop Loss: Below 0.02983 (trap zone low)
• Target 1: 0.03071 ✅ (Remove ~33% at this level)
• Target 2: 0.03151 ✅ (Remove ~90%, leave runners)
• Risk/Reward: Designed for a +5% move
• Execution Type: Reversal entry off structural sweep + absorption
⸻
🧠 NOTES ON INDICATORS:
This chart is deliberately stripped of indicators to maintain focus on raw structure and price behavior.
The following zones are marked visually:
• HTFV = Higher Timeframe Value area (drawn manually)
• Trap Zone = Where previous aggressive sellers are now trapped
• Absorption = Inferred from prior failed lows and clustering behavior
• No footprint data shown, but reversal pressure is visible through price structure alone
⸻
✅ TRADE STATUS:
📈 Active – Position Open
Monitoring structure for expansion continuation and scale-out levels.