The trend is your friendHello everyone. I’m a financier and this is educational post that might help you get closer to consistent profitability (if you actually get the point).
Today I want to talk about trend trading. Yes - that very “best friend of a trader” that every book and every course keeps repeating. And after years in the market I can say: it’s not just a cliché - it really works.
I’ve been through plenty of strategies: classic TA, Elliott Waves, Smart Money Concepts, Williams’ trading chaos - you name it. I’ve traded with the trend, against it, and inside ranges.
Honestly, the results were average. My monthly win rate was about 30–40%. Not terrible, but I wanted fewer mistakes and more stability.
Eventually I set one hard rule for myself:
👉 I only trade in the direction of the trend.
And statistically, that mostly means trading the uptrend.
Here’s the logic. Any asset can drop around 99.99% - the downside is capped. But to the upside there is no limit. An asset can grow 2x, 5x, 10x and more. So statistically, longs are more favorable. I still take shorts when the market structure is bearish, but lately most assets are trending up.
So what’s the real advantage of trading with the trend?
The market has its own momentum. It’s simply easier to move with that flow than to fight it. I stopped trying to outsmart the market or predict every reversal. I don’t obsess over overbought/oversold signals. I just wait for my setup - the same repeatable scenario - and I trade it in the direction of the trend.
I’m a boring trader - and that’s exactly why I’m a profitable trader.
On social platforms my job is to share analysis and possible scenarios. But trading itself is different: the goal is not to predict, the goal is to execute. If the setup plays out - great. If not -no problem, I wait for the next one. I’m no longer a hostage to my own forecasts, which only kill objectivity.
Trend filters out a huge number of bad trades. It instantly removes about half of all random entries. After I really internalized that, my win rate improved, my psychology inside trades got much cleaner, less FOMO, less second-guessing. I stopped guessing - and started systematically executing.
So my takeaway for today:
👉 Trend really is your friend.
Try focusing only on trend trading and then tell me in the comments how it changed your results and mindset.
Trandanalysis

XAUUSD 15mWith the market now open, we can see that price has reached the upper boundary, and bearish candlestick patterns are starting to form.
At this point, we have two scenarios:
1-If the current resistance zone is broken with strong momentum, price may continue toward the higher resistance area and the upper breakeven level.
2-If a clear bearish reversal candlestick pattern appears, we can look for short positions.
Alternatively, if reversal patterns form directly at this upper level, we can prepare for sell setups from this zone and target the lower support area.
For now, we need to wait and see how price reacts.
Wishing you profitable trades.

BTC/USD Analysis Market is bullish and respecting the trendlineThe chart shows a Bullish Ascending Channel. Price is making higher-highs and higher-lows, indicating continuation of the uptrend.
---
🎯 Targets
TP1: 114,500 – 115,000
TP2: 117,000 – 117,500 (major resistance zone)
---
🛑 Stoploss
Near stoploss: 110,800 – 111,000 (below trendline)
Safe stoploss: 109,500
---
📌 Support & Resistance
Support: 111,000 – 111,200
Major Support: 109,800 – 110,000
Resistance: 114,500 – 115,000
Major Resistance: 117,000
---
✅ Post Caption for Clients
"📈 Bitcoin (BTC/USD) is moving inside a bullish ascending channel.
Strong support at 111,000 zone.
🎯 Targets: 114,500 – 117,000
🛑 Stoploss: 110,800
Market structure shows bullish continuation ahea

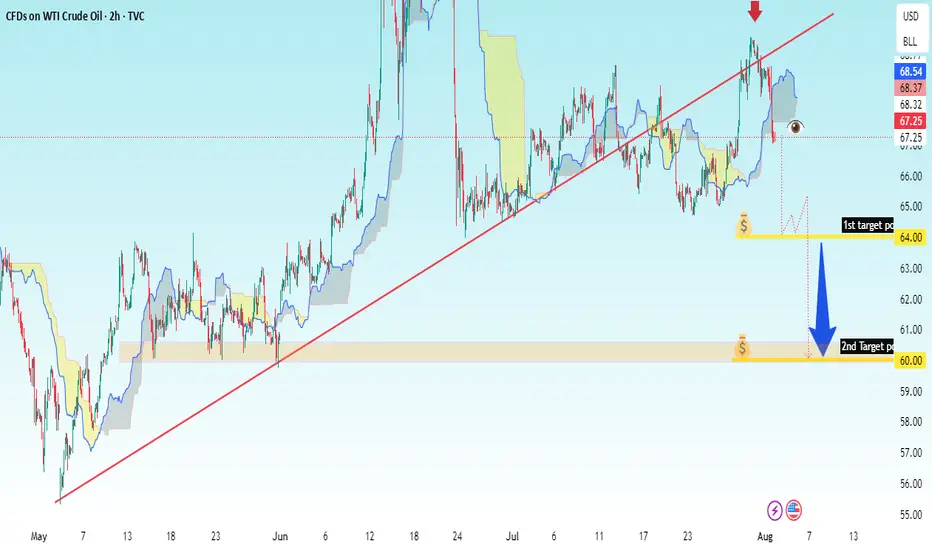
USOIL 2H – Trendline Break Sell Setup✅ Key Observations:
1. Chart Type: Candlestick chart (2h interval).
2. Trend Line: An uptrend line (red) is drawn, now broken to the downside.
3. Ichimoku Cloud: Price has broken below the Ichimoku cloud, signaling potential bearish momentum.
4. Red Arrow: Indicates a potential short entry point where price broke below the trendline.
5. Downside Targets:
1st Target Point: $64.00
2nd Target Point: $60.00
6. Bearish Projection: A large blue arrow pointing downward from the breakdown level implies a strong sell setup.
---
🎯 Your Trade Setup (based on chart):
Entry (Sell): Around $67.25–$67.50
Stop Loss: Above recent high or Ichimoku resistance, approx $68.70
Target 1: $64.00
Target 2: $60.00
Risk-Reward Ratio: Favorable, around 1:2.5 or better depending on entry
XAU/USD Buy Setup 1H Analysis Trendline breakout.Instrument: Gold Spot / USD
Timeframe: 1H (1 Hour)
Chart Tools Used:
Ichimoku Cloud
Trendline breakout
Target projection (highlighted in blue arrow and price levels)
Volume not shown directly but momentum is clear from breakout
---
💹 Buy Setup Analysis
✳ Current Price: $3,362.895
🔼 Entry (Buy): Around $3,363.590 (as marked on the chart)
🎯 Targets:
Target Number Price Level Approx Gain % Move
1st Target $3,393.481 ~$30 ~0.89%
2nd Target $3,433.864 ~$70 ~2.06%
🔻 Stop-Loss (Suggested): Below Ichimoku Cloud, ideally near $3,315.860 or $3,322.672
---
🧠 Strategy Logic
The chart shows a clean bullish breakout of the trendline and Ichimoku cloud.
Strong upward momentum candle confirms the breakout.
Targets are based on measured move and previous resistance zones.
Volume and sentiment look bullish, aligning with the breakout.
A pullback to the breakout zone (~$3,340–$3,350) would be healthy for re-entry.
---
📝 Summary of Buy Setup
Parameter Value
Entry $3,363.590
Target 1 $3,393.481
Target 2 $3,433.864
Stop-Loss $3,322.672–$3,315.860 (zone below cloud)
Risk-Reward ~2:1 to 3:1 based on SL/TP choice

USD/JPY 4H –analysis Buy setupUSD/JPY (U.S. Dollar / Japanese Yen)
Timeframe: 4-Hour (4H)
Trend: Bullish Trendline Support – Price is respecting a strong ascending trendline.
Indicators: Ichimoku Cloud is visible; current price is above the cloud = bullish bias.
Current Price: Around 147.95.
---
✅ Buy Entry:
Entry Zone: Between 147.90 – 148.10
(As price is bouncing from the trendline support and Ichimoku cloud.)
🎯 Buy Targets:
1. Target 1: 148.99 (Previous structure resistance)
2. Target 2: 150.50 (Next resistance level)
3. Target 3 (Swing): 152.00+ (If momentum continues)
🛑 Stop Loss:
Below trendline + Ichimoku support = 146.80 (safe zone)
---
🔖 Chart Title Suggestion:
"USD/JPY 4H – Trendline Rebound with Bullish Momentum Targeting 150+"

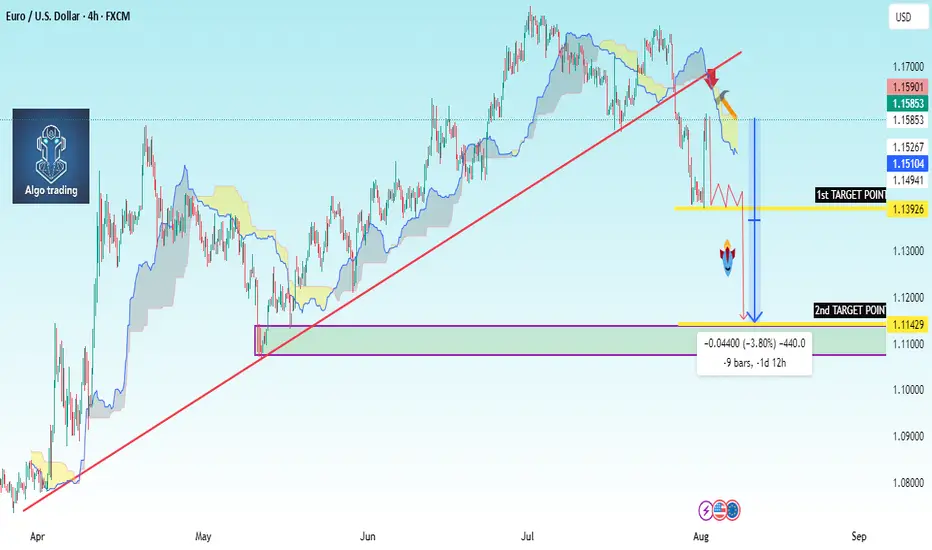
EUR/USD Chart Summary (Bearish Setup):Trendline Break: A long-term bullish trendline has been broken.
Price below Ichimoku Cloud: Indicates bearish momentum.
Bearish Retest: Price pulled back to retest the broken trendline and is now forming a bearish continuation pattern.
Double Target Zones Identified:
1st Target Point: ~1.1329
2nd Target Point: ~1.1144
---
🟠 Suggested Trade Setup:
🔹 Entry (Sell):
Around 1.1585 (where price is hovering now; or on a small pullback).
🔻 Take Profit (TP):
🎯 TP1: 1.1329 (short-term target)
🎯 TP2: 1.1144 (main target if bearish momentum continues)
🛑 Stop Loss (SL):
Place above the recent swing high or cloud resistance — around 1.1670
---
📊 Risk-Reward:
TP1 = ~250 pips
TP2 = ~440 pips
SL = ~85 pips
This gives you a favorable risk-reward (1:3+ to TP
#Bitcoin LTF update #Bitcoin LTF update
After making a high of $123,300, it dropped a bit and made short-term support at $117,000, and currently it is holding at this level.
But it is not strong enough to hold, we will retest the lower level.
IMO, we can see a retest up to $113,000 level approximately.
Where we have 0.382 golden fibre level, which is also aligning with some more important indicators, and most importantly, we have good numbers of liquidation at that level.
If you find my updates helpful, don’t forget to like and follow for more!
DYOR, NFA

Altseason Isn’t Over – It’s Just Getting Started !!It’s not the end of #Altcoins this is just a small dip before the big move. 🚀
Right now, all EMAs (50, 100, 200) are sitting at the same level. This is acting as very strong support around the $1.12T zone.
Price has bounced from this area before, and if it holds again, we could see a big breakout toward $1.28T+.
Altseason isn’t over. It’s loading.
Be ready. 👀
#TOTAL2 #Altseason2025

EUR/USD Breaks Resistance – Bullish Momentum or Pullback Ahead?what are your ideas on EURUSD?
The EURO/USD pair breaks a resistance level after touching the bottom of the ascending channel,increasing the probability of a new bullish wave.
AS THE RESISTANCE IS BROKEN NOW THE NEXT target will be the top of the channel .
Here we have two points to watch on
A bullish continuation is likely if price holds above the resistance.
A rejection from the 200 EMA could lead to consolidation or a pullback before another attempt higher.
what do you think will EUR/USD sustain the support and be on bullish movement ?

BTC/USD trend upward soon Bitcoin (BTC/USD) in an upward channel, with the price currently at 96,904.63. Key levels to watch:
- Support Zone: The strong support is around 91,334.05, where a potential buy opportunity could emerge.
- Retest Area: The price may also retest the 100,941.20 level before pushing higher.
If the price holds above the support, Bitcoin could rise back towards the 107,669.49 resistance.

EUR/SGD LongInto higher timeframe support.
The take profit is the moving average so will come slightly lower over time.

Hellena | EUR/USD (4H): LONG to the resistance area of 1.05862.Dear Colleagues, after the last upward movement it became clear that the wave “5” of the senior order is already completed and it means that we should expect the continuation of the correction “abc”.
At the moment I expect a corrective movement in wave “b” to the 50% Fibonacci area (1.03180), then an upward movement to the resistance area of 1.05862.
It is possible that the price will continue the upward movement, renewing the wave “a”.
Manage your capital correctly and competently! Only enter trades based on reliable patterns!

GOLD TECHNIAL UPDATE >GO :? AND READ THE : CAPTAINBuddy's dear friend 👋
Gold trading signals technical analysis setup I think 🧐 Gold ready for Down trand 😜 4 H Time Frame 🖼️ looks good Short Trade first Zone buddys 2774 Next Short Trade 2700
Why wait should be good choice for short Trade 😄. Technical analysis setup now stall Sell trend 📈. Follow risk management
Technical analysis setup look for short trade entry 2673 target 🎯 2540 OANDA:XAUUSD
Technical analysis setup look for short trade entry 2704 target 🎯 25 80 2540
🎮
S upport 🌟 My hard analysis Setup like And Following Me 🤝 that star ✨ game

BTCUSD TECHNICAL UPDATE : GO AND READ THE :CAPTAINBuddyS dear friend 👋
Crypto Traders. Are you still wanting for buying zone right now 🙏🤔 BTC USD All time high 94k buying zone right now
92K Big support level 🎚️. Easy to recover 💪 back up trand 97k
Technical analysis setup look for first buying zone 94k Next buying zone support level 92k
Buying said 94k target 97k after 25 hours Hit 🎯
Next buying said 92k target 97k
After two 48 hours
Support ✨ My hard analysis Setup like And Following Me 🤝 that star ✨ game 🎮 BITSTAMP:BTCUSD

Filling the gap and returning to the main path.After the rapid movement of the price from 2708 and going down and breaking the level of 2605, the price made a correction in the direction of filling the gap of the market towards the level of 2653 by reaching the range of 2545 and it is expected that after the gap is filled and the distance between the market and the collision With the trend line and reaching the range of 2676-2655, the expectation is to return to its downward path.

RDNT/USDT Trading ScenarioAs a result of the cyberattack on Radiant Capital's protocol in October, their token RDNT lost value significantly, hitting an all-time low of $0.0375. According to the volume profile, many participants are actively accumulating the token at discounted prices, and the current decline is not deterring buyers. The protocol developers are also working on eliminating the consequences of the attack and strengthening security.
In the long term, the price is expected to recover and RDNT is to continue to grow during the altcoin season. Such situations with fundamental protocols often provide an opportunity for high returns over the medium to long term.

GOLD M30 Analysis 100%Hello traders,
GOLD is expected to experience a very minor correction, presenting a buying opportunity.
NO BEARISH OPPORTUNITY!
Selling Is Risky!
Bullish Opportunities:
We are anticipating a possible scenarios for gold prices;
Gold may experience a minor downturn to the $2578-$2572 range, where we will seek confirmation and consider entering a long position.
if you want to support me then consider liking or following!

GOOGLE looking strong ! we identified a important area. Google needs to break the bearish sequence channel.
We have discovered several inflection points that create a very important zone, which is fully respected. When the price falls into this zone, it simply bounces because historically, these inflection points (green circles) have shown a liquidity and trend action.
If you can see on the 3rd circle, there is a high-volume candle that, upon rejecting the downtrend, creates a zone that could become a support zone if the price were to fall, and that’s exactly what happened in our 4th circle.
GOOGL is undoubtedly showing a lot of strength; however, this coming week, Google needs to show the same strength it has demonstrated over the last two days. In other words, we need enough volume for the price to break the sequential channel and see Google back above 168 or more.
We will see how it goes this week.
Thank you for supporting my analysis.
Best regards.

Gold Trade : Bullish Momentum AheadXAUUSD has been making bullish trend through 2041 making higher highs and higher lows and is holding towards the liquidity zone 2458 2460.Price action and market structure also shows bullish trend and also a double bottom pattern is evident around the 2380 2385 level indicating a strong support area. there is also a news which would support us in bullish momentum
Our technical analysis and market indicators suggest a positive trend for gold in the next trading session. Investor can expect a potentially lucrative opportunity to capitalize on the bullish momentum.


STMX Short Plan.STMX Short idea if not flip the zone on 1D.
Always manage your risk. the market is up side but if you have any chance short to manage your risk then go for Banana.

GBPJPY 30Price made a choch. and is currently pulling back to the supply zone. I anticipate a trend continuation after tapping into the supply zone.
