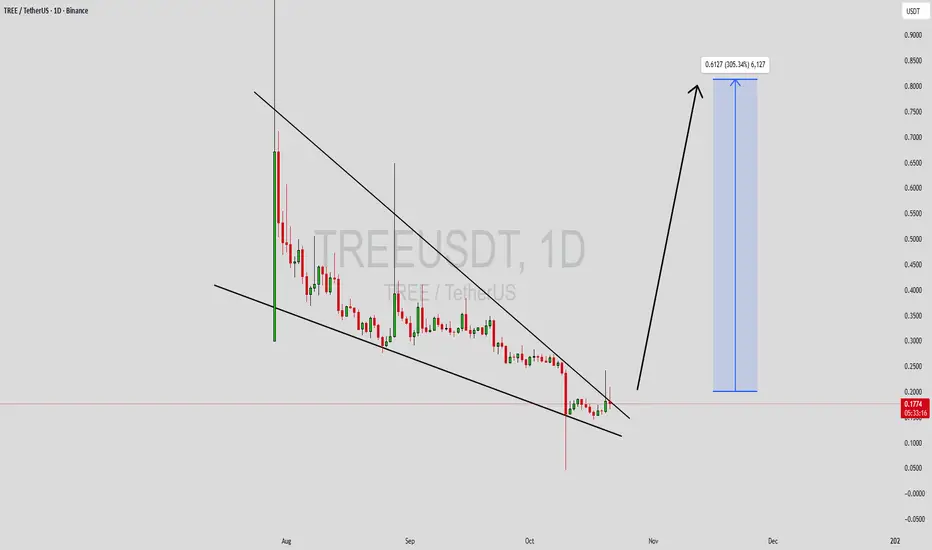
TREEUSDT Forming Falling WedgeTREEUSDT is currently forming a falling wedge pattern, which is often recognized as a strong bullish reversal signal in technical analysis. This pattern usually occurs after a prolonged downtrend, signaling that selling pressure is weakening and a potential breakout is on the horizon. The good trading volume adds confirmation to this setup, suggesting that accumulation is taking place as investors start positioning themselves ahead of a possible bullish move.
The structure of the falling wedge indicates that TREEUSDT could be nearing a breakout point, where a surge in price momentum might trigger a significant upside rally. With an expected gain of around 290% to 300%+, the potential reward for early entries is quite promising. Historical performance of similar wedge breakouts in the crypto market has shown that once resistance levels are broken, price action often accelerates sharply, attracting more traders and momentum investors.
Investor sentiment around TREEUSDT is visibly improving, with increasing discussions and renewed confidence in the project’s fundamentals. As more participants enter the market, the growing interest may fuel additional buying pressure, helping sustain the breakout and extend the bullish wave further. If this pattern confirms, TREEUSDT could become one of the top-performing altcoins in the short to medium term.
✅ Show your support by hitting the like button and
✅ Leaving a comment below! (What is You opinion about this Coin)
Your feedback and engagement keep me inspired to share more insightful market analysis with you!
TREE
TREEUSDT Forming Potential BullishTREEUSDT is currently displaying a strong technical setup that suggests a potential bullish breakout. After a long consolidation phase, the chart is shaping into a clear wedge structure, supported by steady volume. Such patterns often act as continuation signals, and with the current market sentiment, TREEUSDT may soon experience an impulsive move to the upside.
The expectation of a 70% to 80%+ gain aligns with the breakout target zones highlighted in the recent price action. Buyers appear to be regaining control, and the momentum shift can be seen in the way higher lows are forming consistently. If the price holds above its current support, the bullish case becomes even stronger with the possibility of rapid growth once resistance levels are cleared.
Investors are beginning to show strong interest in this project, which is an important factor in sustaining any breakout rally. As liquidity flows in, TREEUSDT has the potential to become one of the more attractive short- to mid-term trading opportunities. Monitoring volume spikes and candle closes near key levels will be crucial in confirming this bullish trend.
✅ Show your support by hitting the like button and
✅ Leaving a comment below! (What is You opinion about this Coin)
Your feedback and engagement keep me inspired to share more insightful market analysis with you!

TREEUSDT UPDATE#TREE
UPDATE
TREE Technical Setup
Pattern: Bullish Falling Wedge Pattern
Current Price: $0.328
Target Price: $0.505
Target % Gain: 53.23%
NASDAQ:TREE is breaking out of a falling wedge on the 4H timeframe. Current price sits at $0.328 with a projected move toward $0.505, giving over 53% potential upside. The breakout shows bullish momentum with continuation likely if support holds. Always use proper risk management.
Time Frame: 4H
Risk Management Tip: Always use proper risk management.

TREE Stock Long Position Confirmed Monday 8/4/25Hello,
Ayrfolio trade ideas are based on weekly charts and momentum, so remember to be patient! No day trades here unless the stock soars up intraday! Today we’re covering:
STOCK SYMBOL: TREE
POSITION: Long
TP1 Risk-Reward Ratio: 1.39
TP2 Risk-Reward Ratio: 2.79
Stop Loss: must wait AFTER daily candle closes to exit trade (regular candle, NOT Heiken Ashi)
Ultimate Stop Loss: can exit IMMEDIATELY if price reaches this level during any trading hours
EXPLANATION: Weekly momentum increased and confirmed on Monday 8/4/25 at $54.17/share. Although the stop losses are listed on the chart, if momentum has been lost then we can exit before the price reaches the stop loss.
DISCLAIMER: Please do your own due diligence before making any decisions.
P.S. - Stocks can soar. YOU can soar. Soaring is possible!
-Ayrfolio

TREE COIN PRICE ANALYSIS AND NEXT POSSIBLE TRADE IDEAS !!NASDAQ:TREE Coin 🎣.
• Add it in Your Favorite Coins List.
• If Price Manage To Hold it's bottom and consolidate in a range for few days then potential bounce back expected🫡
• But without SL Trade is not Recommended ( It's a low cap coin) 🚨🚨
• Let's see how Price react in comming days.
Warning : That's just my analysis DYOR Before Taking any action🚨🚨

UPDATE SAPPI Target reached at R56.60 - Omwards and UpwardsSAPPI has performed great since it broke above the Symmetrical Triangle,.
The analysis was done in February, it broke above the Apex and since then has rushed to its first target at R56.60.
No ways, is this worth a punt to the short side. We can now expect some sideways chop, possible pattern form and then will provide another buy signal.
What is the opposite of Timber!!!! ?

LOEWS, ARE WE ABOUT TO SEE A LIMBO WORLD RECORD? (EARNINGS)And do you want to buy the dip
These trends are not looking good.
if earnings can't get over 74 and maintain good momentum, it's going to get pushed down to the support trends. Which are quite strong overall.
The downside is huge.
But it's not like there isn't upside.
I'm just not certain the upside to 80 will occur sooner rather than later.
Personally, I see a bearish looking stock, but I'm also not as confident as I sometimes am because there is a possibility it holds support at 69 and really starts to move.
However, I'm fairly certain we'll see $20 at some point within the next year or two. IMO, sooner.
Attaching CAT and APD

LendingTree Buys Back $100 Mln Of Outstanding 0.50% Senior NotesOnline financial platform, LendingTree, Inc. (TREE), Wednesday announced that it has repurchased 0.50% convertible senior notes worth approx. $100 million, which were issued in July 2020 and will be due in 2025.
The company has spent approx. $81.4 million in cash for this transaction. On Tuesday, LendingTree's stock closed at $19.62, down by 0.66%.
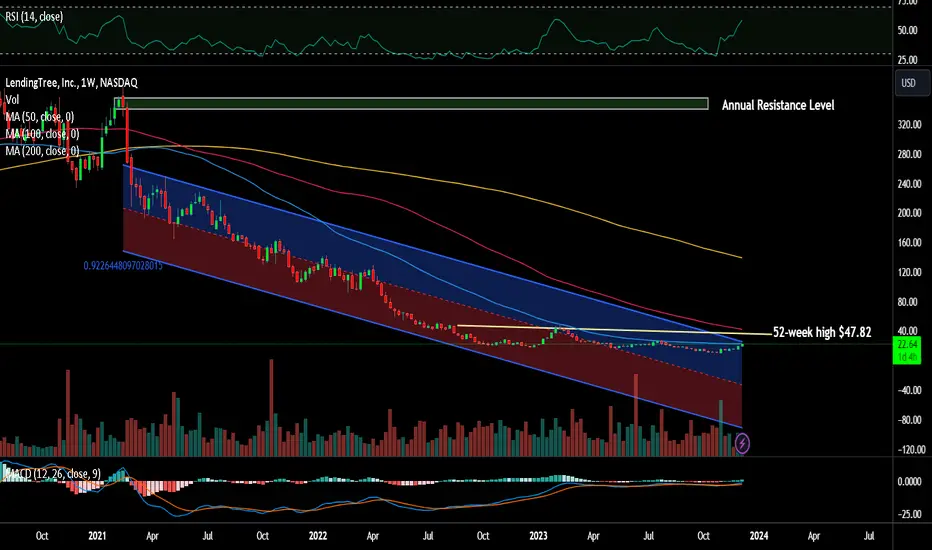
The company’s stock price has been in a bearish trend since reaching a 52-week high of $47.82 on January 28, 2023. The stock has been trading below its 50-day and 200-day moving averages, indicating a lack of momentum and support. The stock also faces strong resistance at $21.35, which is the 38.2% Fibonacci retracement level of the downtrend from January to November 2023.
However, the stock still faces significant challenges in the mid to long term, such as the declines in home revenue, the economic risks from the pandemic, and the competition from other online lending platforms . Therefore, the stock may not reach for the stars anytime soon.
$SPY Monday Day Trade IdeasOn the left I have a 15m chart and right, 4h chart. Being as though Mondays have usually been rough for the markets and we have Consumer Inflation Expectations for December being announced at 11 AM EST, I'm thinking the markets opening green could be a setup to force some downside momentum. I believe if we can hold under this $389 area that we can retest around $386.50. If we base out around $389, the next leg up is to $391.50.
Also, on the 4h chart the 50 and 200 SMA are both acting as resistance on Friday's closing candle. Because there are two moving averages in the spot, it's something I can't ignore from a bearish perspective. Otherwise, there seems to be a potential gap fill setup back towards the $399-$400 area.

TREE - Strong support at this level.Strong support at this level. I bought $40,000. Lets see if we can bounce from here.

TREEonce it breaks over the $400 level, it can start to run, even before the price target get increased.
ofc my 5-year hypothesis takes a long time, and a BIG BIG BIG return, but at least the risky is "only" 14%, considering the break of the channel in green.
at this price ($225) it is undervalued considering the price target on yahoo of $350+
trade safe, and invest only what you can lose.


My 5 / 30 EMA alert signal got triggered for $TREESo I initially set a 5 / 30 EMA crossover (up) signal alert for $TREE (Lending Tree) as it is one of the cyclical stocks where market has been rotating into.
It got triggered last night (or morning in Eastern time) and I immediately went in and bought a couple of LEAP based option calls for it. At this point in the day, $TREE was just about 290 only.
Little did I realize much later in mid-day that my profit on my option call ballooned to $3000 when $TREE jumped to $317.
LOL.


Will History Repeat itself ? BITCOIN Christmas Tree Pattern!Merry Christmas Everyone! and hope 2021 will be the best of luck!
I want to thank each and every one of you for supporting me this year, and I promise to keep pushing forward...
If you like the idea, do not forget to support with a like and follow.
This Christmas pattern is just for fun but at the same time may be relevant to the current situation.
Will history repeat itself this Christmas. Let's see how it goes!
As per my last Bitcoin video analysis, I mentioned that price is approaching a strong round number 25k so we will be looking for sell setups. but that doesn't mean that we should sell now, we will be looking for sell setups on lower timeframes, with extra confirmation and trigger. (or whatever suits your trading plan)
Good luck everyone and thank you once again.
Have a blessed season!

TREE LONG PLAY We Might have hit bottomTREE. Huge gap down back in mid November when GCI Liberty Sold 3 million plus shares. It just entered a channel where we will see some consolidation. Im looking at bottom to be $223-$225 range. Great long play.

LendingTree: Bullish Technicals and Fundamentals ExplainedIn this analysis, I'll be providing an in-depth analysis on LendingTree, as well as an explanation on megaphone patterns and its bullish upside.
What is LendingTree Inc.?
Lendingtree (TREE) is a company that offers a platform for borrowers and multiple lenders, offering the opportunity for its users to find the best possible deal on their loans.
Business Model
- Users of TREE gain access to multiple loan offers, and TREE’s clients gain the benefit of a cost-efficient customer acquisition.
- Essentially, LendingTree is a platform where people shop for money.
- Lendingtree works with major banks such as Citibank, Wells Fargo, as well as mortgage brokers, p2p specialty finance institutions, and small businesses.
- Their clients’ pain point is that borrower acquisition is a key constraint to growth.
- They offer a personalized platform called My LendingTree in which users can track their financial credit and performance
- Their cumulative user growth has been increasing at an exponential rate
- One fact many people misunderstand is that LendingTree does not take a markup fee.
- Their revenue comes from the payments made by lenders (their institutional clients), who pay to join the LendingTree marketplace.
- TREE also gets paid by their clients when its users sign up for their loans or services.
- While mortgage loans are their main focus, they are expanding into areas of: personal loans, auto loans, business loans, student loans, credit cards, saving accounts, and home equity loans.
Financials
- LendingTree’s revenue has tripled to $1.1 Billion by the end of 2019, almost triple the revenue of 2016.
- They continue to demonstrate tremendous growth as consumers shop for mortgages over time
- While their revenue was dominantly mortgage based, they have managed to diversify into generating revenue from non-mortgage related loans and services.
- However, their operating expenses have also significantly increased due to huge marketing budgets, and their operating income is not as exponential as their revenue growth
- Their quarterly revenue changes have been showing inconsistencies, and reported negative earnings for 2020 Q2.
- However, the company demonstrates steady and strong free cash flow
Technical Analysis
- We can take a look at TREE’s weekly chart for long term insight
- To begin with, the chart is currently trading within a textbook megaphone pattern
- A megaphone pattern can be a continuation or reversal pattern depending on how prices react near the resistance
- This pattern demonstrates 5 distinct swings, each getting larger than the previous one,
- As demonstrated above, we are currently in the middle of the fifth swing
- We can see that a reverse head and shoulders pattern has been forming since the third swing.
- We have temporarily broken out of the descending trend line resistance (marked by the dotted blue line), and forming what seems to be the right shoulder
- The formation of the right shoulder can also be seen as a bullish flag pattern, where prices are consolidating before a breakout
- On the short term, we are consolidating below the 0.618 Fibonacci retracement resistance.
- We have tested the pivot line support, as prices look to break out
- Even if we see a rejection at the trend line resistance on the fifth swing, there is a 60% upside potential based on the megaphone pattern structure
Conclusion
With the Fed having said that interest rates will remain at near zero, and considering the fact that the US housing market is still in an uptrend, given that we see more recovery in the economy, we could anticipate huge growth for LendingTree as more users seek to get loans. The technicals demonstrated on LendingTree’s chart are also extremely bullish, making this stock a solid mid-term investment.
If you like this analysis, please make sure to like the post, and follow for more quality content!
I would also appreciate it if you could leave a comment below with some original insight.

BTC -The origin of Bitcoin is like planting a tree. I admit, I couldn't stop thinking about Bitcoin the whole time I met him.
It's not technology. It's a whole fucking organism.
The origin of Bitcoin is like planting a tree.
Not only the choice of plant species (code) but also the season (launch time), soil (distribution) and horticulture (community) were important for its success Satoshi.
He had to grow to be strong, powerful and huge.
It had to survive drought, storms and parasites.
Its deep roots had to support the weight of the new world reserve currency, the benchmark of value.


Perfect Symmetrical 3 Drives to TOPPerfect Symmetrical 3 Drives to TOP
It can mean only one thing:)
I've posted a similar situation chart that was a surgical strike :) as I always do.


My favorite - 3 Dives Top With Massive Rejection on last TOP3 Dives TOP with Massive Rejection on Last TOP is my favorite.
Also the massive rejection result the fact that weekly 24 MA is holding like a BOSS without sweating it.
Enjoy the shorts my friends.

3 Dives Top? No ? Who know's in crypto everything is possible :)BITMEX:XBT is being a feisty little bastards trying to take-out the majority of its shorters on its way down.
You know the old school Wash & Rinse? You can watch it now, fake volume pushed too the limits of no volume , everything deflating like a bubble all over again. Sooner hopefully then later as then it will caught many "Buyers" that we will need when we hit the REAL Bottom.
