Our opinion on the current state of SAPPI(SAP)Sappi (SAP) is an international manufacturer specializing in paper, dissolving wood pulp (DWP), and paper pulp. The company supplies products to over 150 countries. DWP, a primary component used for clothing and packaging products, is crucial to Sappi's future profitability, although its price fluct
Next report date
—
Report period
—
EPS estimate
—
Revenue estimate
—
−3ZAR
4.71 BZAR
105.62 BZAR
594.49 M
About SAPPI LTD
Sector
Industry
CEO
Stephen Robert Binnie
Website
Headquarters
Johannesburg
Employees (FY)
12.33 K
Founded
1936
ISIN
ZAE000006284
FIGI
BBG000BV0784
Sappi Ltd. is a holding company, which engages in the provision of paper-based solutions. Its products include dissolving pulp, graphic papers, packaging and speciality papers, casting and release papers, and biomaterials. It operates through the following geographical segments: North America, Europe, and South Africa. The company was founded on December 17, 1936 and is headquartered in Johannesburg, South Africa.
UPDATE SAPPI Target reached at R56.60 - Omwards and UpwardsSAPPI has performed great since it broke above the Symmetrical Triangle,.
The analysis was done in February, it broke above the Apex and since then has rushed to its first target at R56.60.
No ways, is this worth a punt to the short side. We can now expect some sideways chop, possible pattern fo

$JSESAP - Sappi: Now I'm Convinced In The BreakoutSee link below for previous analysis.
I am now convinced in the breakout due to
1-Increase in volume after breakout.
2-Clear price continuation above the resistance trendline.
Buy the dips.

SAPPI - Broken its downtrendSappi has traded strongly recently and has now managed to break the yellow downward trend line. . As such, we could possibly see a retest of the yellow band before moving higher or, price could continue moving upwards in this relatively strong move. Initial target on this move would be around 58.18

$JSESAP - Sappi: Not Yet Convinced It's A BreakoutSee link below for previous analysis
The stock has made a minor breakout from the upper resistance trendline and is currently using it as support.
I am not convinced by this breakout due to:
1-Low volume breakout
2-Weak price momentum after breakout
It's still early days but I will sit on my han

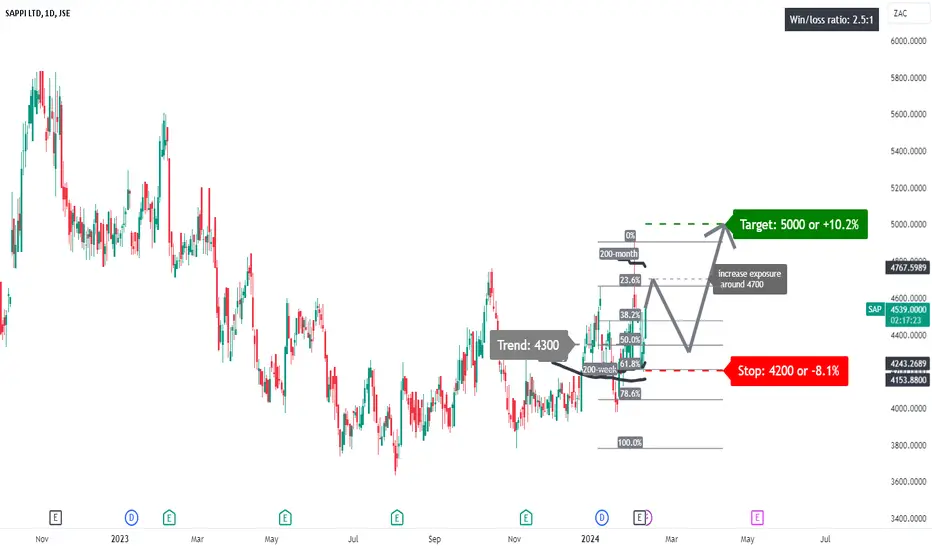
SAP: further gains after a correction?A price action above 4300 supports a bullish trend direction.
Further bullish confirmation for a break above 4700.
The target price is set at 5000.
The stop-loss price is set at 4200.
Remains above the confluence of 200-day and 200-week simple moving averages, supporting a bullish long-term trend.
Our opinion on the current state of SAPSappi (SAP) is a global leader in the manufacturing of paper, dissolving wood pulp (DWP), and paper pulp, supplying products to over 150 countries. DWP, crucial for manufacturing clothing, packaging products, and various other applications, was identified as a future profit generator for Sappi. Howe

SAPPI looking shap! Target potential to R56.76Symmetrical Triangle seems to have formed on Sappi.
Now on the contrary of a Symmetrical Triangle being a Continuation pattern, it is possible for a reversal to take place in this instance.
We have the converging of the trendlines where the price has reached an apex. Strong buy divergences and p

Our opinion on the current state of SAPSappi (SAP) manufactures paper, dissolving wood pulp (DWP) and paper pulp internationally and supplies products in 150 countries. DWP is used to manufacture clothing, packaging products and many other applications. DWP, specialty and packaging products were seen as the profit generator in the future

$JSESAP - Sappi Ltd: Forming A Wedge PatternSee link below for previous analysis.
Sappi has found the going tough since peaking at 6348, shedding over 40% of its value.
This bear trend looks to be forming a falling wedge pattern.
Price is still contained within this pattern so I will sit on my hands until we get a clear breakout, hopefully o

See all ideas
An aggregate view of professional's ratings.
Frequently Asked Questions
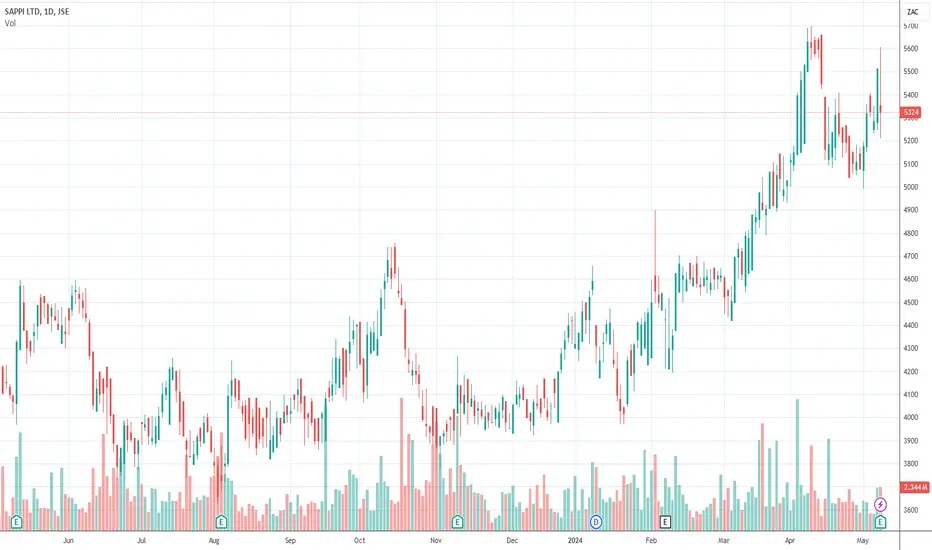
The current price of SAP is 5,491 ZAC — it has increased by 0.35% in the past 24 hours. Watch SAPPI LTD stock price performance more closely on the chart.
Depending on the exchange, the stock ticker may vary. For instance, on JSE exchange SAPPI LTD stocks are traded under the ticker SAP.
SAP stock has risen by 7.41% compared to the previous week, the month change is a 14.75% rise, over the last year SAPPI LTD has showed a 41.16% increase.
We've gathered analysts' opinions on SAPPI LTD future price: according to them, SAP price has a max estimate of 7,950.21 ZAC and a min estimate of 3,364.22 ZAC. Watch SAP chart and read a more detailed SAPPI LTD stock forecast: see what analysts think of SAPPI LTD and suggest that you do with its stocks.
SAP stock is 1.54% volatile and has beta coefficient of 0.85. Track SAPPI LTD stock price on the chart and check out the list of the most volatile stocks — is SAPPI LTD there?
Today SAPPI LTD has the market capitalization of 32.74 B, it has increased by 5.56% over the last week.
Yes, you can track SAPPI LTD financials in yearly and quarterly reports right on TradingView.
SAPPI LTD is going to release the next earnings report on Aug 8, 2024. Keep track of upcoming events with our Earnings Calendar.
SAP earnings for the last quarter are 0.95 ZAC per share, whereas the estimation was 1.73 ZAC resulting in a −45.05% surprise. The estimated earnings for the next quarter are 1.36 ZAC per share. See more details about SAPPI LTD earnings.
SAPPI LTD revenue for the last quarter amounts to 25.75 B ZAC, despite the estimated figure of 25.47 B ZAC. In the next quarter, revenue is expected to reach 24.54 B ZAC.
SAP net income for the last quarter is 547.83 M ZAR, while the quarter before that showed −2.36 B ZAR of net income which accounts for 123.19% change. Track more SAPPI LTD financial stats to get the full picture.
Yes, SAP dividends are paid annually. The last dividend per share was 2.77 ZAR. As of today, Dividend Yield (TTM)% is 5.07%. Tracking SAPPI LTD dividends might help you take more informed decisions.
SAPPI LTD dividend yield was 6.30% in 2023, and payout ratio reached 33.20%. The year before the numbers were 6.07% and 17.74% correspondingly. See high-dividend stocks and find more opportunities for your portfolio.
As of Jul 27, 2024, the company has 12.33 K employees. See our rating of the largest employees — is SAPPI LTD on this list?
EBITDA measures a company's operating performance, its growth signifies an improvement in the efficiency of a company. SAPPI LTD EBITDA is 15.38 B ZAR, and current EBITDA margin is 15.27%. See more stats in SAPPI LTD financial statements.
Like other stocks, SAP shares are traded on stock exchanges, e.g. Nasdaq, Nyse, Euronext, and the easiest way to buy them is through an online stock broker. To do this, you need to open an account and follow a broker's procedures, then start trading. You can trade SAPPI LTD stock right from TradingView charts — choose your broker and connect to your account.
Investing in stocks requires a comprehensive research: you should carefully study all the available data, e.g. company's financials, related news, and its technical analysis. So SAPPI LTD technincal analysis shows the buy rating today, and its 1 week rating is buy. Since market conditions are prone to changes, it's worth looking a bit further into the future — according to the 1 month rating SAPPI LTD stock shows the buy signal. See more of SAPPI LTD technicals for a more comprehensive analysis.
If you're still not sure, try looking for inspiration in our curated watchlists.
If you're still not sure, try looking for inspiration in our curated watchlists.