Bottom In Ready for Take off 138K Before we start the Chicken Little dance, given that bearish emotions are high, let’s take a quick, objective trip down memory lane first.
1) In our late-November update, we explained, based on the Elliott Wave (EW) Principle, why we were still long-term Bullish on Bitcoin (BTC), noting that “… comprehensive, multifaceted analyses of the yearly, monthly, and daily charts indicate the potential for further decline to around $65000 ± $ 2000 first before moving higher.”
2) We have kept that posture, as in early December, we found that “at this stage, as in 2015 and as discussed previously, we can’t rule out a lower low near the upper end of long-term support ($60~63 K) this year before Bitcoin really takes off.”
Trend Analysis

BTC bear markets are 18-24 months typicallyExpecting to bottom around 30k but the breakdown of the MOAT (Mother Of All Trendlines) is critically a breakage from previous cycles support.

ETHEREUM (ETHUSD) — Weekly Structural Map | 08 Feb 2026Ethereum remains within a higher-degree corrective regime following a completed multi-year advance. Price continues to rotate inside a broad balance zone, with no confirmed impulsive continuation yet.
Cycle continuation requires sustained acceptance above the upper structural zone, while loss of lower support would imply further corrective time expansion rather than trend failure.
Structure is mature; resolution requires confirmation, not anticipation.
Disclaimer:
For educational purposes only. Not financial advice.
#ETHUSD #Ethereum #MarketStructure #ElliottWave #CryptoAnalysis #TechnicalAnalysis #LongTermView #AtlasStyle

Willis Towers Watson (WTW) — Daily Bull Trap
Late-stage uptrend + compression = high bull-trap risk
Primary bias:
Distribution → pullback likely
Entry (Option A – Aggressive):
Short on rejection between 338–345
Look for upper-wick rejection or daily close back inside wedge
Entry (Option B – Conservative):
Short on daily close below 318
Confirms structure breakdown and trap activation
Stop Loss:
Above 350 daily close
This invalidates the trap and signals trend continuation
Targets:
TP1: 300–295
TP2: 275–280
TP3 (stretch): 245–250
Bull continuation (only if): >>> highly unlikely.
Strong daily close above 350
Volume expansion + EMA re-separation.
Then this becomes a false trap and trend resumes
Not financial advice. For educational purposes only.

GOLD: Bulls Are Back In TownPrice swept sell-side liquidity into the 4700 area and formed a strong LL. After that price formed a clean bullish CHoCH, and is now holding above key demand. Structure has now shifted to HHs and HLs. This tells me the market is no longer bearish and is gearing up for a continuation.
I’m waiting for price to pull back into demand, show confirmation on lower timeframes, and then I will look for buys targeting buy-side liquidity above the highs.
If price doesn’t pull back, the alternative is a breakout continuation — but only with clean displacement and acceptance above the level.
🔑 Key Zones
• H1 Demand / Discount Zone: 4850–4865
• Intraday Demand: 4930–4950
❌ Invalidation (structure break): Below 4800
🟢 Intraday BUY (ONLY ON PULLBACK)
Entry: 4930 – 4950
Stop: 4905
TP1: 4990
TP2: 5030
TP3: 5080
🟢 Alternative — Breakout Continuation (Only if no pullback happens)
Conditions:
• M15 close above 4980
• Strong displacement candle (no wicks)
Entry: Continuation OR retest of 4975–4980
Stop: Below 4950
TP1: 5000
TP2: 5050
TP3: 5150
This is a bullish continuation environment after a sell-side sweep + CHoCH.
You’re either:
• Buying the pullback into demand
• Or executing a clean breakout
Nothing else.
This is how Smart Money trades GOLD:
liquidity first, structure second, execution last.
If this helped you, make sure to like, boost, and follow Dynamic Trades for more execution-focused market breakdowns.”

Gold (XAUUSD) - 9 Feb | Watching POI Zone 4821-4808Gold (XAUUSD) Analysis – 9 February
Hello Disciplined Traders,
Welcome to the Chart Is Mirror Community 👋
Market Context
• Gold experienced a strong pullback after reaching the new all-time high at 5600 on 26 January , mitigating a major unmitigated level.
• Price found strong support at the 4402 level , followed by a bullish M15 structure shift and break of structure , confirming that the H4 pullback has ended and the broader uptrend has resumed.
• Last Friday, the market revisited the 4672–4656 demand zone , respected it, and continued the bullish move.
Key Observations
• Gold is currently trading around 4965 . From this area, a healthy pullback is expected before continuation.
• Our POI for the next long setup lies at the 4821.468–4808.262 demand zone .
• If price revisits this zone and shows LTF bullish confirmation , we will plan our long setup accordingly.
Execution Plan
• Wait for price to pull back into 4821.468–4808.262 .
• Execute long trades only with clear LTF confirmation .
• From this zone, the next upside target is the 5197 level .
• Market volatility remains high — manage risk carefully .
Let the pullback return price to value — then let confirmation invite execution.
📘 Shared by @ChartIsMirror

#Bitcoin Sunday Analysis $BTC is still trading below 72k,#Bitcoin Sunday Analysis
CRYPTOCAP:BTC is still trading below 72k, with only a few hours left before the weekly candle closes. If we close below this level, Bitcoin officially enters the accumulation zone between 54k and 72k. The daily candle has already closed inside this range. As I mentioned earlier, I expect price to trade within this box for weeks, possibly months.
The 72k level was critical, which is why I opened a long there. My expectation was a bounce leading to a move toward 80k to 85k. That plan failed, and I accept that I was wrong. For any meaningful recovery, Bitcoin must reclaim 72k and hold above it. Only then does a move toward 80k to 85k become realistic.
On the macro side, I remain cautious about a looming financial crisis. Since August 2025, corporate insiders have been offloading shares at record speeds. While retail investors remain heavily positioned in the stock market, this "smart money" exit is a major red flag.
Another important risk factor is BTC trading below MicroStrategy’s (MSTR) average entry near 76k. Given their leveraged exposure, this adds systemic risk, increases fear, and creates additional downside pressure, especially as their equity collateral weakens.
Narrative FUD: The Epstein Files
Expect additional panic as rumors circulate regarding the Epstein files and potential (though likely unsubstantiated) links to Bitcoin. While I doubt this fundamentally changes Bitcoin's value, the narrative will likely fuel FUD (Fear, Uncertainty, Doubt) and emotional selling among the masses.
I am still holding my remaining short position. I initially bet on 72k holding, but that level broke. I am now dollar cost averaging (DCA) on the long side, with my current long average around 67k. After the recent recovery, I closed 50% of my long position. I will consider adding more longs below 60k.
I do not believe the bottom is in yet. Further downside is possible, even below 50k, and if that happens, I will actively manage my long positions accordingly.

BLK – Failed Breakout → Corrective Phase
Ticker: BLK
Timeframe: Daily
Bias: Neutral → Bearish (until reclaim)
BLK is a late-cycle leader cooling off.
Structure favors sell-the-rally behavior until proven otherwise.
BlackRock remains in a long-term uptrend, but recent price action confirms a momentum shift and distribution after a failed breakout above the ~1,200 supply zone.
Market structure breaks near the highs signal seller dominance at premium prices. This is no longer a trend-continuation environment.
Key Technical Observations:
Strong rejection from HTF supply (1,180–1,220)
Price below 14 / 50 / 100 EMAs
200 EMA (~1,065–1,070) acting as resistance
Primary Short Setup (Continuation Bias)
Entry:
📍 1060- 1,075
→ Short on rejection / weak bounce into the 200 EMA or prior structure
Stop-Loss:
❌ 1,115 (daily close invalidation) >> Above reclaimed structure + EMA cluster
Targets:
🎯 TP1: $980 (range support / partials)
🎯 TP2: 950 (intermediate demand)
🎯 TP3: 920 (macro trendline support)
Not financial advice. Educational purposes only.

Great Short!HELLO all. As you see a very great Short is coming and it is time to go short. then market will jump Up. I will told you that movement.

TNT - Final DrawingMoon king time its free cheese into the 4 yr cycle low. rhett is gonna lose all his money while me and Cole are rich millionaire and everyone cries. 🤑🤑💵💵🫰🤑🤑🤑🙏🙏🍇🍇🐪🐫🐪🐫🐪🐫🐪🐫🐪🐫🐪🐫🐪🐫🐪🐫🐪🐫🐪🐫🐪🐫🐪🐫🐪🐫🐪🐫🐪🐫🐪🐫🐪

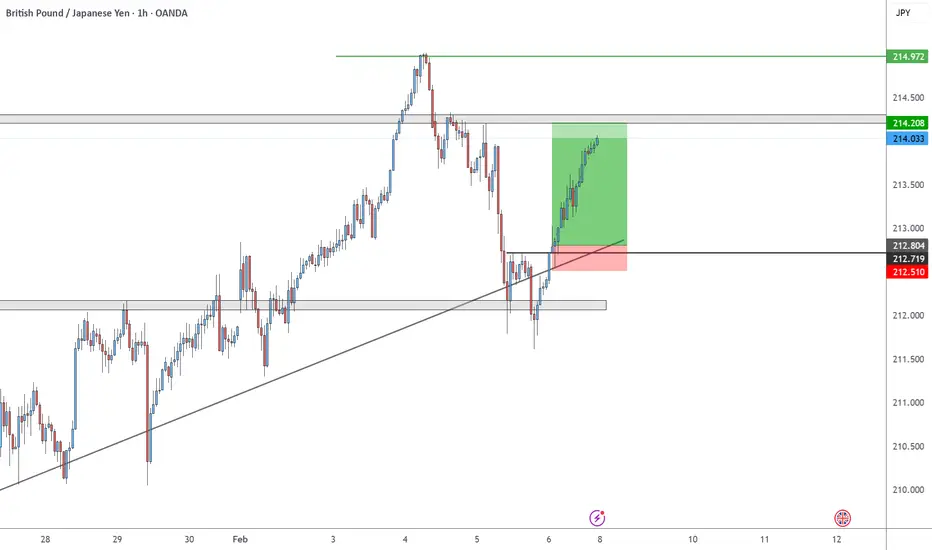
GBPJPY ON THE RISE After respecting all technical structures and a strong bullish candlestick formation on the 4 hour time frame, GBPJPY is most likely to revisit the 214.972 level. A conversative take profit will be achieved on market open hopefully💵🏆
Gold is going to be messy or continue upward As per my study there is two scenario right now
1 scenario see a harmonic pattern which is most likely formed at top but it is only valid if gold breaks its structure or break higher low .
2 scenario if gold breaks ATH with a strong candle with volume then scenario 1 is invalid and gold continue enters new trajectory / price discovery


US Oil: Buy The Pullback!In this Weekly Market Forecast, we will analyze the US OIL for the week of Feb. 9-13th.
US Crude Oil had a very strong January. December we see the market in a pullback, correcting the Jan impulsive move.
This market is still ranging, and valid shorts or longs are difficult to recognize.
Wait for PD Arrays to be respected or disrespected. Highs/lows, FVGs and OBs.
Price is being supported by an +OB now. The move up and away from it is worth buying. If the +OB fails, and price trades through the lows of the consolidation, then sells are valid.
Enjoy!
May profits be upon you.
Leave any questions or comments in the comment section.
I appreciate any feedback from my viewers!
Like and/or subscribe if you want more accurate analysis.
Thank you so much!
Disclaimer:
I do not provide personal investment advice and I am not a qualified licensed investment advisor.
All information found here, including any ideas, opinions, views, predictions, forecasts, commentaries, suggestions, expressed or implied herein, are for informational, entertainment or educational purposes only and should not be construed as personal investment advice. While the information provided is believed to be accurate, it may include errors or inaccuracies.
I will not and cannot be held liable for any actions you take as a result of anything you read here.
Conduct your own due diligence, or consult a licensed financial advisor or broker before making any and all investment decisions. Any investments, trades, speculations, or decisions made on the basis of any information found on this channel, expressed or implied herein, are committed at your own risk, financial or otherwise.

MSNR BACKTEST ON EURCADWorking on the HTF storyline such as Monthly or weekly is a higher probability setup. Understanding price action from the higher timeframe will always increase your RR rate.
You always has to analyze and waiting for setup to aligned

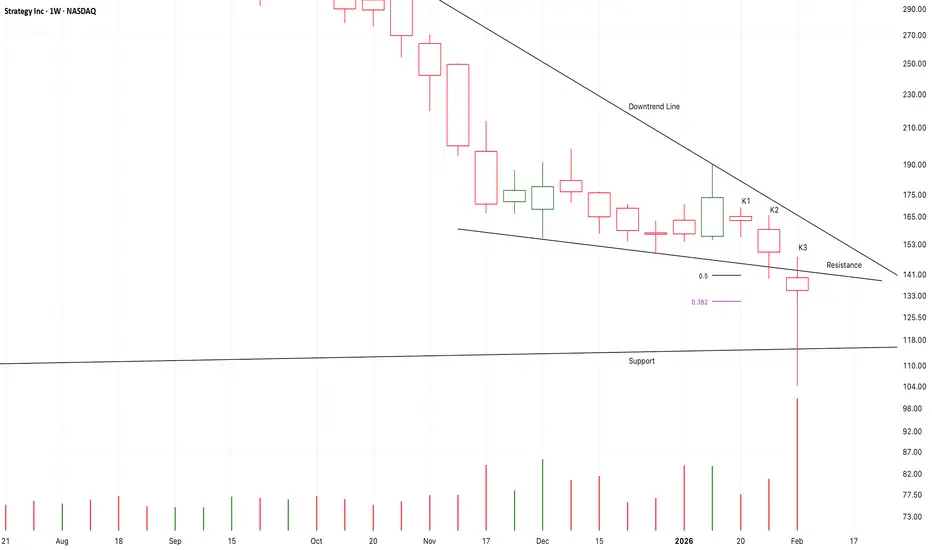
Chart Pattern Analysis Of MSTR
K3 verified a potential support here,
Perhaps it is an earlier signal of a potential bear bottom.
But it must break up the nearest downtrend line here,
And, the support must be verified by more tests.
It takes more time for a bear bottom than a bull top.
If the following candles fall to test the support,
I will try to buy it.
I am expecting the bear market of the bitcoin price target at about 56-50K area.
CEPB (Century Paper & Board Mills Ltd)-Bullish Setup-Swing TradeTimeframe: Daily (1D)
Market: PSX
CEPB is showing a healthy pullback within an overall uptrend. Price has formed a Higher Low (HL) after a previous Higher High (HH), indicating continuation strength.
🔹 Entry:
Buy at current price or on dips within the highlighted demand zone (around 38.0 – 41.8)
🔹 Stop Loss (SL):
35.9 (below structure support)
🔹 Targets:
TP 1: 46.5 – 46.7 (previous high / resistance)
TP 2: 50.6 – 50.8 (next resistance zone)
🔹 Confirmation Factors:
Higher High – Higher Low structure intact
Pullback into demand zone
Volume contraction during retracement (bullish sign)
⚠️ Risk Management:
Trade with proper position sizing. This is a technical view only, not financial advice.

Gold (XAUUSD) – 4H Technical AnalysisGold (XAUUSD) – 4H Technical Analysis
Market Structure
The broader structure is still corrective within a bearish phase.
Price previously broke and closed below the main bullish red trendline, confirming loss of bullish control.
The green descending trendline defines the current bearish corrective channel and remains intact.
Key Observations
The red trendline zone (marked by the orange circles) acted as strong dynamic support, producing clear reactions, but without structural reversal.
The rebound from that zone is corrective, not impulsive.
Price is still trading below the green descending trendline, meaning sellers retain control.
Key Levels
5,081.98: First major resistance. This level aligns with prior structure and corrective highs.
5,269.35: Upper resistance and key decision level. Only a strong 4H close above this level would suggest a deeper bullish recovery.
4,966 – 4,950 zone: Current consolidation area.
Red trendline zone below remains critical long-term support.
Scenarios
Primary scenario – Corrective upside
Price may continue pushing higher toward 5,081.98, potentially extending to 5,269.35.
This move remains a pullback unless structure changes.
Bearish continuation
Rejection from the green trendline or failure below 5,081.98 keeps bearish pressure active.
A continuation lower remains valid as long as price stays below the descending trendline.
Confirmation Rules
No bullish reversal unless price:
Breaks the green trendline and
Holds above 5,269.35 with a clean 4H close.
Until then, upside is corrective and not trend-changing.
Conclusion
Structure: Bearish / corrective
Current move: Retracement
Bias remains cautious below resistance.
Patience required — confirmation is mandatory before shifting bias.
— Avo.Trades

HBR on LSE (oil/gas)Climbing above historic price level.
Last few lows have all clipped the prev lows stops, to me this seems like attempts to catch the last remaining cheap shares by a bigger entity and to check the status of buyer demand.
RSI is failing to enter bearish zone of below 40.
Trading volume is increasing.
TP 25% at each target.
If stop is too wide, you can DCA into position

Silver (XAGUSD) – 4H Technical AnalysisSilver (XAGUSD) – 4H Technical Analysis
Market Structure
The broader structure has flipped bearish.
Price has clearly broken and closed below the primary bullish red trendline, then failed to reclaim it → bearish confirmation is valid.
The green descending trendline is currently acting as dynamic resistance, keeping price capped.
Current Price Behavior
After the sharp selloff, price is in a corrective phase, not a trend reversal.
The rebound from the recent lows is weak and corrective, showing no impulsive bullish structure.
As long as price stays below the red trendline and below 88.50, the bias remains bearish.
Key Levels
88.50: Major resistance (horizontal + trendline confluence).
This is the decision level.
77.90: Current reaction zone / short-term support.
Lower red trendline (around low 60s): Long-term structural support if bearish continuation expands.
Scenarios
Bearish continuation (primary scenario)
Rejection from the green trendline or from 88.50 confirms sellers still control the market.
Failure to close above 88.50 keeps the move corrective.
Bullish correction only (not trend change)
A push toward 88.50 is acceptable as a retracement.
Only a strong 4H close above 88.50 and above the red trendline would neutralize bearish pressure.
Until then, upside is corrective.
Conclusion
Structure is bearish.
Current move is a pullback, not a reversal.
Shorts remain favored below 88.50.
No bullish bias unless there is a confirmed 4H break and close above resistance.
— Avo.Trades

US30 H1 Bullish SetupUS30 has delivered a clean bullish Market Structure Shift (MSS) after a strong impulsive rally from the higher-timeframe order block. The move shows clear displacement, confirming institutional participation and a shift in short-term order flow.
📊 Technical Breakdown:
• Strong rally from HTF demand → buyers in control
• Bearish structure broken → MSS confirmed
• Impulse leg created inefficiency / imbalance
• Current price extended → pullback expected, not a reversal
📍 POI for Next Wave:
• Previous structure + imbalance zone (marked area)
• Ideal area for bullish continuation if price reacts with acceptance
🔼 Bullish Scenario:
As long as price holds above the broken structure, buy-the-dip remains valid, targeting continuation toward new highs.
🔻 Risk / Invalidation:
A sustained break and H1 close back below the POI would signal deeper correction toward lower demand.
🧠 Execution Plan:
Wait for pullback → watch reaction (structure + momentum) → execute only with confirmation.

EURUSD: Bullish-Neutral. Potential For Short Term Sells?Welcome back to the Weekly Forex Forecast for the week of Feb. 9-13th.
EURUSD broke out of the consolidation two weeks ago, only to quickly pullback into the range last week.
This is not a great trading environment.
Look for the short term bearishness to potentially continue into this week. Wait for the market to seek liquidity, and look to fade that move.
NFP is Wed, and CPI is Friday. High impact potential, so be careful in these markets!
Enjoy!
May profits be upon you.
Leave any questions or comments in the comment section.
I appreciate any feedback from my viewers!
Like and/or subscribe if you want more accurate analysis.
Thank you so much!
Disclaimer:
I do not provide personal investment advice and I am not a qualified licensed investment advisor.
All information found here, including any ideas, opinions, views, predictions, forecasts, commentaries, suggestions, expressed or implied herein, are for informational, entertainment or educational purposes only and should not be construed as personal investment advice. While the information provided is believed to be accurate, it may include errors or inaccuracies.
I will not and cannot be held liable for any actions you take as a result of anything you read here.
Conduct your own due diligence, or consult a licensed financial advisor or broker before making any and all investment decisions. Any investments, trades, speculations, or decisions made on the basis of any information found on this channel, expressed or implied herein, are committed at your own risk, financial or otherwise.

US30, Big Money Waiting Below, Buy the Dip or a Trap?📌 Market Structure
On the higher timeframe, H4 structure remains bullish, indicating that institutional money is still in control.
The recent move on H1 shows a short-term downtrend, which appears to be a controlled pullback rather than a full trend reversal.
📌 Order Block & Volume
Price is approaching a clear Bullish Order Block on the H2 timeframe.
Strong volume expansion near the lows confirms that Big Money has already reacted in this zone.
This is not panic selling, but a technical retracement into demand.
📌 Liquidity Perspective
The recent sell-off has swept late buyers’ liquidity above previous highs.
After liquidity is taken, price often returns to an Order Block to rebalance and accumulate long positions.
📌 Trading Plan
Buy Zone: H2 Bullish Order Block
Stop Loss: Below the Order Block low
Target: Upper liquidity zone
Risk / Reward: Approximately 2 : 1, aligned with institutional trading logic
🧠 Final Thought
As long as the H4 uptrend remains intact, pullbacks should be viewed as accumulation opportunities, not reasons to panic.
⚠️ Disclaimer
This analysis is for educational purposes only.
Not financial advice. Always manage your risk.
