GBPJPY | Pullback Into Resistance – Preparation PhaseGood morning. We’ve identified a developing setup on the GBP/JPY 4-hour chart.
Price appears to be forming the 4th leg of a broader downtrend and is currently pushing up toward a well-defined resistance zone. At that level, we’ll be watching closely for clear rejection.
What still needs to happen:
Momentum needs to rise to at least 60+ (the higher, the better), then hook back down
Rejection at resistance must be clear and respected
High volume confirmation across multiple timeframes (4H, 1H, and 15M) to complete the VMS alignment
Until all conditions are met, this remains watchlist only.
Preparation—not prediction—is one of the keys to long-term success.
Trend Analysis

NZDUSD resistance retest at 0.6066The NZDUSD remains in a bullish trend, with recent price action showing signs of a breakout within the broader uptrend.
Support Zone: 0.5970 – a key level from previous consolidation. Price is currently testing or approaching this level.
A bullish rebound from 0.5970 would confirm ongoing upside momentum, with potential targets at:
0.6066 – initial resistance
0.6090 – psychological and structural level
0.6140 – extended resistance on the longer-term chart
Bearish Scenario:
A confirmed break and daily close below 0.5970 would weaken the bullish outlook and suggest deeper downside risk toward:
0.5940 – minor support
0.5920 – stronger support and potential demand zone
Outlook:
Bullish bias remains intact while the NZDUSD holds above 0.5970 A sustained break below this level could shift momentum to the downside in the short term.
This communication is for informational purposes only and should not be viewed as any form of recommendation as to a particular course of action or as investment advice. It is not intended as an offer or solicitation for the purchase or sale of any financial instrument or as an official confirmation of any transaction. Opinions, estimates and assumptions expressed herein are made as of the date of this communication and are subject to change without notice. This communication has been prepared based upon information, including market prices, data and other information, believed to be reliable; however, Trade Nation does not warrant its completeness or accuracy. All market prices and market data contained in or attached to this communication are indicative and subject to change without notice.

Nikkei moves in a strong momentumNilkkei index is in play
The change in the political landscape and economic conditions creates a bullish pressure for Nikkei index, as now this market represents a perfect combination of monetary policy conditions (when the interest rate is increasing but is still very low compared to other counties), and internal fundamental factors (inflation in Japan starts rising consistently driven by the internal demand).
The momentum trade involves a possible breakout of a consolidation area or a continuation chart pattern on the way of a trend. The possible track is shown on the chart below.
Don't forget - this is just the idea, always do your own research and never forget to manage your risk!

PLTR ORDER FEB 2026**PLTR (1D) Institutional Read**
Price is trading below the key **distribution band at 150–162** (repeated rejection/offer absorption overhead). As long as price remains below that shelf, rallies are likely to be sold into. **120** is the near-term line in the sand; if it holds, that’s where bids are showing up and you can expect mean-reversion attempts back into the supply band.
**Institutional flow zones**
* **Distribution / supply:** 150–162 (overhead inventory; expect sellers to defend and trap late longs).
* **Demand / absorption:** 100–110 (area where downside liquidity tends to get absorbed; buyers likely reload there if 120 fails).
**Targets**
* **Target up:** 160 first, then **180** (clear next upside magnet if 162 is reclaimed/held).
* **Target down:** **120** first; below that **100** (extended flush risk toward ~75 if 100 breaks).

RIOT, stronger than most miners!NASDAQ:RIOT
🎯 Despite difficulty, RIOT looks stronger than most miners. It is grinding above the weekly 200EMA and pivot. Expected behaviour. The uptrend is higher highs and lows but the price is struggling at High Volume Node resistance. Price appears to be in a wave 3 with a target of $40, the R3 weekly pivot.
📈 Weekly RSI hasbullish divergence at the EQ
👉 Analysis is invalidated if we close below the weekly 200EMA
Safe trading

GBPUSD — Moderate BearGBPUSD — Moderate Bear With Double Squeeze Building, Compression Before Expansion
Overview:
Cable is coiling tightly at 1.36340 with a high squeeze at 8 bars and a volume squeeze also building. The bias is moderately bearish but price is virtually flat with zero bounce. This is a textbook pre-expansion compression pattern — when both price and volume squeeze simultaneously, the eventual release tends to be aggressive.
Price:
Trading at 1.36340 on FX. Price is essentially flat with only -0.2% retrace and 0% bounce, classified as 0.2x Flat. No directional commitment from price action at all — this is pure compression. Price is sitting just below a supply zone, which adds a bearish lean to any squeeze resolution.
Bias:
Moderate BEAR at 17.86% conviction with a 41.1% to 58.9% signal split. Candle signals are heavily bearish at 2:12, but Ichimoku is deadlocked at 7:7 and EMA leans slightly bullish at 4:3. The C>T counter timeframe reading is bearish at 5:9, meaning higher timeframes agree with the downside. Signal spread of 28.6% is moderate — directional but not dominant. Clarity at 50% reflects the compression state.
Volume:
Both volume and price are compressed simultaneously — a rare and significant setup. Volume Z-score is -0.46 (Steady), spot volume only 8.49K with 6.23K session volume. Momentum is decelerating at -0.53. The critical signal here is V.Sqz Building at 2 bars alongside the price squeeze at 8 bars. When volume compression meets price compression, the breakout tends to carry further because there's stored energy on both sides.
Squeeze:
This is the centrepiece of this setup. Price squeeze is HIGH at 8 bars and building. Volume squeeze is also building at 2 bars. Momentum is Bear ↓ with a tight bandwidth of just 0.16% — extremely compressed. The S.Mom reading shows Exp ↑ at 128.5%, indicating momentum expansion is expected. Everything points to an imminent directional move — the question is whether supply holds and pushes price down, or a breakout above supply traps the bears.
Scenarios:
🐻 Supply rejection, squeeze breaks down (primary lean):
The supply zone overhead, bearish candle structure at 2:12, and bearish C>T reading of 5:9 all favour a downside resolution. If the squeeze releases with momentum staying Bear ↓ and volume Z-score spikes negative, this could be a clean short setup. Watch for a decisive candle below the compression range with expanding volume.
🐂 Supply break, squeeze breaks up (secondary):
EMA leans slightly bullish at 4:3 and Ichimoku is split 7:7. A break above the supply zone with volume expansion would invalidate the bearish case and could trigger a sharp short squeeze. This would need volume Z-score flipping above 1.0 and momentum reversing to Bull ↑.
Watch:
Squeeze release — 8 bars of compression, release is imminent, direction determines the trade
Volume squeeze — building at 2 bars, convergence of both squeezes amplifies the eventual move
Supply zone — price is right at it, a hold confirms bearish, a break confirms bullish
C>T balance — 5:9 bearish gives higher timeframes a slight edge for downside
Bandwidth — 0.16% is extremely tight, expansion is inevitable
Risk:
No futures data available. The double squeeze setup (price + volume) creates a high-reward scenario but timing is uncertain. Clarity at 50% and moderate signal spread mean conviction is not extreme. This is a setup where patience pays — let the squeeze resolve and enter on the breakout candle rather than anticipating direction. The bandwidth at 0.16% means any move will look dramatic relative to recent action, so position sizing should account for the likely volatility expansion.
👆More analysis on my profile.
Suggested tags: GBPUSD forex squeeze compression volumeanalysis technicalanalysis cable

EURUSDPrice action trading is a methodology in financial markets where traders make decisions based on the actual price movements of an asset over time, rather than relying heavily on technical indicators or fundamental analysis. It involves observing and interpreting patterns and trends in price charts to predict future price movements.

MSTR, trying to reverse at support...NASDAQ:MSTR
🎯 Price dropped hard in wave Y of 4, invalidating the previous analysis. Wave Y can complete any time in this flat correction pattern, and is trying to print a bullish market structure from a major High Volume Node. Above $138 will trigger this long.
📈 Daily RSI sits at the EQ from oversold
👉 Continued downside has a target of the S3 pivot, $78.47
Safe trading

MARA, bottoming soon? Major support area...NASDAQ:MARA
🎯 Mara remains at the golden pocket support and channel lower boundary. It is below the weekly pivot and 200EMA, showing the bears are in control. Price appears to be in an Elliot wave 2, the lower trend line must hold here at the High Volume Node
📈 Weekly RSI is nearing oversold with no bullish divergence
👉 Analysis is invalidated if we close back below wave (II), $3.07
Safe trading

EJ GRABBING LIQUIDITY ej currently on a downtrend but will grab liquidity at equal highs for momentum to continue down.

IREN, one more push lower still to come, $27 targetNASDAQ:IREN
🎯 Iren wave 4 hit the daily 200EMA and S1 pivot, just above 0.382 Fibonacci retracement. Wave C of 4 is underway with a downside target of tthe High Volume Node, $27
📈 Daily RSI has printed a bearish divergence without a higher high.
👉 Analysis is invalidated if we go above wave B
Safe trading

DXY Bearish Continuation Toward 95.5 With 97.9 Stop LossThe U.S. Dollar Index (DXY) 4-hour chart shows a continuing bearish trend, with price respecting a descending trendline and forming lower highs. Recent price action retested the trendline and a key supply zone around 97.20–97.40, where selling pressure re-emerged. The rejection from this resistance area suggests that downside momentum may resume. Price is currently consolidating below the trendline, indicating weakness and lack of strong bullish continuation. If sellers maintain control, the index is likely to move lower toward the 95.5 target, which aligns with previous support. The stop loss is placed at 97.9, above the recent swing high and resistance zone, to manage risk.
If you found this XAUUSD analysis helpful, don’t forget to LIKE 👍 and COMMENT 💬!

Google, finally ready for wave 4 pullback...$GOOGLE
🎯 Google demonstrated what it means to be in a wave III, but the weekly bearish divergence has finally taken control. I am looking for a pullback to the weekly pivot and trend line, $260, the 0.236 Fibonacci retracement of wave 4, a likely place for bullish trends to retrace.
🎯 Wave IV is underway with a target of the rising daily 200EMA, the same targets as the weekly 0.236 above. There is a gap to fill at $220.
📈 Daily RSI bearish divergence has played out and is heading to oversold.
👉 Analysis is invalidated if price moves above wave III into all-time high

COIN, continues bearishly, reversal soon?NASDAQ:COIN
🎯 Price continued lower, ignoring all bullish divergences.. Price has filled the gap and sits in the High Volume Node. The bears are in control.
📈 Daily RSI went deep into oversold
👉 Analysis is invalidated below $40, wave 2 can extend deep, though i dont expect it to go much further down.
Safe trading

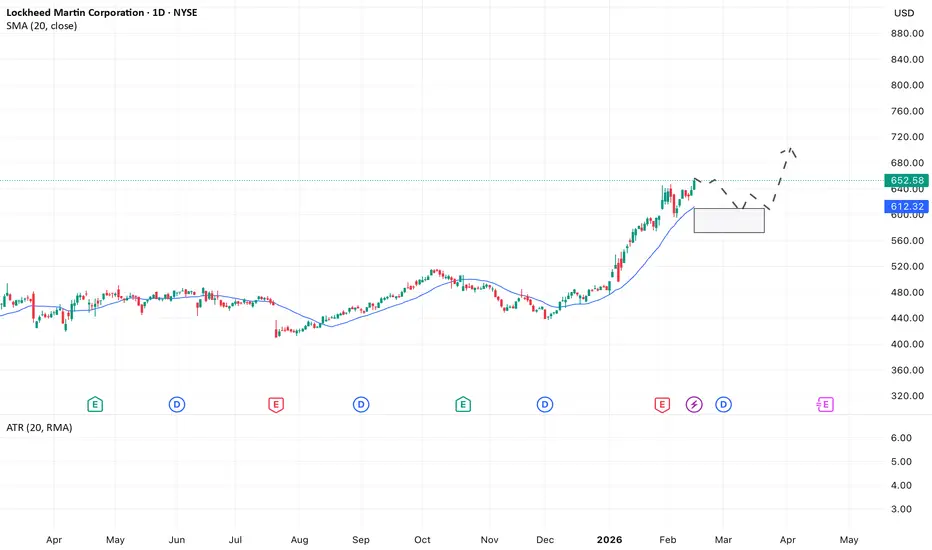
LMT is a medium-term opportunity for a momentum tradeLMT is in focus.
It is a textbook defensive industrial play. The core bullish thesis is the massive $160B+ backlog, providing exceptional revenue visibility regardless of the macro cycle. It’s a cash flow engine generating >$6B FCF/year, fueling aggressive buybacks and a solid ~2.6% yield. With low beta and exposure to high-tech Space infrastructure, it acts as a perfect portfolio stabilizer and consistent long-term compounder.
From a technical point of view, the price of LMT moves in the accelerating uptrend, and is located slightly above the dynamic support area (the area above 20 and 50 moving averages).
The decent trade location for a trend-following long trade would occur in the area between $550 and $600
Don't forget - this is just the idea, always do your own research and never forget to manage your risk!
CIFR, triangle finished, , whats next?NASDAQ:CIFR
🎯 The bearish triangle from the last report played out. “ This is a penultimate pattern, we can expect price to thrust lower, test the daily 200EMA, end the correction, then makes its way to new highs.” So far so good.
📈 Daily RSI is back to neutral at the EQ
👉 Analysis is invalidated if price falls below wave 4, suggesting we have a complex correction lower
Safe trading
