Bitcoin: Where Is The Bottom?Bitcoin sell off continues through the 90K to 88K support area. There have been no reversal confirmations on this time frame since I wrote my previous report. The reversal pattern that I was anticipating never even began to materialize. Trade opportunities were best found on the day trade time frames in my opinion. Why wasn't anyone calling for such a move back in August? All of the "experts" who seem to always know the future, until something like this comes along? This is why I don't forecast the future, instead I do my best to uncover potential risks which can lead to capturing potential opportunities.
88K is where I labeled Wave 1 of the broader 5th wave which I talked about for months. I warned investors that buying and attempting to hold above 100K was high risk. Bitcoin is NOW at prices worth monitoring for longer time horizon investing, BUT price has compromised the 88K overlap level. I interpret as we are no longer in the broader Wave 4 and instead, the Wave 5 of 5 is likely complete. There is a much lower chance that we get the dramatic rally into the 130Ks as a result.
This change in expectation is what guides how I gauge investment potential, which then shapes my strategy and goals. 73K is a MAJOR support level (previous all time high before the election) and it is now much more possible to be tested. IF there is any confirmed reversal before reaching this support, profit potential for SWING trades can be measured from the next series of resistances 95K, 100K, and 105K respectively. The 88K overlap suggests that Bitcoin is now in a broader Wave 2 which is likely to unfold in a long term range. A range low is more likely and has yet to be established. It could be 73K, it could be lower like in the 60Ks. SENTIMENT drives price over the short term which is why fundamentals alone are not enough.
There are many ways to begin accumulating Bitcoin inventory or acquiring exposure without buying Bitcoin itself. There's a entire collection of ETFs that track Bitcoin that have low cost fees. There are also other stocks that are highly correlated to Bitcoin but have their own unique characteristics which can enhance performance or help to mitigate some of the risks of buying Bitcoin itself. COIN is one of many examples. I would rather accumulate shares of a stock which is easily accessible and straightforward than accumulating Bitcoin itself simply out of convenience. I will talk more about this during my regular stream.
The illustration on my chart is ONE of many scenarios to consider for the coming weeks. While 73K is a possibility, I like it is a low probability that price will probe that low without attempting to retrace first. There is a pin bar in place but still lacking confirmation on this time frame. I believe there is a much higher chance of reversal from the current prices, BUT I do not expect an attempt at new all time highs any time soon. WAIT for confirmations, set profit objectives and keep expectations within the boundaries that are set forth by the PRICE STRUCTURE, not "experts" whose only agenda is to convert your attention into a paycheck.
Thank you for considering my analysis and perspective.
Trend Analysis

XAUUSDHello Traders! 👋
What are your thoughts on GOLD?
Gold continues to trade in a range-bound and choppy structure, showing back-and-forth movement with no clear directional bias in the short term.
In the current zone, price is trapped between channel resistance and key support, and a breakout from either side will determine the next strong move.
We expect gold to form a short-term upward correction toward the upper boundary of the descending channel and the resistance zone.
Once price reaches this area, a bearish rejection is likely, leading to a continuation of the downward trend toward lower support levels.
If gold breaks below the 4050 support zone and the daily candle closes below this zone,
this will confirm further downward continuation without any bullish pullback, signaling a stronger bearish wave.
As long as gold remains below the resistance zone and channel top, the short-term bias stays bearish.
Any upward movement is likely to be corrective, providing a potential setup for continuation to the downside.
Don’t forget to like and share your thoughts in the comments! ❤️

Lingrid | GOLD Weekly Analysis: Coiled Spring at Key CrossroadsOANDA:XAUUSD price action has settled into a tense, range-bound struggle, repeatedly testing the ascending trendline that has defined its path since late October. This persistent retest is a double-edged sword: while it demonstrates underlying buying interest, it also signals exhaustion and a growing risk of failure. The market is now at a critical juncture where the next decisive move will determine the immediate direction. A close below this trendline would be a significant bearish signal, such a break often triggers a deeper corrective pullback to complete an ABC pattern. Conversely, a strong breakout above the recent lower high near $4,130 could reignite the bullish momentum and target the $4,200 resistance zone.
The broader structure on the 4-hour chart reveals a clear downward channel forming from the peak in mid-October, with price currently trapped between the channel’s upper boundary and the ascending trendline support. This creates a tightening triangle pattern, a classic consolidation formation that typically precedes a sharp, directional move. Key levels to watch are the immediate support around $4,020 and the more substantial monthly low near $3,930. The current corrective move phase suggests the market is digesting prior gains, and the upcoming catalyst—whether it’s a fundamental driver or pure technical exhaustion—will likely force a resolution. The repeated tests of resistance near $4,230 have so far been unsuccessful, reinforcing the view that bulls lack the conviction to push higher without a catalyst.
For us the strategy is simple: wait for the breakout. The neutral stance is warranted as long as price remains within the converging trendlines. A close below the ascending trendline would be a clear sell signal, targeting the $3,930 support area. On the flip side, a sustained move above $4,150, especially with increasing volume, would be a buy signal, opening the path toward $4,200 and potentially $4,300. Until then, the market is in a holding pattern, with the balance of power shifting with every candle. The key takeaway is that the longer price trades in this narrow range, the more explosive the eventual breakout is likely to be, making patience the most valuable tool for navigating the coming week.
If this idea resonates with you or you have your own opinion, traders, hit the comments. I’m excited to read your thoughts!

BTCUSD: Bulls Aim for Recovery Toward $92,000 Resistance ZoneHello everyone, here is my breakdown of the current Bitcoin setup.
Market Analysis
BTCUSD continues to move within a clearly defined Downward Channel, respecting both the descending resistance line and the lower support boundary. After a prolonged bearish continuation from the major Range structure seen earlier, Bitcoin broke several intermediate support levels before reaching the Support Zone around $84,000, where strong buyers stepped in. A Fake Breakout below the channel support triggered aggressive buying activity, sending the price back above the Support Zone and forming a short-term recovery structure. From this point, BTCUSD made a corrective bounce and even managed to break above a minor descending resistance, confirming a temporary shift in momentum.
Currently, price is approaching the Resistance Zone near $88,000–$90,000, which aligns with the upper boundary of the Downward Channel. This area has previously generated strong sell-offs and remains the key obstacle for buyers. A clean breakout above $90,000 would signal bullish continuation and may lead to a deeper recovery toward the next liquidity cluster near $92,000–$94,000. As long as BTCUSD holds above the $84,000 Support Zone, the short-term structure supports a bullish correction. However, if price gets rejected from the $90,000 resistance and fails to stay above support, sellers may regain control and push the market back toward the lower channel boundary.
My Scenario & Strategy
From my perspective, BTCUSD maintains a bullish corrective outlook while respecting the Support Zone around $84,000. The first target remains the $90,000 Resistance Zone, which matches both horizontal resistance and the channel’s upper boundary. A confirmed breakout above $90,000 would open the path toward $92,000–$94,000, where the next reaction levels are located. I will look for long opportunities during pullbacks toward the Support Zone or along the rising minor trendline that formed after the fake breakout.
If BTCUSD breaks back below $84,000, the bullish scenario becomes invalid, and a continuation of the major downward trend may follow. For now, price action supports a bullish recovery setup as long as buyers defend the Support Zone.
That's the setup I'm tracking. Thank you for your attention, and always manage your risk.

XAUUSD Ascending Channel Strengthens: Bulls Target $4,130 TP1Hello traders! I want to share my view on the current XAUUSD setup. After a deep corrective move, gold has formed a local bottom around the Support Level at $4,000–$4,030, where strong buying pressure has re-entered the market. As shown on the chart, price is gradually climbing within a well-defined ascending channel, supported by the rising trendline and a parallel upper boundary. Inside this structure, the Buyer Zone has played a crucial role, providing the base for previous impulsive breakouts. Several fake breakdowns below the channel support confirmed the presence of significant demand. After these rebounds, XAUUSD twice reached the Seller Zone and the Resistance Level near $4,130, where it faced clear rejection and rotated back toward the Buyer Zone. Currently, gold is holding above the ascending channel support. If buyers continue to defend the $4,030 level and price remains stable within the Buyer Zone, I expect a move toward TP1 → $4,130, which is the nearest resistance. A clean breakout above this level would open the door for further bullish continuation toward the upper supply area around $4,200–$4,230. However, if the price breaks below the Buyer Zone and drops out of the channel, the bullish scenario becomes invalid, and the market may revisit the $4,000 support area. For now, the structure remains moderately bullish as long as price holds above demand and stays inside the ascending channel. Please share this idea with your friends and click Boost 🚀

AUD/JPY – H4 - Rising Wedge Breakdown | Key Zones Targeted📝 Description:
The AUD/JPY pair is showing a clear Rising Wedge formation on the 4H timeframe, with three clean touches on the trendline—indicating weakening bullish momentum. Price has now broken below the lower trendline, suggesting increased probability of bearish continuation toward the next key zones. FX:AUDJPY
This setup highlights:
Rising Wedge pattern
Trendline break
Retest opportunity
Key support zones at 99.00 and 97.80
AUD fundamentals: driven by commodity demand, RBA policy, and risk sentiment
JPY fundamentals: influenced by BOJ stance, yields, and safe-haven flows
This analysis is ideal for traders monitoring price action, forex patterns, and high-probability setups on AUD/JPY.
Keep an eye on upcoming economic releases from RBA, BOJ, and US data, as they can influence risk sentiment and impact this pair heavily.
✅ Support this analysis with a
LIKE 👍 | COMMENT 💬 | FOLLOW 🔔
It helps a lot & keeps the ideas coming!
⚠️ Disclaimer: This analysis is for educational purposes only and does not constitute financial advice. Forex trading involves high risk. Trade only with capital you can afford to lose and always do your own research.

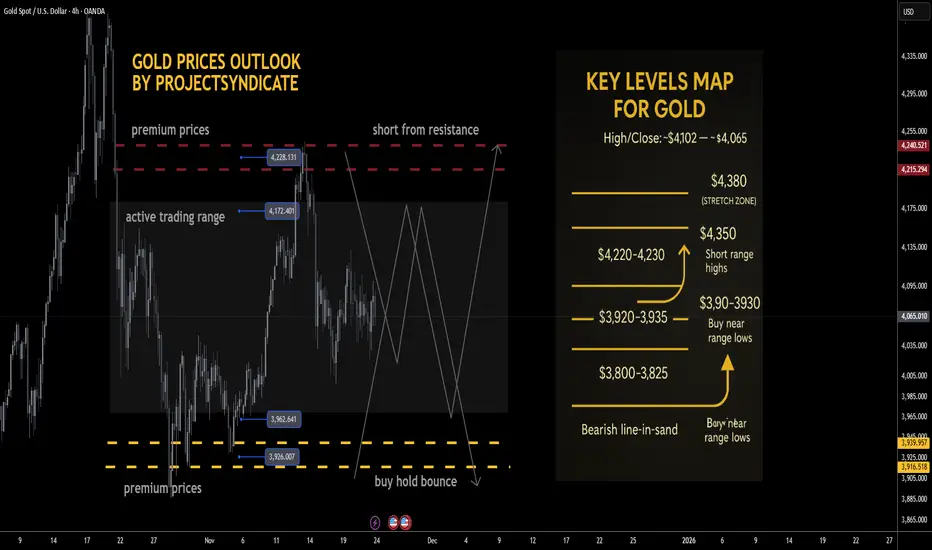
Gold next week: Key S/R Levels and Outlook for Traders🔥 GOLD WEEKLY SNAPSHOT — BY PROJECTSYNDICATE 🏆
High/Close: ~$4,102 → ~$4,065 — tight, inside-feel week with price holding comfortably above the $4,000 handle. Flows look balanced: steady two-way interest, but no strong directional conviction as the market oscillates within a well-defined range.
________________________________________
📈 Trend:
Still bullish on the higher timeframe, but very clearly in range / two-way mode. As long as we’re capped below the $4,350–4,375 ATH supply block and holding above the $3,900s, the playbook remains “range-trade the extremes” rather than chase breakouts.
________________________________________
🛡 Supports Buy Zones
• $3,920–3,930 — key range lows / primary dip zone:
o Your preferred “buy low” area; recent reactions show responsive buyers defending this shelf.
o This is the first major liquidity pocket for range longs and a natural first target for shorts from resistance.
• $3,800–3,825 — deeper demand pocket / fail-safe shelf:
o Secondary, more extreme downside area where higher-timeframe dip-buyers are likely to step in.
o A clean break and daily close below here would suggest the range is failing and a deeper mean reversion is in play, not just a normal pullback.
________________________________________
🚧 Resistances Short Zones
• $4,220–4,230 — immediate range resistance / short-sell zone:
o Your core “short from resistance” idea; this band remains a logical area to fade strength.
o First tests into this region are attractive for tactical shorts, especially if intraday momentum is stalling.
• $4,350–4,375 — ATH heavy resistance block:
o Still the major supply area above.
o Any spike here is a fade candidate unless price starts accepting above it with strong volume and multiple daily closes.
________________________________________
🧭 Bias – Coming Weeks
Base expectation is continued range-bounce price action between roughly $3,920–$4,220, with the broader structure still nested inside the larger $3,800–$4,350 range:
• Preference to fade strength into $4,220–4,230, targeting rotations back toward $3,920–3,930.
• Conversely, buy dips into $3,920–3,930 for moves back toward $4,220–4,230, as long as we hold the $3,800 shelf on a closing basis.
• Invalidation of the “range grind” idea comes on:
o Sustained acceptance above $4,350–4,375 (turns it back into trend-up).
o Or a decisive loss of $3,800–3,825 (opens a deeper corrective leg).
________________________________________
🔝 Key Resistance Zones
• $4,220–4,230 — front-line ceiling; aligns with your tactical short-sell band. Strong candidate to initiate shorts on first, clean tests.
• $4,350–4,375 — prior ATH / macro supply block. Only flips from “sell zone” to “bullish continuation base” if reclaimed and held as support.
🛡 Support Zones
• $3,920–3,930 — primary range low and first major liquidity shelf; ideal first take-profit for shorts and main dip-buy area.
• $3,800–3,825 — deeper support; loss of this level changes the narrative from “sideways digestion” to “larger corrective structure.”
________________________________________
⚖️ Base Case Scenario – Range / Consolidation
Core view: Market continues to oscillate between $3,920–$4,220, within the broader $3,800–$4,350 band.
• Pushes into $4,220–4,230 are sellable for rotations back toward $3,920–3,930.
• Dips into $3,920–3,930 are buyable for rotations back toward $4,220–4,230, as long as structure and flows remain balanced.
• While weekly closes keep rejecting the $4,350–4,375 ATH block, the default remains “sell strength, buy clean range lows.”
________________________________________
🚀 Breakout / Breakdown Triggers
• Bull trigger:
o Sustained acceptance above $4,350–$4,375, with multiple daily closes holding above and that band starting to act as support.
o That would shift tone from “range trading” back to full-on bullish trend, reopening path toward and beyond prior extremes (~$4,400+ in your framework).
• Bear trigger:
o A decisive daily close below $3,800 converts the current “healthy sideways correction” into a deeper, more directional liquidation phase, likely targeting prior lower shelves and expanding volatility.
________________________________________
💡 Market Drivers to Watch
Even in a range, macro and flow catalysts dictate which side of the range gets tested first:
• Real yields & Fed path: Any hawkish repricing or upside surprise in data tends to cap rallies near resistance; dovish shifts / easing fears support the lower end of the range.
• U.S. fiscal / political noise: Episodes of stress typically underpin gold; temporary relief or “risk-on” swings can blunt upside and push price back toward range lows.
• Flows & positioning: After a massive secular run, fast money continues to fade extremes, locking in profits into strength and reloading near range lows.
• Cross-asset behavior: If risk-off hits and gold fails to catch a bid (selling alongside equities), expect deeper probes into the lower end of the range before strategic buyers step back in size.
________________________________________
🔓 Bull / Bear Trigger Lines
• Bullish above: $4,350–$4,375 (sustained acceptance; ATH block reclaimed and used as support).
• Bearish below: $3,800 (shifts from contained range to deeper correction regime).
________________________________________
🧭 Strategy – Focus on Trading the Range
Primary plan – short from resistance (core idea):
• Entry zone:
o Scale into shorts around $4,220–$4,230 (front edge of resistance).
• TP #1:
o $3,920–$3,930 — key range lows; logical place to close majority of the short.
• Runner / extension:
o Leave a runner targeting $3,800–$3,825 if momentum and macro tone turn heavier.
• Risk / invalidation:
o Hard invalidation if price accepts above $4,350–$4,375 (multiple daily closes and successful retests from above).
________________________________________
Alternative plan – buy low from key range lows:
• Entry zone:
o Stagger bids in $3,920–$3,930; add more aggressive size only if we see responsive buying and positive reaction there.
o Optional deeper add zone at $3,800–$3,825 for higher conviction swing longs if structure still looks constructive.
• Exit zone / targets:
o First target back into $4,220–$4,230; heavily de-risk or fully exit as we approach that band.
• Risk management:
o Cut or significantly reduce longs on a daily close below $3,800 or if price accelerates through that shelf on high volume.
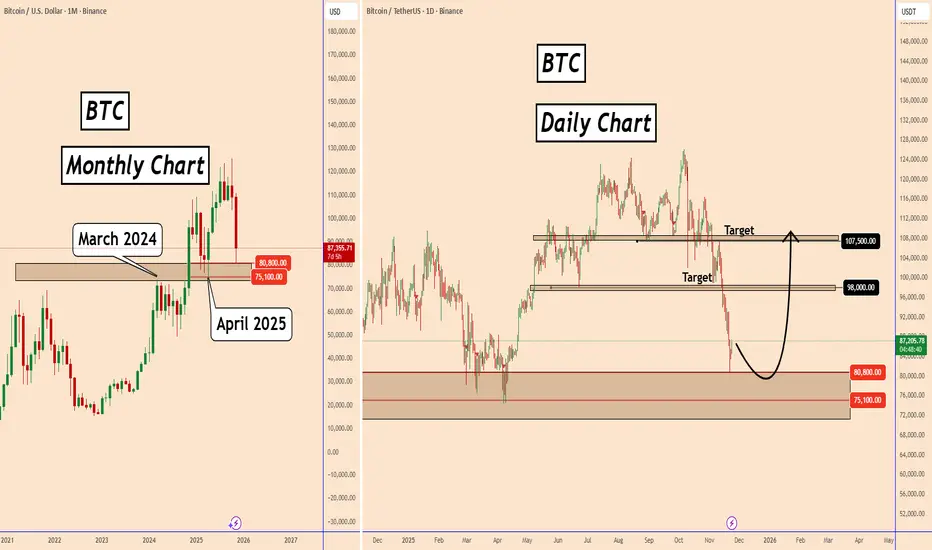
BTC at Key Support Zone - Bullish Setup in Progress?BTC at Key Support Zone - Bullish Setup in Progress?
Bitcoin has reached a major long-term support zone between 75,100 – 80,800, an area that previously acted as strong support in March 2024 and April 2025 on the monthly timeframe. The current monthly candle is testing this zone again, suggesting that buyers may step in to defend this historically important level.
On the daily chart, BTC has formed a sharp decline toward this support area, but the recent reaction indicates early signs of accumulation. If buyers continue to hold this zone, a mid-term recovery could develop.
As long as the 75,100 support holds, BTC maintains strong potential for a medium-term rebound. However, a clean break below this zone would invalidate the bullish outlook and expose deeper downside.
Key Levels to Watch:
Support: 75,100 – 80,800
Target 1: 98,000
Target 2: 107,500
You may find more details in the chart!
Thank you and Good Luck!
❤️PS: Please support with a like or comment if you find this analysis useful for your trading day❤️
AUD/USD – Fundamentals Driving Downtrend | 24.11.2025Bearish Channel + Rate-Cut Expectation Pressure = Downside Continuation Setup
🔍 Technical Setup
AUD/USD continues to trade inside a falling channel, respecting the trendline resistance (multiple rejections marked). Price is currently moving toward the resistance zone, offering a potential sell-on-retest opportunity before further downside.
📌 Bias remains bearish as long as price stays below the channel resistance + Ichimoku cloud.
🎯 Trading Plan :
📌 Targets (Support Levels):
1st Support: 0.64130
2nd Support: 0.63912
📌 Invalidation / Risk:
A breakout above 0.6480 would reduce bearish bias.
⚠️ Today’s Fundamental Drivers :
1️⃣ Rate-cut expectations surged:
Markets now price 69% chance of a December rate cut, up from 44% last week → weakens AUD.
2️⃣ New York Fed statement shook sentiment:
Fed official highlighted weak job market as a bigger risk than high inflation, increasing probability of monetary easing → USD firming vs risk currencies like AUD.
➡️ When fundamentals + technical trend align, continuation move is likely.
AUDUSD analysis, AUD/USD forecast, AUDUSD sell setup, Forex signals, Australian dollar outlook, Rate cut impact on forex, AUD technical analysis, price action strategy
⚠️ Disclaimer
This chart is for educational purposes only — not financial advice.
Always manage risk and follow your own trading plan.
❤️ Support the Analysis
If you found this helpful — LIKE 👍 & COMMENT 💬
Your support motivates more daily high-quality chart setups!

GOLD 1H CHART ROUTE MAP UPDATE & TRADING PLAN FOR THE WEEKHey Everyone,
Please see our updated 1h chart levels and targets for the coming week.
We are seeing price play between two weighted levels with a gap above at 4100 and a gap below at 4057. We will need to see ema5 cross and lock on either weighted level to determine the next range.
We will see levels tested side by side until one of the weighted levels break and lock to confirm direction for the next range.
We will keep the above in mind when taking buys from dips. Our updated levels and weighted levels will allow us to track the movement down and then catch bounces up.
We will continue to buy dips using our support levels taking 20 to 40 pips. As stated before each of our level structures give 20 to 40 pip bounces, which is enough for a nice entry and exit. If you back test the levels we shared every week for the past 24 months, you can see how effectively they were used to trade with or against short/mid term swings and trends.
The swing range give bigger bounces then our weighted levels that's the difference between weighted levels and swing ranges.
BULLISH TARGET
4100
EMA5 CROSS AND LOCK ABOVE 4100 WILL OPEN THE FOLLOWING BULLISH TARGETS
4140
EMA5 CROSS AND LOCK ABOVE 4140 WILL OPEN THE FOLLOWING BULLISH TARGET
4193
EMA5 CROSS AND LOCK ABOVE 4193 WILL OPEN THE FOLLOWING BULLISH TARGET
4233
EMA5 CROSS AND LOCK ABOVE 4233 WILL OPEN THE FOLLOWING BULLISH TARGET
4275
BEARISH TARGETS
4057
EMA5 CROSS AND LOCK BELOW 4057 WILL OPEN THE FOLLOWING BEARISH TARGET
4016
EMA5 CROSS AND LOCK BELOW 4016 WILL OPEN THE FOLLOWING BEARISH TARGET
3965
EMA5 CROSS AND LOCK BELOW 3965 WILL OPEN THE SWING RANGE
3923
3861
As always, we will keep you all updated with regular updates throughout the week and how we manage the active ideas and setups. Thank you all for your likes, comments and follows, we really appreciate it!
Mr Gold
GoldViewFX

SOLUSDT: Liquidity Tightens – Every Pullback Drops Even Deeper!When talking about Solana right now, the clearest feeling is that the market is losing strength day by day . Recent news shows that SOL has dropped sharply in November, and large capital keeps exiting the market — turning every bounce into an excuse for holders to sell rather than a sign of reversal.
On the H4 chart, SOL is trapped inside a descending wedge , repeatedly rejected by the Ichimoku cloud — an area that has consistently blocked every recovery attempt. Each previous bounce has only led to an even stronger downward leg.
The $130 level is the nearest immediate resistance and also aligns with the descending trendline. If price pulls back to this zone, there is a high probability of fresh selling pressure emerging. When that happens, SOL could continue dropping toward the psychological support at $100 — the key target in the current bearish outlook.
In summary, with both negative news and a weak technical structure, the most reasonable strategy now is to follow the downtrend , wait for price to pull back into resistance to find cleaner entries, and avoid catching bottoms when the market shows no clear reversal signals.

EURUSD: Targets focus on declines to 1.1480 support levelHello everyone, here is my breakdown of the current Euro setup.
Market Analysis
EURUSD continues to trade within a clear Downward Channel, maintaining a strong bearish structure characterized by consistent lower highs and lower lows. Early in the chart, the pair formed a prolonged Range Phase, signaling indecision before sellers eventually took control and pushed the price downward. After breaking below the range, EURUSD repeatedly retested the Resistance Area around 1.1550, where the market showed strong bearish reactions. Each bounce into this resistance zone resulted in a clear rejection, proving that sellers consistently defend this area. The chart also highlights multiple Breakout attempts, all of which failed to sustain upward continuation, confirming a lack of bullish strength. Additionally, the chart shows the formation of a Triangle Pattern, with price reacting between the Triangle Resistance Line and the Triangle Support Line. Despite temporary recoveries, every move upward was limited and capped by descending trendline pressure.
Currently, EURUSD broke below the minor structure support again, demonstrating that bearish momentum remains dominant. Price is now heading toward the Support Zone near 1.1480, which aligns with both horizontal demand and the Triangle Support Line. This confluence makes it a key level to watch. As long as EURUSD trades below the 1.1550 Resistance Area and stays inside the Downward Channel, the bearish structure remains intact. Any bullish recovery is likely to be corrective rather than trend-changing unless buyers manage to break above major resistance.
My Scenario & Strategy
I expect EURUSD to continue edging lower toward the 1.1480 Support Zone, following the recent rejection from resistance. A minor upward correction may occur, potentially retesting broken support or the Triangle Resistance Line, but such a move would likely be short-lived without strong bullish confirmation.
A confirmed breakdown below 1.1480 would open the path for deeper bearish continuation within the Downward Channel. Only a solid breakout above 1.1550, backed by strong buying pressure, would challenge the prevailing bearish trend. For now, selling the pullbacks remains the more favorable strategy while price stays below major resistance.
That's the setup I'm tracking. Thank you for your attention, and always manage your risk.

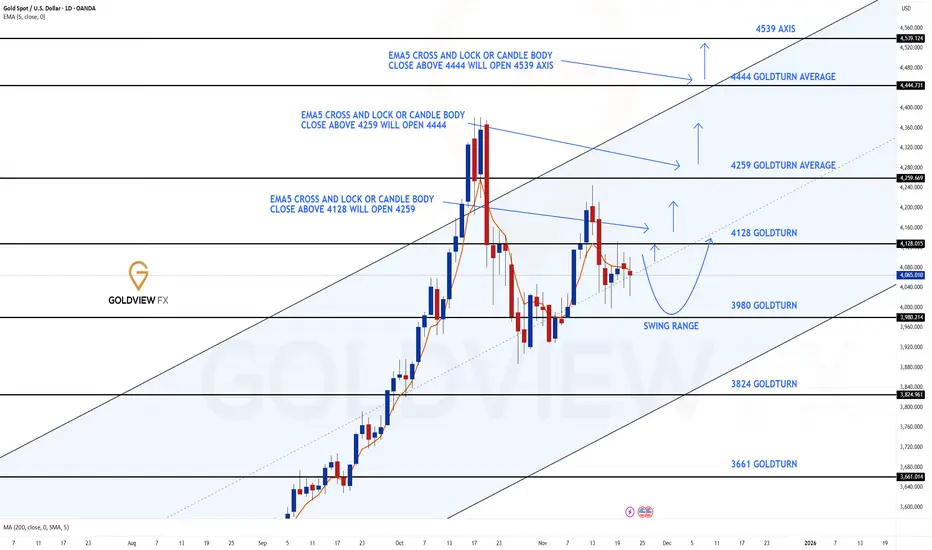
GOLD DAILY CHART ROUTE MAPHey everyone,
Please see our updated Daily chart route map with updated levels.
Price is currently playing between the longer daily chart range 4128 and 3980, with the channel half-line acting as support.
If this support holds, we should see a move toward the 4128 target. A body close or ema5 cross and lock below the half-line would open the swing range for a test and bounce. We're also watching for a break above 41238 to confirm a continuation above.
This is the beauty of our Goldturn channels, which we draw in our unique way, using averages rather than price. This enables us to identify fake-outs and breakouts clearly, as minimal noise in the way our channels are drawn.
We will use our smaller timeframe analysis on the 1H and 4H chart to buy dips from the weighted Goldturns for 30 to 40 pips clean. Ranging markets are perfectly suited for this type of trading, instead of trying to hold longer positions and getting chopped up in the swings up and down in the range.
We will keep the above in mind when taking buys from dips. Our updated levels and weighted levels will allow us to track the movement down and then catch bounces up using our smaller timeframe ideas.
Our long term bias is Bullish and therefore we look forward to drops from rejections, which allows us to continue to use our smaller timeframes to buy dips using our levels and setups.
Buying dips allows us to safely manage any swings rather then chasing the bull from the top.
Thank you all for your likes, comments and follows, we really appreciate it!
Mr Gold
GoldViewFX
XAUUSD 4H – Liquidity Map & Smart Money Outlook🌐 MARKET CONTEXT
Gold continues to trade within a bearish intraday structure, forming consistent Lower Highs → Lower Lows on the M30 timeframe. Price has been reacting strongly at Premium areas where Buy-Side Liquidity (BSL) accumulates, while showing clean rebounds at deeper Discount levels where Sell-Side Liquidity (SSL) resides.
Current Market Sentiment
USD remains steady → maintaining downward pressure on gold
Smart Money prioritizes selling at Premium and accumulating at Discount
Midweek environment → prone to liquidity sweeps before true expansion
Bias for the day:
🔻 Bearish bias, favor SELL setups at Premium zones
🔺 BUY only at deep Discount with CHoCH confirmation
📉 TECHNICAL ANALYSIS (SMC + LIQUIDITY STRUCTURE)
Market Structure
M30 trend: Bearish
Mid-range equilibrium: 4110–4175
Premium liquidity zone: 4378–4380
Deep discount zone: 3882–3884
Imbalances & Liquidity
Major bearish FVG: 4378–4380
Mid-level liquidity pocket: 4238–4240
Strong SSL levels: 3996 and 3882
🔑 KEY PRICE ZONES (Clear & Compelling Explanations)
1️⃣ 4380–4378 → Premium Liquidity Trap – MAIN SELL ZONE
This zone contains:
Buy-Side Liquidity from previous breakout attempts
An unmitigated M30 Supply Zone
A major FVG expecting full mitigation
➡️ Smart Money often drives price into this premium pocket to hunt liquidity before reversing sharply.
2️⃣ 4240–4238 → Mid-Range Liquidity Sweep – SCALP SELL ZONE
A highly reactive intraday level:
Holds clustered stoplosses from intraday traders
Sits near equilibrium → ideal area for engineered fakeouts
Often creates sharp wicks before reversing
➡️ Perfect for quick SELL scalps with minimal drawdown.
3️⃣ 3998–3996 → First Discount Reaction – SCALP BUY ZONE
This zone includes:
A clean SSL cluster just below
A sensitive micro Demand Zone
A common CHoCH reaction area on M30
➡️ Great for fast BUY scalps with tight risk.
4️⃣ 3884–3882 → Deep Discount Reversal Base – MAJOR BUY ZONE
This zone is extremely important:
Sits at the structural low on M30
Contains heavy Sell-Side Liquidity
Aligns with a higher-timeframe Order Block
➡️ If price taps here → strong reversal potential, possibly forming the weekly low.
⚙️ TRADE SETUPS (Detailed Execution Plan)
✔️ SELL GOLD – Main Position
Entry: 4380–4378
Stoploss: 4386
TP1: 4355
TP2: 4300
TP3: 4240
Logic: BSL sweep → FVG fill → strong bearish rejection expected.
✔️ SELL SCALP – Intraday Liquidity Sweep
Entry: 4240–4238
Stoploss: 4246
TP1: 4215
TP2: 4190
TP3: 4155
Logic: Sweep of mid-range liquidity → immediate downward displacement.
✔️ BUY SCALP – Discount Reaction
Entry: 3998–3996
Stoploss: 3990
TP1: 4015
TP2: 4045
Logic: SSL sweep → quick intraday rebound.
✔️ BUY GOLD – Deep Discount Reversal
Entry: 3884–3882
Stoploss: 3876
TP1: 3910
TP2: 3950
TP3: 3995
Logic: Major discount zone → high-probability reversal area.
🧠 SESSION NOTES
Avoid trading in the middle of the range
Wait for M5/M15 confirmation (CHoCH + displacement)
Do not buy at Premium zones
Do not sell at deep Discount zones
Let liquidity sweep first → then enter
🏁 CONCLUSION
Gold maintains a bearish intraday structure, favoring SELL setups at 4378–4380 and 4238–4240.
BUY opportunities appear only at strong Discount zones 3996 and 3882, where liquidity pools support bullish reactions.
Trade like Smart Money: wait for liquidity → strike with precision.

THE KOG REPORTTHE KOG REPORT:
In last week’s KOG Report we gave the potential path as well as the red box defence to look for any reaction in price. We managed to support the lower red box defence giving us a nice long to start the week then resulting in the higher defence holding and giving us an extremely decent short. It was only during the later part of the week we faced some choppy and whipsawing ranging which we decided wasn’t worth committing too much into, so we returned to scalping the red boxes only for the remainder of the week.
A decent week in Camelot, not only on Gold but the numerous other pairs we trade and analyse.
So, what can we expect in the week ahead?
It’s likely to be another week of choppy price action and potential for a range to develop even smaller than we’ve seen in previous sessions. We have the key level of support below again at 4040 while resistance above sits at key level of 4104. Economic news on Tuesday should bring volume and we would expect one of these levels to break open and the range to have accumulated enough to then move us into a clear direction.
We have added the red box defence up and down, ideally wanting a test of that low, so price going up on the open could represent opportunities to attempt the short unless defence is breached. Otherwise, we’ll look to take this into that 4000-3980 levels before we look for any RIPs.
RED BOXES:
Break below 4060 for 4055, 4050, 4041, 4033 and 4010 in extension of the move
Break above 4081 for 4095, 4103, 4120 and 4130 in extension of the move
Please do support us by hitting the like button, leaving a comment, and giving us a follow. We’ve been doing this for a long time now providing traders with in-depth free analysis on Gold, so your likes and comments are very much appreciated.
As always, trade safe.
KOG

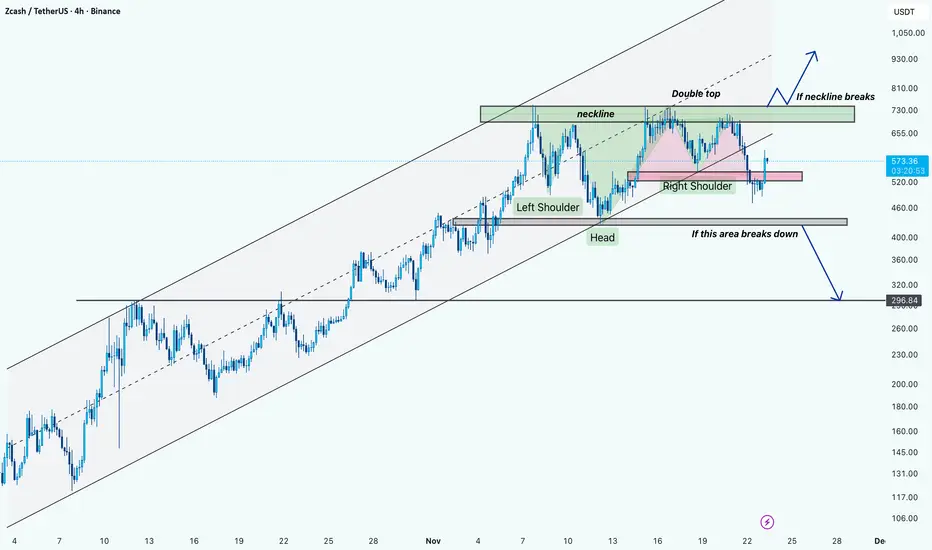
ZEC/USDT: Key Reversal Zone & Potential BreakdownHi!
Pattern Structure
Price has developed a clear inverse Head & Shoulders formation inside a long-term ascending channel.
Neckline sits in the $640–$720 supply zone, which overlaps with a double-top region.
Trend Context
Despite being in a broader ascending channel since early November, the right shoulder rejection and break below the minor trendline indicate weakening bullish momentum.
Critical Levels
Neckline / Double-Top Resistance: $640–$720
Local Support: $505–$520
Major Support Zone: $440–$460
Final Support: $296–$310 (high-timeframe demand)
Bearish Scenario
If the $505–$520 zone breaks decisively, the next downside target becomes the $440–$460 demand zone.
A further breakdown opens the door toward $296–$310, the next major structural support.
Bullish Scenario
If buyers reclaim the neckline area ($640–$720) with strong momentum, the pattern invalidates and the move toward $800+ becomes likely.
So if the neckline of the inverse head and shoulders breakout, then get long positions!
But if the support zone ($460) breaks down, then focus on shorts!
EURUSD Poised for Further Downside as Bearish Structure HoldsEURUSD Poised for Further Downside as Bearish Structure Holds
From our previous analysis, EURUSD reached our first target and found a strong support near 1.5300
EUR/USD continues to trade within a clear bearish structure after breaking down from the large symmetrical triangle formation earlier this month.
The pair is struggling to gain bullish traction, and every short-term recovery has been met with selling pressure.
Price is currently retesting the minor support area around 1.1530, but momentum remains weak.
The next support levels to watch are:
🔹 1.1470
🔹 1.1400
As long as the pair remains below 1.1665 resistance, the overall outlook favors further declines.
You may find more details in the chart!
Thank you and Good Luck!
❤️PS: Please support with a like or comment if you find this analysis useful for your trading day❤️

GOLD (XAUUSD): Support & Resistance Analysis for Next Week
Here is my latest structure analysis for Gold.
Vertical Structures
Vertical Support 1: Rising trend line
Horizontal Structures
Support 1: 4021 - 4045 area
Support 2: 3869 - 3934 area
Support 3: 3765 - 3829 area
Support 4: 3690 - 3738 area
Resistance 1: 4082 - 4133 area
Resistance 2: 4202 - 4246 area
Resistance 3: 4360 - 4382 area
Consider these structures for pullback/breakout trading.
❤️Please, support my work with like, thank you!❤️
I am part of Trade Nation's Influencer program and receive a monthly fee for using their TradingView charts in my analysis.

EURUSD: Support & Resistance Analysis for Next Week 🇪🇺🇺🇸
Here is my latest support and resistance analysis
for EURUSD for next week.
Consider these structures for pullback/breakout trading next week.
❤️Please, support my work with like, thank you!❤️
I am part of Trade Nation's Influencer program and receive a monthly fee for using their TradingView charts in my analysis.

XRP Approaching Key Supply Zone: Break or Reject?Hi!
Bullish Scenario
A bullish continuation becomes likely only if price breaks and closes above the $2.12–$2.18 S&D zone.
If that happens:
Buyers regain control
A retest could confirm support
Next target -> descending trendline at $2.35–$2.45
Conclusion:
Break S&D -> Long toward the descending trendline.
Bearish Scenario
If price rejects from the S&D zone and fails to reclaim $2.12–$2.18:
Momentum shifts back to the downside
Price may retest the $1.90–$1.92 zone, the most recent low
Further breakdown could lead to new cycle weakness

USDJPY -Min — Volume Buy & Sell Reversal Triggered⚡Base : Hanzo Trading Alpha Algorithm
The algorithm calculates volatility displacement vs liquidity recovery, identifying where probability meets imbalance.
It trades only where precision, volume, and manipulation intersect —only logic.
✈️ Technical Reasons
/ Direction — LONG / Reversal 155.500 Area
☄️Bullish momentum confirmed through strong candle body.
☄️Structure shifted with higher-low near key demand base.
☄️Volume expanding confirms order-flow alignment upward.
☄️Buyers reclaimed imbalance with sustained clean break.
☄️Algorithm detects rising momentum under low liquidity.
✈️ Technical Reasons
/ Direction — SHORT / Reversal 157.470 Area
☄️Bearish rejection confirmed through sharp candle body.
☄️Lower-high forming beneath resistance supply region.
☄️Volume decreasing confirms exhaustion in price rally.
☄️Sellers regained imbalance with heavy top rejection.
☄️Algorithm detects fading demand and shift to control.
⚙️ Hanzo Alpha Trading Protocol
The Alpha Candle defines the day’s real control zone — the first battle of momentum.
From this origin, the Volume Window reveals where the next precision strike begins.
⚙️ Hanzo Volume Window / Map
Window tracked from 10:30 — mapping true market behavior.
POC alignment exposes institutional bias and breakout potential zones.
⚙️ Hanzo Delta Window / Pulse
Delta window monitors real buying vs. selling power behind each move.
Tracks volume aggression to expose who controls the candle — buyers or sellers.
When Delta aligns with Volume Map, momentum becomes undeniable.

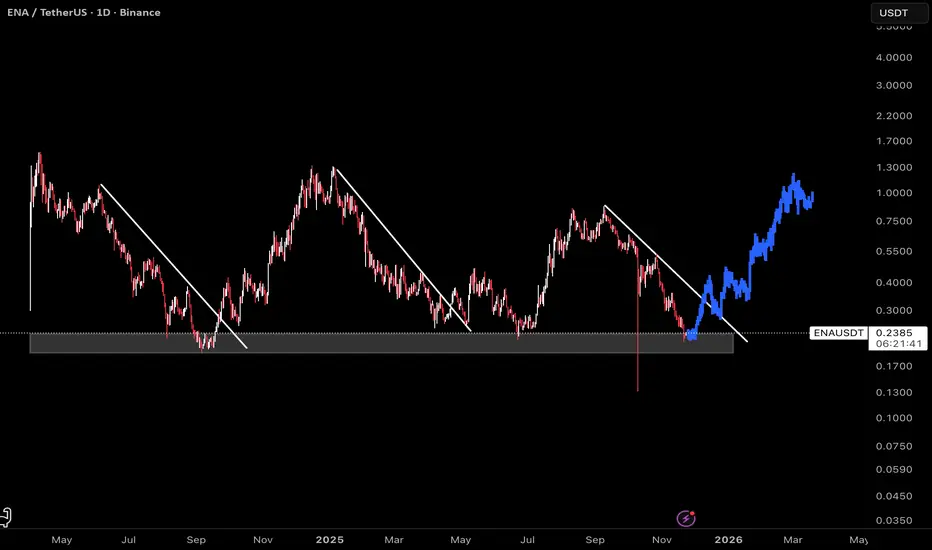
ENA: Bullish SetupThis chart displays ENA on a daily timeframe, with clear structure pointing to a favorable long entry. The current price action is trading within a major support zone, where previous trendline breaks have consistently marked the start of impulsive moves.
Historically, every time ENA breaks out above the descending trendline, the asset tends to retest the breakout level before accelerating higher.
A blue fractal shows past price evolution from October last year, highlighting the repeatable bullish pattern as price reverses trend, retests the breakout, and rallies to new highs.
As always, use prudent position sizing and stop-losses, particularly if support fails to hold.
This bullish setup is most likely to play out if the FED decides to cut interest rates in December.
It could serve as a strong macro catalyst to support the pattern shown here. Thus, watch for confirmation from the Fed policy easing may power the next leg up for ENA and similar assets.
Final 2025 Forecast for BTCUSDT 24th November 2025 (Updated)Same idea as previous post, just zoomed in to see the potential gyrations towards to move towards ~$128k and hopefully beyond ✌️
1. Friday session dip to around ~$81k
2. Pump to around ~$87k over the weekend
3. Dump down to ~$80k for Monday Trap
4. Black Friday Pump to ~$89k
5. Max Pain Dump to ~$75k-$79k
6. Final pump to ~$128k to end the cycle
If we are lucky and price pullbacks from ~$128k and then exceeds it. Here are the targets I would be looking at;
Target #1 $140k-$145k,
Target #2 $170k-$175k
Target #3 $200k-$205k
This of course could be 100% wrong so remember (as always) to ruthlessly ✂️ cut your losers when wrong, and hold ✊ onto your winners when right.
--
I might also add, come early December 1st - 5th the following celestial events will take place which support the run up to $128k (and possibly beyond);
1. Super Full Moon (“Cold Moon”) 🌖
• On December 4, 2025, there’s a nearly full moon (~98% illuminated). 
• This will be a supermoon, meaning the Moon appears slightly larger and brighter than average. 
• The Moon is in Taurus, and near the Pleiades (M45) — Taurus is represented no other than the Bull.
Supermoons correlate with:
• spikes in emotion
• increased speculative behavior
• temporary liquidity expansions
• bigger candles (up OR down)
A near-super full moon tends to:
• mark volatility apexes
• precede relief rallies
• create short-term “energy reversals”
2. Moon–Jupiter conjunction (Dec 7) — traditionally expansive 🌖
Jupiter is symbolically linked with:
• expansion
• optimism
• big moves
• risk-on thinking
• growth
• speculation
When the Moon (sentiment) aligns with Jupiter (expansion), it often coincides with:
• higher risk appetite
• FOMO
• bullish short-term flows
In Summary;
1. Moon–Jupiter conjunction (Dec 7) → Expansive, optimistic, risk-on symbolism
2. Super Full Moon (Dec 4) → Volatility peak → Reversal → Upward burst
