Gold is Nearing a Decent Support Area!Hey Traders, in today's trading session we are monitoring XAUUSD for a buying opportunity around 4,950 zone, Gold is trading in an uptrend and currently is in a correction phase in which it is approaching the trend at 4,950 support and resistance area.
Trade safe, Joe.
Trend Analysis
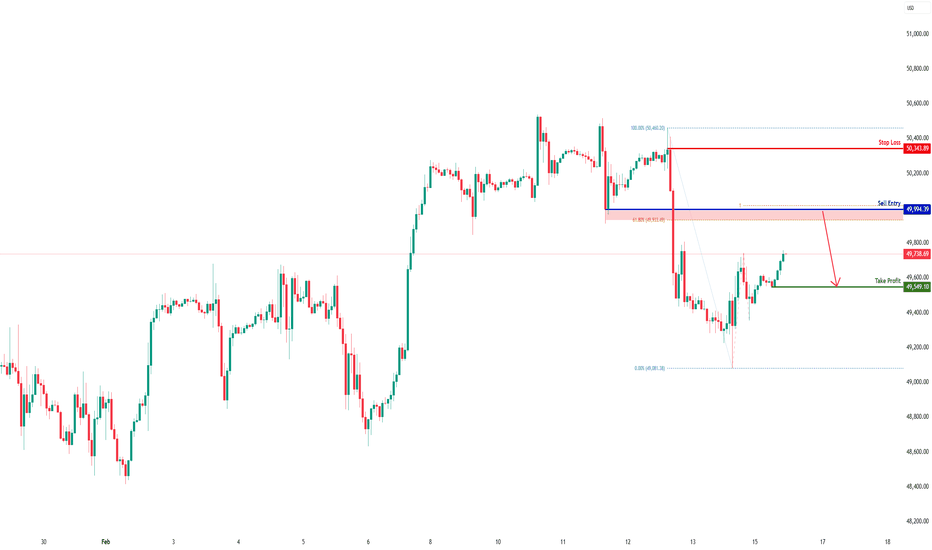
US30 H1 | Bearish Reaction Off Pullback ResistanceMomentum: Bearish
Price is currently below the ichimoku cloud.
Sell entry: 49,994.39
- Pullback resistance
- 61.8% Fib retracement
- 100% Fib projection
Stop Loss: 50,343.89
- Swing high resistance
Take Profit: 49,549.10
- Swing low support
High Risk Investment Warning
Stratos Markets Limited (fxcm.com/uk), Stratos Europe Ltd (fxcm.com/eu):
CFDs are complex instruments and come with a high risk of losing money rapidly due to leverage. 69% of retail investor accounts lose money when trading CFDs with this provider. You should consider whether you understand how CFDs work and whether you can afford to take the high risk of losing your money.
Stratos Global LLC (fxcm.com/en): Losses can exceed deposits.
Please be advised that the information presented on TradingView is provided to FXCM (‘Company’, ‘we’) by a third-party provider (‘TFA Global Pte Ltd’). Please be reminded that you are solely responsible for the trading decisions on your account. Any information and/or content is intended entirely for research, educational and informational purposes only and does not constitute investment or consultation advice or investment strategy. The information is not tailored to the investment needs of any specific person and therefore does not involve a consideration of any of the investment objectives, financial situation or needs of any viewer that may receive it. Past performance is not a reliable indicator of future results. Actual results may differ materially from those anticipated in forward-looking or past performance statements. We assume no liability as to the accuracy or completeness of any of the information and/or content provided herein and the Company cannot be held responsible for any omission, mistake nor for any loss or damage including without limitation to any loss of profit which may arise from reliance on any information supplied by TFA Global Pte Ltd.
Stratos Trading Pty. Limited (fxcm.com/au):
Trading FX/CFDs carries significant risks. FXCM AU (AFSL 309763), please read the Financial Services Guide, Product Disclosure Statement, Target Market Determination and Terms of Business at fxcm.com/au
Selena | XAUUSD · 30M – Post Breakdown Recovery SetupPEPPERSTONE:XAUUSD FOREXCOM:XAUUSD
After distribution inside the upper channel, sellers triggered a sharp liquidity grab below 4,920. The reaction from 4,900 shows strong buyer absorption. Price is now stabilizing above the demand zone, forming a potential higher low within a broader bullish context.
Key Scenarios
✅ Bullish Case 🚀
• Hold above 4,920 demand
• 🎯 Target 1: 5,020
• 🎯 Target 2: 5,080
• 🎯 Target 3: 5,150
❌ Bearish Case 📉
• Break below 4,900
• 🎯 Target 1: 4,820
• 🎯 Target 2: 4,750
• 🎯 Target 3: 4,680
Current Levels to Watch
Resistance 🔴: 5,020–5,080
Support 🟢: 4,920–4,900
⚠️ Disclaimer: This analysis is for educational purposes only. Not financial advice.
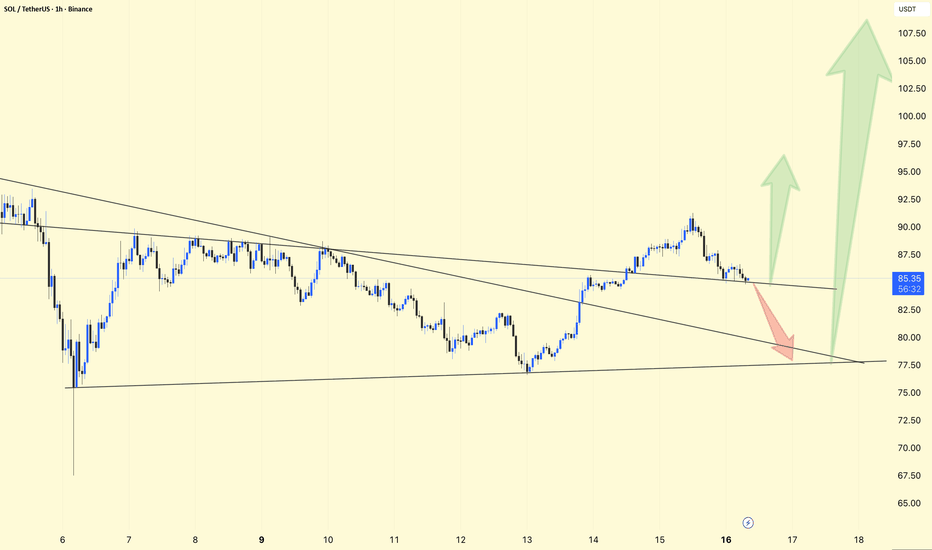
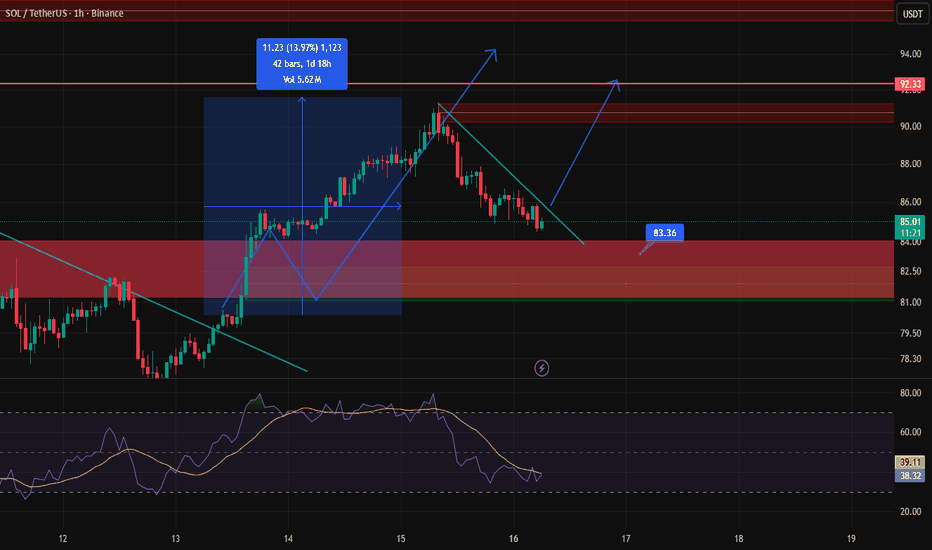
SOL/USDT CHART UPDATE. SOL is trading around 85, sitting exactly at the intersection of descending resistance and mid-range support. Price is compressing inside a narrowing structure after the recent push toward 90.
Lower highs still valid (macro downtrend intact)
Short-term higher lows forming from 77.5 base
Volatility contracting → breakout likely soon
Support: 83.5
Major Support: 77.5–78
Resistance: 87–88
Breakout Level: 90+
Strong reclaim above 88–90 → opens room toward 95 and potentially 105 if momentum accelerates.
Rejection here → move back toward 80 and possibly a sweep of 77.5 liquidity before any bounce.
Momentum shift only confirmed above 90.
⚠️ This is a decision zone — next 1–2 candles could define direction.
GBP/USD | retest, further fall or going up? (READ THE CAPTION)By examining the 2H chart GBPUSD we can see that after today's open, it has been rejected by the Jan 26th NWOG and Feb 16th NWOG several times. What I would like to see is for GBPUSD to retest the NWOGs, sweep the liquidity depicted in the chart and go for the Jan 26th NWOG High at 1.3667 level, and then a small correction.
Currently GBPUSD is being traded at 1.3660, if it gets rejected once more: 1.3645, 1.3637, 1.3630 and 1.3623.
If it manages to go through: 1.3667, 1.3675, 1.3683 and 1.3690.
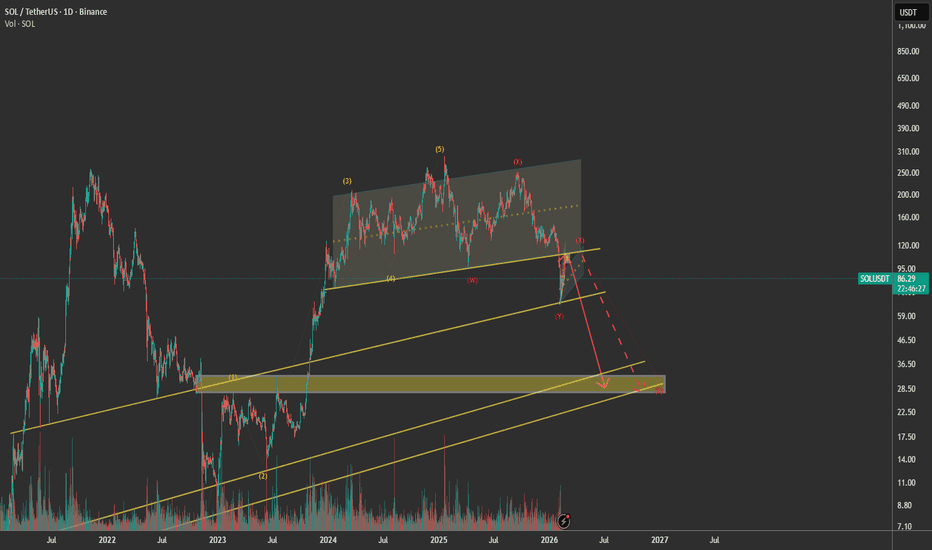
SOLUSDT: Relief Bounce Before Capitulation
Overall Bias: HTF Bearish until reclaim( $112 ish)
Framework: Market Structure + Fib + EMA Alignment + EW
Summary: possible relief bounce + short.
###############
Primary Plan:
###############
Primary Trade Plan — Sell the Rally
Short Setup
Entry Zone: $98 – $108
(previous breakdown level + EMA supply cluster)
Stop Loss: $112 daily close > (invalidation of lower-high)
Take Profits:
TP1: $82
TP2: $72
TP3: $62
Risk-to-reward: ~2.5R to 4R depending on entry.
###############
Secondary plan:
###############
Momentum trade only. If daily closes below $80:
Entry: $80–82 retest
Stop: $90
Targets: $70 → $60
_________________________________
Next Up... Relief bounce. Why this is likely?
- Daily is extended from EMAs
- Price sitting at 1.618 retrace zone
- No capitulation spike yet
- Bear trend intact
- SOL has broken below its rising channel and is trading under all major EMAs (50/100/200).
- Structure confirms a lower high and lower low sequence.
NOTE: Relief bounces are corrective — not impulsive. Until $112 is reclaimed on a daily close, the trend remains bearish.
Disclaimer: Educational purpose only. Not financial advice. Manage risk. Protect capital.
BTC accumulates and recovers.BTC Market Analysis (Short–Mid Term Outlook)
BTC is currently trading around 68,696, moving inside a contracting triangle structure after a strong corrective phase. Here’s the breakdown:
1️⃣ Overall Trend Context
• The higher timeframe trend remains bearish (price below the 200 MA – black line).
• The red MA is acting as dynamic resistance.
• Market structure shows a series of lower highs from the 84K–86K area.
2️⃣ Current Structure
• Price formed a strong V-shaped recovery from the 60K zone.
• Now BTC is compressing between:
• Ascending support trendline (around 66,000 – 66,500 demand zone).
• Descending resistance trendline.
This creates a triangle breakout setup.
3️⃣ Key Levels
• 66,084 → Major short-term demand. If broken, downside may extend toward 64K–62K.
• 71,864 → Mid resistance (liquidity + previous structure high).
• 77,326 → Strong supply zone / higher timeframe resistance.
4️⃣ Bullish Scenario 📈
If BTC holds above 66K and breaks above the descending trendline + 72K resistance:
• Momentum could push price toward 77K supply zone.
• A clean breakout with volume may shift structure to bullish continuation.
GOLD - Keep An Eye On This!Gold is currently unfolding an ABC correction on the higher timeframe.
Wave A completed with a clear impulsive move.
Price is now developing wave B, which is taking the form of a complex W-X-Y structure.
At this stage:
- Wave W has completed
- We are currently in wave X
- Expecting one more minor move lower before wave Y begins
The expectation is for wave Y to complete wave B near projected resistance, before the larger corrective sequence resumes.
Plan
- Allow wave X to finish
- Look for signs of reversal into wave Y
- Monitor completion of wave B for the next higher-timeframe move
This remains a corrective phase. Patience is key while the structure completes.
What do you guys think?
Goodluck and as always, trade safe!
Bottoms In?Good chance this correction is over and the bottom is in - many are expecting lower and they may be right (I see a scenario where 50k levels come but not rating it too likely here) - I have looked over counts and momentum divergence has confirmed what appears to be a truncated 5th (see diagram on chart if confused) - It don't feel like it but it's a very real possibility we have just started our first impulse move of the new Bull Cycle.
USDJPY 30Min Engaged ( Bearish & Bullish Entry Detected )⚡Base : Hanzo Trading Alpha Algorithm
The algorithm calculates volatility displacement vs liquidity recovery, identifying where probability meets imbalance.
It trades only where precision, volume, and manipulation intersect —only logic.
✈️ Technical Reasons
/ Direction — LONG / Reversal 152.515 Area
☄️Bullish momentum confirmed through strong candle body.
☄️Structure shifted with higher-low near key demand base.
☄️Volume expanding confirms order-flow alignment upward.
☄️Buyers reclaimed imbalance with sustained clean break.
☄️Algorithm detects rising momentum under low liquidity.
✈️ Technical Reasons
/ Direction — SHORT / Reversal 153.350 Area
☄️Bearish rejection confirmed through sharp candle body.
☄️Lower-high forming beneath resistance supply region.
☄️Volume decreasing confirms exhaustion in price rally.
☄️Sellers regained imbalance with heavy top rejection.
☄️Algorithm detects fading demand and shift to control.
⚙️ Hanzo Alpha Trading Protocol
The Alpha Candle defines the day’s real control zone — the first battle of momentum.
From this origin, the Volume Window reveals where the next precision strike begins.
⚙️ Hanzo Volume Window / Map
Window tracked from 10:30 — mapping true market behavior.
POC alignment exposes institutional bias and breakout potential zones.
⚙️ Hanzo Delta Window / Pulse
Delta window monitors real buying vs. selling power behind each move.
Tracks volume aggression to expose who controls the candle — buyers or sellers.
When Delta aligns with Volume Map, momentum becomes undeniable.
Update — #Silver / $SLV I still expect a move toward $100 in thUpdate — #Silver / AMEX:SLV
I still expect a move toward $100 in the coming weeks.
Round numbers often act as magnets. Trading purely off psychological levels isn’t enough on its own — but when a major round number aligns with structure, it meaningfully increases probability.
As for the short term:
The bottom may already be in.
However, I wouldn’t rule out one more flush lower before the next leg higher begins.
Either way, the bigger picture remains constructive while price holds structure.
$HBARUSDT Chart Analysis (4H Timeframe)The chart shows BINANCE:HBARUSDT forming a bullish continuation setup after a strong breakout, with price now retesting a key demand zone for potential upward expansion.
📊 Market Structure
Price recently broke above a consolidation range with strong bullish momentum.
The breakout created a Fair Value Gap (FVG) + buying breaker block at $0.09887 – $0.09712, acting as a key demand zone.
Current price action suggests a pullback into support before the next bullish move.
🟢 Key Support (Demand Zone)
$0.09887 – $0.09712 → FVG + breaker block support.
Buyers expected to defend this zone.
Holding above this area keeps bullish structure intact.
⚡ Trade Bias: Bullish Continuation Setup
Entry Area: ~$0.09891 (buy on pullback confirmation)
Stop Loss: ~$0.09590 (below demand zone invalidation)
🎯 Upside Targets
Target 1: $0.10450 → Immediate resistance level.
Target 2: $0.11090 → Major supply / next liquidity zone.
📈 Technical Outlook
Strong impulsive breakout shows increasing buying pressure.
Demand zone retest supports continuation probability.
Higher lows formation signals strengthening bullish trend.
✅ Summary: BINANCE:HBARUSDT remains bullish while holding above the $0.097 support zone. A successful retest could push price toward $0.104 and $0.111 levels. Breakdown below $0.0959 would invalidate the bullish setup.
XAUUSD: Range Holding Strong - Upside Expansion PossibleHello everyone, here is my breakdown of the current XAUUSD setup.
Market Analysis
XAUUSD previously experienced a strong bearish impulse, breaking decisively below a key support area and triggering an acceleration to the downside. This sell-off marked a clear loss of bullish control and led to a deep corrective phase. After forming a local bottom, price began to recover and transitioned into a consolidation phase, signaling a slowdown in selling pressure. During this recovery, Gold started forming higher lows while respecting a rising triangle support line, indicating that buyers were gradually stepping back into the market. As price continued to stabilize, XAUUSD broke above the descending triangle resistance line, confirming a short-term structural shift in favor of buyers. Following this breakout, price entered a well-defined range above the support zone, showing acceptance above demand rather than an immediate rejection. Multiple breakout and retest behaviors around the support area suggest that buyers are actively defending this level. The market is now compressing within this range, reflecting absorption of supply and preparation for a potential directional move.
Currently, XAUUSD is trading above the key support zone around 5,040–5,060, while holding structure above the rising triangle support line. Price action remains constructive, with recent pullbacks appearing corrective rather than impulsive. This behavior suggests that bearish attempts are being absorbed, and buyers maintain short-term control as long as price stays above support.
My Scenario & Strategy
My primary scenario favors a bullish continuation, provided XAUUSD continues to hold above the 5,040 support zone and respects the ascending triangle support line. Consolidation above demand indicates accumulation rather than distribution. A confirmed breakout and acceptance above the current range would open the path toward the 5,180 resistance zone (TP1), which aligns with a major resistance and previous supply area. This level is expected to attract selling pressure, making it a key upside objective.
However, a decisive breakdown and acceptance below the support zone and triangle support line would invalidate the bullish scenario and signal a return of bearish pressure, potentially leading to a deeper corrective move. Until that happens, market structure and price behavior continue to favor buyers.
That’s the setup I’m tracking. Thank you for your attention, and always manage your risk.
BTC: Holds $70K, but the trend is weakAfter a brutal sell-off during the past few weeks, BTC spent one relatively quiet week, with a major movement during the Fridays inflation data and Saturdays trading session. The lowest weekly level was at $65,5K, after which BTC tried to regain higher levels, closing the week around the $70K for one more time. It is important to note that the risk-off mode is still active on financial markets, including the US equity market, in which sense, time for higher grounds might still not be right for BTC.
The RSI continues to chop in the oversold area of charts. The end of the week brought a slight increase in the indicator to the level of 34, but it was quite a weak move, so it could be concluded that BTC is still in the oversold territory. Both MA50 and MA200 are moving as two parallel lines with a downtrend, without a clear indication that the potential cross is coming in the near term.
Charts are still not clearly pointing to the recovery of BTC. It is currently in some sort of status-quo mood. There are some indications that the price could go higher from the $70K, where the level of $80K is the first level. However, there is no indication that the price could go significantly higher from the range of $80K-$85K. A move toward the downside is also possible. At this moment, a potential drop in price could lead to levels between $65K to $60K. At this moment, there are no clear signs of the potential price moves with higher level of probability.
Bitcoin Daily Market Analysis📊 Bitcoin Daily Market Analysis
Today's core Bitcoin price action is characterized by "weak consolidation," with neither bulls nor bears showing strong momentum.
It's highly likely to remain within the $67,500-$69,500 range, with a low probability of extreme price action.
⚖️ The core trading strategy should focus on "buying low and selling high within this range," with strict position sizing and stop-loss orders.
⚠️ Avoid blindly chasing highs and lows; wait for clear confirmation signals before considering breakouts to avoid falling into false breakout traps.
🚀 Bitcoin Trading Strategy
🟢 BUY:67500-68500
🎯 TP: 69500-70500
AUDJPY BuysIn recent weeks, we’ve seen sustained JPY weakness, with a clear directional trend and repetitive structural behavior across multiple pairs.
In this specific case, AUDJPY has consistently respected a pattern: each impulsive leg higher is followed by a pullback, with the daily 20 EMA acting as the key dynamic support on the retest.
At the moment, price is trading directly on that moving average. Dropping down to the 4H timeframe, we can clearly identify a solid bullish structure, with price reacting after sweeping a significant liquidity level.
From here, the higher-probability scenario would be a continuation to the upside, with price aiming to print a new high and maintain the prevailing bullish structure.

