GBPCAD on the Rise.GBPCAD should be rising this week and potentially getting up to the RESISTANCE zone or close to it this month.
Trend Lines

ATH_LTFHi traders,
Currently LTF is trading @ ATH with breakout of strong Bullish Candle.
Long until it breaks previous day low or Market structure and Ride the Trend.

BTC/USDT: Bearish Bias Holds Below 116K as Price ConsolidatesBTC/USDT is trading within a broad descending structure, having rejected the 116K resistance zone. Price continues to form lower highs, respecting the downward trendline while consolidating below 110K.
If this zone holds, a short-term rebound toward 110K is possible before selling pressure resumes. Momentum remains bearish, with downside targets near the 102K–95K support zone.
❗️ Risks:
– Strong U.S. economic data could spark volatility.
– Renewed ETF inflows may boost spot demand.
– Holding above 110K would weaken the bearish case.

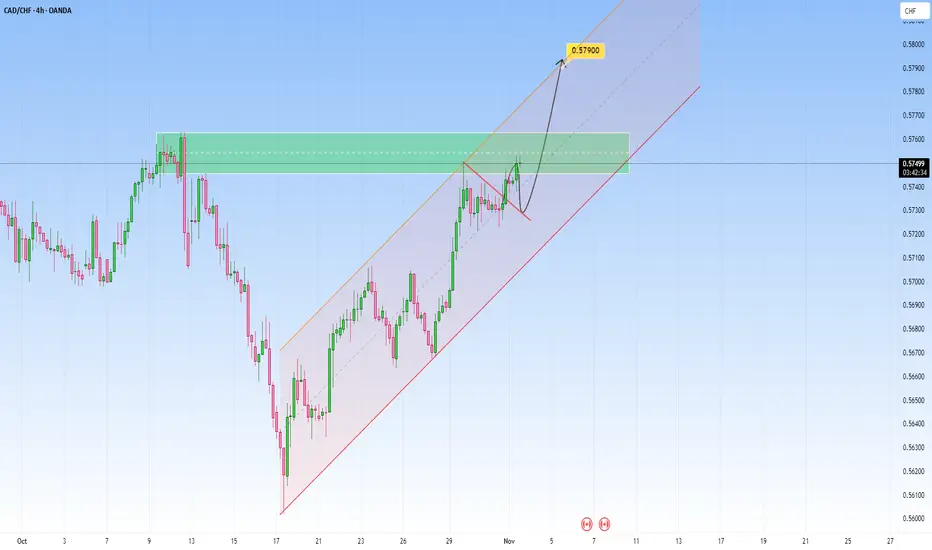
CADCHF Channel Rise in Motion: Buyers Target 0.5790CadChf price has been moving cleanly inside this rising channel, showing strong bullish structure with consistent higher highs and higher lows.
Buyers are now testing the resistance zone and momentum remains in their favor.
I expect a continuation toward 0.57900, the next projected level near the top of the channel.
As long as the structure holds above the midline of the channel, buyers remain in control, driving the next leg of the uptrend.
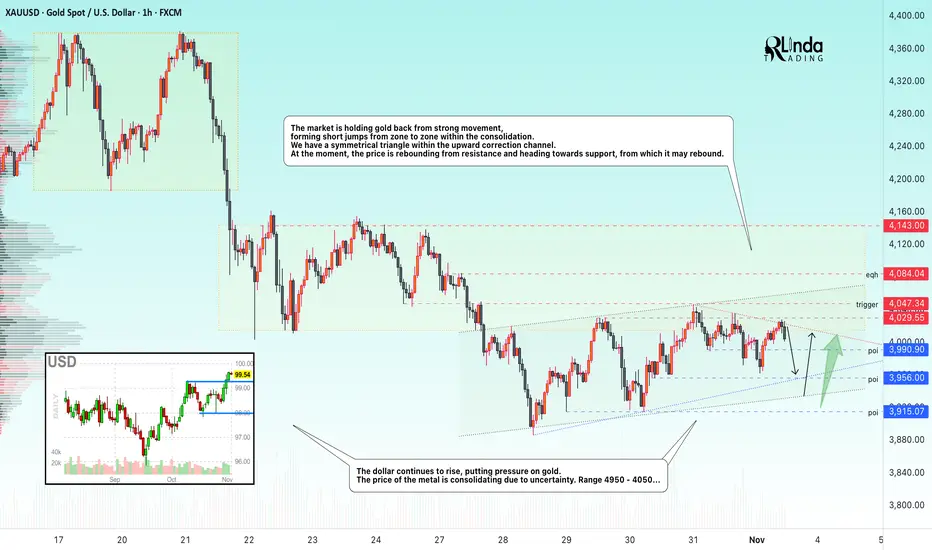
GOLD → Consolidation within a symmetrical triangle The market is holding gold back from strong movement, forming short jumps from zone to zone within consolidation. We have a symmetrical triangle within an upward correction channel.
Key supporting factors:
The US shutdown is becoming the longest in history, increasing economic risks.
China is canceling tax breaks for retailers. Trump may announce new tariffs related to China.
ISM Manufacturing PMI data (US) is ahead - a rare indicator during the shutdown.
The probability of a Fed rate cut in December has fallen to 69% (from 91.7% a week ago).
Technically, consolidation may continue until the price breaks one of the boundaries of the symmetrical triangle.
Support levels: 3990, 3956, 3915
Resistance levels: 4030, 4047, 4085
Traders are uncertain about the future direction, and as a result, the market is consolidating. There are limit levels both below and above that are holding back movement. Accordingly, until there is a clear fundamental background, it is possible to focus on trading within the channel. I expect a rebound from 3960 for a retest of resistance. However, a close above 4030 could trigger growth, while a close below 3956 would confirm the weakness of the market and trigger a fall to 3900.
Best regards, R. Linda!
GOLD (XAU/USD): Bulls Eye $4,125 – Breakout Imminent?Gold dropped to a significant horizontal support level last week.
The price subsequently rebounded from this level, forming a rising triangle pattern on a 4-hour timeframe.
The neckline of this triangle is defined by an intraday horizontal resistance.
Its bullish violation (4H candle close above) can be a nice trigger to buy Gold with a confirmation.
Should this occur, a bullish continuation towards 4125 would be anticipated.
Conversely, a bearish movement and a break below the vertical support level could potentially lead to a further decline in price.

EUR AUD In trading range. Buying at the bottomRR 1:4
Risking 100 pips for 400 pips
adding the the winner if 100 pip profit is made, where I would move up the stop loss.

EURGBP → Breaking through resistance provokes distribution FX:EURGBP is updating its high as part of a rally triggered by a breakout of consolidation resistance amid a bullish trend
The currency pair is in a phase of a confident uptrend (D1), with consolidation forming in the form of a bullish pattern, which generally indicates the strength of the buyer.
After breaking through the resistance of the “ascending triangle” consolidation, the currency pair is updating its high to 0.8818 and forming a double top, which is provoking a correction. Before rising, the price may test support.
Resistance levels: 0.8786, 0.8818
Support levels: 0.8752, 0.8721
The correction may bring the price to the break-even zone (breakout area). Liquidity capture will shift the imbalance towards buyers, which may trigger a continuation of the upward movement.
Best regards, R. Linda!

LINKUSDT → A trap? Grabbing liquidity before the fall...BINANCE:LINKUSDT is forming a correction after a bearish run. A false breakdown of support is triggering a correction before a possible continuation of the decline.
The coin is testing the support of the trading range within the downtrend. The reaction to the false breakdown of support is a pullback to the zone of interest. After a strong downward distribution, a correction to the break-even zone is forming. A false breakout of resistance at 17.45 could trigger a continuation of the decline due to a weak market and a liquidity pool formed above 17.450, which is likely to stop the pullback on the bearish trend.
Resistance levels: 17.450
Support levels: 16.53, 15.77
The downtrend may continue. A retest of resistance may end in a fall and an update of the local minimum, as well as reaching the zone of interest at 15.77.
Best regards, R. Linda!

Gold Breakout and Potential RetraceHey Traders, in today's trading session we are monitoring XAUUSD for a selling opportunity around 4,060 zone, Gold was trading in an uptrend and successfully managed to break it out. Currently is in a correction phase in which it is approaching the retrace area at 4,060 support and resistance area.
Trade safe, Joe.

DXY Analysis — Bulls at 100: Continuation or Correction?In my latest DXY analyses, I mentioned that the index could reverse and push higher, with the 100 figure acting as a key zone to watch for bulls.
Indeed, on Friday the index climbed right into this area and is now showing signs of minor consolidation.
The key question now:
👉 Will the DXY manage to continue above this critical level, or is it time for a pause?
In my view, a correction is looming for the index. Even if we see a short-term spike above 100, I expect it to be unsustainable.
For the near future, DXY could remain in a range-trading environment, with 100 as resistance and 97.50 as support.

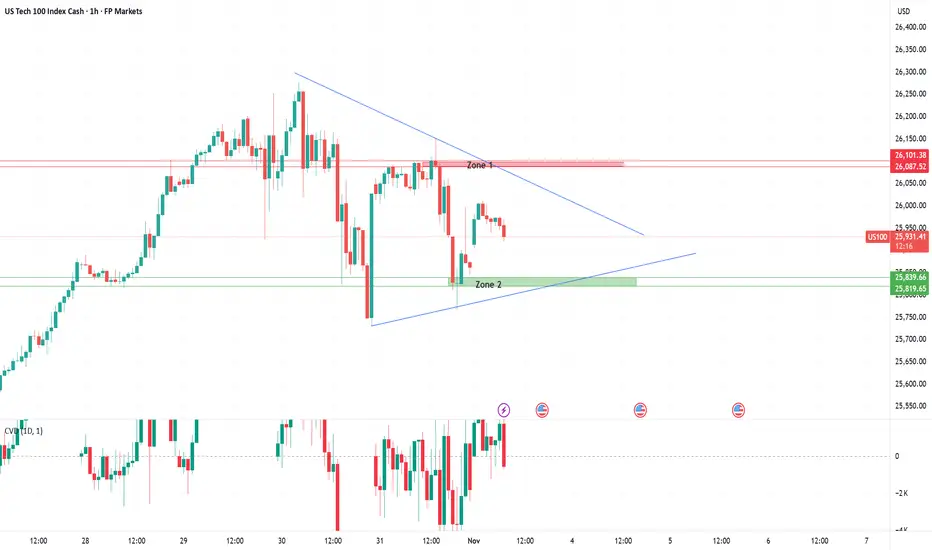
US100 – Key levels in focusUS100 – 1H Technical Zone Analysis
Zone 1: Friday’s High
This zone marks Friday’s high and the upper boundary of the current consolidation structure. It represents the point where bullish momentum paused before the weekend, and now acts as immediate resistance. A clean break and hold above Zone 1 would confirm renewed buyer strength and could open the path toward fresh all-time highs. Until then, traders are likely to view this level as a short-term decision point for directional bias.
Zone 2: Friday’s Low
This zone defines Friday’s session low — the level where buyers regained control and pushed price higher into the weekly close. It now serves as key intraday support and aligns closely with the ascending trendline structure. Holding above Zone 2 keeps market sentiment constructive and suggests that buyers remain in control of short-term direction. A clean break below would signal fading momentum and could invite a deeper pullback toward 25,700–25,750.
Market Recap – US100 Overview
The US100 closed last week on a strong note, extending its rally to fresh all-time highs as optimism spread across global markets. Sentiment was fueled by renewed progress in U.S.–China trade negotiations, with reports suggesting a potential framework deal and discussions over easing tariffs on rare-earth materials and agricultural goods. This reduced geopolitical risk and boosted risk appetite across equities.
Tech and AI-related stocks once again led the charge, highlighted by NVIDIA reaching a record $5 trillion valuation, reinforcing the dominance of the growth and semiconductor sectors. The Federal Reserve maintained a cautious stance, signalling that rate cuts are not guaranteed, but investors largely shrugged off policy uncertainty amid the ongoing government data blackout.
Overall, the tone was constructively bullish: optimism on trade and strong tech momentum outweighed concerns about stretched valuations and limited macro visibility. Heading into the new week, traders remain focused on whether the rally can hold as markets navigate high levels, thin data, and potential volatility from fresh headlines.
EURNZD: sellers remain in control - upside still rejectedEURNZD confirmed weakness above resistance once again. Breakout attempt failed, price returned below supply and trend line. Every bullish push is absorbed, indicating sellers still dominate. H4 structure stays bearish: failed breakout followed by BOS down, weak buyer on retest.
FVG above and supply zone remain untouched, acting as liquidity cap. Lack of momentum up and return into range support continuation toward 2.0050 and then 1.9750, where previous accumulation and liquidity cluster sit.
Plan: look for shorts on pullback into FVG with weak orderflow, targets 2.0050 and 1.9750. Bullish scenario only above 2.0230 with strong momentum and follow-through — then buy pullback toward 2.0400.
When market teases breakout but every rally dies instantly — trend continuation is still in play. Confirmation first, assumptions later.

Part 2 Support and Resistance Key Terms in Option Trading
Before diving deeper, it’s important to understand some key terms:
Underlying Asset: The financial asset on which the option is based (e.g., Nifty, Bank Nifty, Reliance Industries stock).
Strike Price: The fixed price at which the holder can buy or sell the underlying asset.
Expiry Date: The date when the option contract expires.
Premium: The price paid by the buyer to the seller (writer) of the option.
Lot Size: The minimum quantity of the underlying asset in one option contract.
In-the-Money (ITM): When exercising the option is profitable.
Out-of-the-Money (OTM): When exercising the option is not profitable.
At-the-Money (ATM): When the strike price is equal (or close) to the current market price of the underlying asset.

XAU/USD: Bullish Structure Under Threat as Correction DeepensXAU/USD has entered a corrective phase following its explosive October rally, which printed a historic monthly candle and pushed gold into overbought territory. What once appeared as unstoppable bullish momentum is now showing clear signs of exhaustion, with price rapidly falling back toward the $4,000 psychological support.
On the 4H chart, price is in the final leg of an aggressive A-B-C correction, and a break below $3,850 would be critical — potentially collapsing the bullish structure and opening downside targets at $3,700 and $3,600, aligning with prior support zones and the lower boundary of the long-term upward channel.
While the monthly chart confirms the broader uptrend, the vertical spike followed by a pinbar-style candle hints at a possible exhaustion top. The rally may have overextended, and current consolidation under pressure suggests a shift in sentiment.
At this stage, gold is not trending higher — it’s fighting to hold structure. The bias shifts to "sell the rips", with dip buying only valid if the technical foundation remains intact. The path of least resistance now leans downward, and confirmation is key before taking directional positions.

USDJPY: Prepare to shortI believe that USDJPY may be reaching a tipping point. We are likely going to see just one small minor wave up to complete a 5-wave structure before it turns down for the longer term structure.

GOLD (XAUUSD) | Key Reaction Zone Ahead – 0.5–0.618 FIB Gold is trading near a critical retracement zone (0.5–0.618 FIB) with price consolidating below the previous day’s high ($4046).
Smart money may look to induce liquidity above $4031, then reverse to target the previous day low ($3972) if rejection confirms.
Trade Idea:
Watch Zone: $4006–$4031 (reaction / rejection area)
Bearish Scenario: Liquidity grab above $4031 → Break of structure → Sell continuation
Bullish Scenario: Strong close above $4046 → Next liquidity target $4065+
Bias: Neutral-to-bearish unless $4046 is broken with volume
Key Levels:
Resistance: $4046 (PDH zone)
Support: $3972 (PDL)

Gold Congestion: Clear Levels, Unclear DirectionAfter forming a local low at 3887 last week — a level perfectly aligned with the October ATH area — OANDA:XAUUSD started to recover from the recent 5k pips decline, retesting the 4050 resistance zone, which previously acted as strong support.
Since mid-last week, price action has entered a consolidation phase. Despite high intraday volatility, the structure is beginning to compress into a clear congestion pattern.
This range, roughly 1k pips wide, provides traders with well-defined reference points:
- Support: 3950–3960 zone – a break below this area would likely reopen the path toward the recent 3887 low.
- Resistance: 4040–4050 zone – a confirmed breakout above could trigger a continuation toward 4150.
At this stage, I am slightly bullish, given the sharp rejections from 3920 last week and the emerging ascending triangle structure, which often precedes upward continuation.
Still, confirmation is required — the market must decide whether this congestion is accumulation or distribution.


Vetusdt buy opportunityVetusdt completed wave 2 correction and price preparing for the big wave 3 move with the potential leading structure, the plan is to accumulate fromt the provided zone and hold for the setup targets.

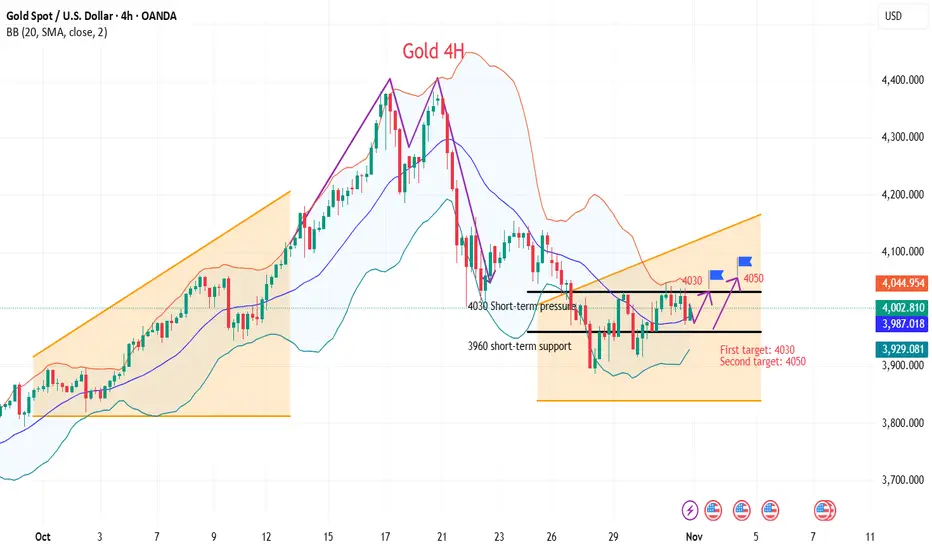
Gold Trading Strategy for Monday
News:
Gold (XAU/USD) remained under pressure this week, falling below $4,000 at one point and hitting its lowest level since early October, influenced by Federal Reserve Chairman Jerome Powell's cautious remarks and easing US-China trade tensions.
Considering all factors, future US economic data and speeches by Federal Reserve officials will be key catalysts in determining the direction of gold prices.
Specifically:
From the 4-hour chart, the current short-term resistance level to watch is 4035-4030, with a key resistance level at 4055. Short-term support is around 3960. The overall trend remains upward, so the recommended strategy is to buy on dips and patiently wait for key entry points.
Specific trading strategies will be provided in the channel; please pay attention.
I believe the overall market will maintain a period of fluctuation before continuing its upward trend. Judging from the current market situation, the bottom has been established, but the upward trend has not yet started. In particular, the repeated fluctuations and shakeouts on Friday have added more uncertainty to the market.
This is mainly because market sentiment is currently quite divided. The US-China trade tariff issue is in a tug-of-war, and the Russia-Ukraine situation has begun to ease, but these remain unresolved issues. Although bullish momentum has slowed, it's not enough to reverse the bull market trend. The more important factors are US Treasury bonds, the Fed's interest rate cuts, and the cessation of balance sheet locking.
Therefore, after a short period of tug-of-war between bulls and bears, the market will likely rise again later.
Trading strategy:
Buy:3980-3975, SL: 3960, TP: 4000-4030-4060
Mapping the Next Possible Move | Key Breakout and Demand ZonesGold (XAUUSD) is currently consolidating between key structural zones, showing a balanced tug-of-war between buyers and sellers. The 4025 area remains the short-term resistance to watch — a clean break and close above this level could confirm bullish continuation toward 4075 and the major supply zone around 4150.
On the other hand, failure to sustain above 4025 may trigger a short-term pullback. The 3925–3960 zone has acted as a strong demand area where buyers have consistently stepped in, making it a crucial support for potential bullish rejections and trend continuation.
At this stage, the next possible move will likely depend on how price reacts around these two major zones:
Bullish scenario: Break and retest above 4025 → potential rally toward 4150.
Bearish scenario: Rejection at 4025 → possible correction toward 3925 demand.
Overall sentiment remains neutral-to-bullish as long as price holds above the demand area. Watching for a confirmed breakout or clear rejection structure before taking directional trades is key.

Parallel Channel Observation H1XAUUSD GOLD Update H1 Timeframe 🙌
- This Analysis is based on educational purposes using Technical aspect Parallel Channel 🔋
- Parallel Channel indications for a good bullish opportunities point from 📈
Targets would be at 4026 - 4047 - 4082.00 ✅️
Note : if Channel breaks this idea will be in Invalid ❗️
All you need to stick with one Mentor with Discipline Consistency and Focus Mindset 💯
#XAUUSD
