DOLLAR INDEX (DXY): Confirmed Bullish ContinuationThe DOLLAR INDEX appears to be showing bullish tendencies from both daily and intraday perspectives.
From a daily timeframe, I observe a confirmed breakout of a resistance line within a symmetrical triangle pattern, indicating a trend violation and continuation.
On an hourly timeframe, we see a breakout of a resistance line of a bullish flag pattern, followed by a strong bullish movement.
I anticipate that the market will continue to grow.
The next resistance level is identified at 99.53.
Trend Lines

EURUSD Bulls Eye 1.16050 for Fresh BounceHey Traders, in today’s trading session we are monitoring EURUSD for a potential buying opportunity around the 1.16050 zone.
The pair remains in a broader uptrend and is currently in a correction phase, approaching a key support and resistance area at 1.16050.
Structurally, EURUSD has been forming higher highs and higher lows, suggesting that the current retracement could offer another continuation setup within the bullish leg.
Next move: Watching how price reacts near 1.16050 — if bullish momentum builds from this area, we could see a renewed push toward recent highs.

Gold: Trending downwards, 3980 is key.#XAUUSD TVC:GOLD OANDA:XAUUSD
In the short term, gold is still digesting the hawkish impact of Powell's speech, and selling pressure remains heavy.
From a technical perspective, yesterday's daily candlestick closed with a long upper shadow. The 4030 level has proven to be a strong resistance level for gold prices, while the daily MA5 moving average has continued to cross below the MA10 moving average, making 3980-3990 a key short-term resistance level. Only by breaking through this key resistance range can gold prices potentially test higher levels further. Otherwise, the market will remain in a weak and volatile state in the short term.
On the support side, pay close attention to the double bottom support level formed on the hourly chart at 3920-3915.
If this range is breached, gold prices may experience an accelerated decline, further testing 3880 or even 3850.
Therefore, in the short term, European trading can try to short gold with a small position when the price rebounds to 3980-3990. The first target can be 3960-3950, and if the price falls sharply, the next target is 3920-3915.

BCHUSDT → Consolidation ahead of news. Target 600?BINANCE:BCHUSDT.P is consolidating above key resistance. Consolidation is forming ahead of news. Are the bulls in play?
Bitcoin is consolidating, trading above key support at 111650. News ahead, a positive outcome could support the market, including altcoins...
As for BCHUSDT, the coin is breaking through the strong resistance zone of 549.15 as part of a bullish trend and is forming consolidation in the range of 549-570. A liquidity pool has formed below 549. There is a high probability of a long squeeze before growth.
Resistance levels: 570, 600, 612
Support levels: 549.15, 533, 511.25
The market is bullish, which is clearly visible on the D1 timeframe. After a strong rally, the coin is entering a consolidation phase, which is forming above the previously broken resistance. A retest of support could trigger growth in the direction of the trend.
Best regards, R. Linda!

USD/CHF: Wait For BreakoutHere is a detailed trading plan for ⚠️USDCHF for the remainder of the week.
The market is currently testing a significant daily/intraday horizontal support level.
A bullish confirmation would be indicated by a bullish breakout of the resistance line of a falling wedge pattern on an hourly timeframe.
An hourly candle closing above this trend line would provide a strong bullish signal.
Following this, a bullish continuation would be anticipated towards the 0.8020 level.

USDCAD falling!USDCAD struggling to stay up.High probability of it falling down. Let's see if the news changes the outcome.

Breakout in VAIBHAV GLOBALBreakout in VAIBHAV GLOBAL.
Entry - 239
Target - 265
SL - 228
DISCLAIMER: I am not SEBI registered and the ideas posted are only for educational purpose. Do a proper analysis and always trade with STOP LOSS.

2 key zones to watch out for!We could either fill CME gap soon & head higher to fill golden pocket or hit golden pocket levels 117.3-118K & then sweep the lows where VWAP, VAL & golden pocket of recent lows aligns at 108-109K!
This more or less aligns with wyckoff (yellow bars)

GBPJPY BuyGBPJPY did a LG off the low from major intraday structure(4H) and micro structure is bullish reacting off a POI.

ANET - Rebounds from EMA 50ANET - CURRENT PRICE : 148.00 - 149.00
Technical Rationale:
1. Rebound from Key Moving Average Support
The stock price has rebounded strongly from the 50-day EMA, which has acted as a dynamic support level throughout the uptrend. This rebound indicates renewed buying interest at a technically significant area.
2. Bullish Momentum Confirmation
ANET has crossed above the 20-day SMA, suggesting a short-term shift back to bullish momentum after a healthy pullback. This crossover reflects improving short-term trend strength.
3. Rising Support Line Intact
The long-term rising support trendline remains intact, confirming that the broader uptrend structure is well-maintained. Each corrective phase has so far been supported near this line, reinforcing the bullish bias.
4. Momentum Indicator (RSI)
The RSI is recovering from the mid-zone (~53), showing that bullish momentum is building again without being overbought. This supports the potential for further upside continuation.
ENTRY PRICE : 148.00 - 149.00
FIRST TARGET : 162.00
SECOND TARGET : 173.00
SUPPORT : 136.00

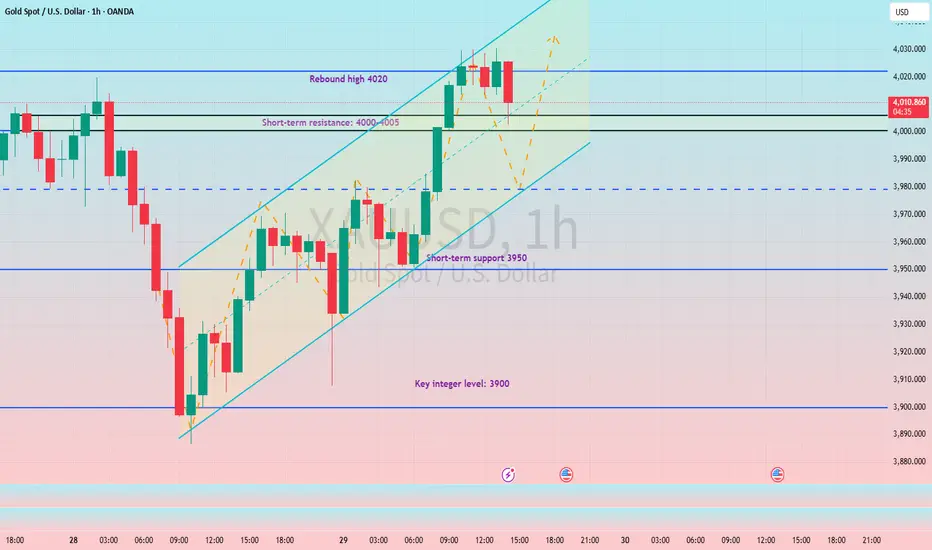
Watch for support at 3990-3980 to consider going long on gold.#XAUUSD TVC:GOLD OANDA:XAUUSD
Gold prices have repeatedly tested the 4030 level without a successful breakout. Gold has now begun to decline, with short-term bears gradually releasing their momentum. Further downside is expected, with support expected in the 3990-3980 range. If gold prices can pull back to this range in the short term, we can consider going long on gold in anticipation of a rebound. Target range: 4030-4050

Nasdaq Computer sector & Nasdaq nearing pullback areaNasdaq Computer (IXCO) Is nearing pullback territory (23,717 resistance). IXCO being the largest sector in Nasdaq (IXIC) means the composite index, now that it's over previous resistance, is also looking for a pullback into support (20,160).
It's possible IXCO will break resistance next year and if that happens whatever gains are made will be lost on an eventual drop back into support.
If you have call options on NVDA or other tech companies closing them when IXCO hits 23,717 is highly advisable. If it hits there around this January it could be 2 years before IXCO resumes the uptrend past 23,717. Calls will likely get destroyed during this time.
Another note is lots of tech IPOs are occurring this year with lofty valuations. When this IXCO pullback comes they are likely to get hit hard. It's a great opportunity to short or wait to buy up the ones you like when the pullback is over.
As always good luck and try your best to avoid getting into new tech related trades as this year ends. It's going to be a great idea to have cash ready next year.

Strategic positioning ahead of the Fed decision
News:
The Federal Reserve's interest rate decision is poised to trigger significant market volatility today.
Gold prices remain bearish after three consecutive days of declines. The Fed will announce its monetary policy decision on Wednesday.
This week's expectations for the Fed meeting focus on two points: a 25 basis point rate cut, and, given the growing disagreement among policymakers regarding the future path of interest rates, Powell is unlikely to provide any clear guidance.
Powell hinted earlier this month that the FOMC will continue to focus on threats to the labor market. Last week's weaker-than-expected inflation report may temporarily dampen hawkish rhetoric within the Fed regarding inflation.
Due to the US government shutdown, Fed officials have been unable to obtain complete data on the labor market since early September.
Specifically:
Gold prices have fallen below $4,000/oz. In the coming weeks, gold prices may fall further towards the $3,850-$3,800/oz range. Unless a strong rebound occurs, the short-term outlook remains bearish.
Looking at the 4-hour chart, gold prices previously fell along a descending slope from a high of $4,155, reaching a low of $3,886 before forming a V-shaped rebound. During this rebound, Fibonacci retracement levels formed a clear "stepped resistance-support" pattern.
If inflation subsequently rises, or the labor market tightens again, causing the market to downgrade the consensus from "two rate cuts this year" to "one," the dollar and long-term interest rates will rise, and gold will return to below the upper edge of the descending channel. The consolidation phase, where time is used to create space, will be prolonged, and the $4,050-$4,090 range will evolve into a "strong resistance box," with multiple attempts to break through it failing to hold.
Trading strategy:
Buy: 4025-4035, SL: 4050, TP: 3920-3880-3820
If the price of gold does not retrace to the target level before the speech, then a short position can be established at the current price.

Gold Bullish reversal 4h | Story Description
Last week, everyone was talking about how Gold was done.
Charts were bleeding, candles were red, and social feeds were full of bearish calls.
It looked like the market had completely switched sides — but deep down, it was just another correction.
I kept watching the chart patiently… price was moving inside a downward channel for days — nothing but slow pressure.
But guess what? Today, that story flipped.
Gold finally broke above the channel, showing signs that buyers are stepping back in control.
The correction seems to be over, and the market is trying to breathe again.
Right now, as long as price holds above 3970, I believe bulls can push toward 4040, maybe even 4160 in the next leg.
Sometimes, trading isn’t about catching every move — it’s about understanding when the storm is ending.
That’s where patience pays off.
Let’s see if buyers can keep control this time.
⚠️ For educational purpose only — not financial advice.

1:2 Risk Reward Buying USD CAD in bull channelSimple trade, buying USDCAD in bull channel at bottom of bull channel with RR of 2

Bitcoin Buy signal now near 111K lowWe are approaching a significant fundamental event—the release of key news—which introduces a high degree of short-term volatility risk. This event could trigger a sharp, downward price spike that may hit our stop-loss levels.
However, our technical analysis is currently generating a high-probability buy signal, independent of the upcoming news. The chart structure suggests substantial upside potential is developing.
Therefore, we are executing a calculated contrarian trade based on the technical setup. We are entering a long position here with a tightly defined stop-loss to strictly manage the elevated event-driven risk. The trade is structured to capitalize on the significant technical upside potential, offering a favorable risk-to-reward ratio should the bullish technical outcome materialize after the initial volatility subsides.
DISCLAIMER: ((trade based on your own decision))
<<press like👍 if you enjoy💚

SLP LAST CALLS for that +800% pump After a prolonged and exhaustive bear market characterized by deep, consistent monthly declines, NASDAQ:SLP is now trading at a level we identify as a historical price floor. Such severe and sustained downtrends often culminate in a state of maximum investor capitulation, which typically precedes a major trend reversal.
The asset is now fundamentally positioned for a significant mean reversion. From a technical perspective, the risk-to-reward profile at this juncture is exceptionally compelling. A recovery of +800% from these levels is not merely speculative; it aligns with a classical measured move target derived from the scale of the prior downtrend and would represent a natural recalibration toward the asset's historical mean.
All technical indicators suggest that the conditions are ripe for a powerful bullish reversal. A breakout above the nearest significant resistance level would be the confirming signal that this new upward impulse has commenced.
DISCLAIMER: ((trade based on your own decision))
<<press like👍 if you enjoy💚

SHIB the dead coin soon again will pump hardSHIB has been undergoing a prolonged period of consolidation, characterized by low volatility and a notable absence of significant bullish momentum over recent months. Such phases of compression and quiet price action often occur after a prior trending period and typically precede a new directional move.
Technical analysis suggests this accumulation phase may be nearing its conclusion. We are now monitoring for a potential catalyst that could trigger a robust bullish impulse. The anticipated outcome of such a move would be a decisive breakout, likely manifested as a series of strong bullish candles, propelling the asset toward the predefined technical targets established on the chart.
DISCLAIMER: ((trade based on your own decision))
<<press like👍 if you enjoy💚

NVDA Wave Analysis – 29 October 2025- NVDA opened with the upward gap
- Likely to rise to resistance level 215.00
NVDA stock opened today with the sharp upward gap, which follows the earlier breakout of the resistance zone between the resistance levels 193.75 and 200.00.
The breakout of the these resistance levels accelerated the active impulse wave iii of the extended intermediate impulse sequence 5 from April
Given the overriding daily uptrend, NVDA can be expected to rise to the next resistance level 215.00 (target price for the completion of the active impulse wave iii).

Premier Energies Ltd – Trendline Breakout with Bull Snort SignalPremier Energies Ltd – Trendline Breakout with Bull Snort Signal
NSE:PREMIERENE
📈 Pattern & Setup:
Premier Energies has finally broken out of a long-term descending trendline that has capped its rallies since December 2024. The stock formed multiple shakeouts and higher pivot lows during its base construction, showing quiet accumulation beneath resistance.
A clear “Bull Snort” pattern appeared right before the breakout, confirming demand re-entry with strong momentum. Volume surged sharply during this breakout phase, validating institutional participation.
With the structure now flipping from distribution to accumulation, the setup points toward a potential 18–20% upside move from here.
📝 Trade Plan:
✍Entry: Above 1110 (confirmation candle after breakout)
🚩Stop-Loss: 1040 (below breakout base and recent pivot low)
🎯Targets:
Target 1 → 1200
Target 2 → 1290 (18–19% potential move)
💡 Pyramiding Strategy:
1. Enter 60% position on breakout above 1110
2. Add remaining 40% above 1140 once volume sustains higher than average
3. Trail stop-loss to 1080 after price holds above 1180
Keep Learning. Keep Earning.
Let’s grow together 📚🎯
🔴Disclaimer:
This analysis is for educational purposes only. Not a buy/sell recommendation. Please do your own research or consult your financial advisor before trading.

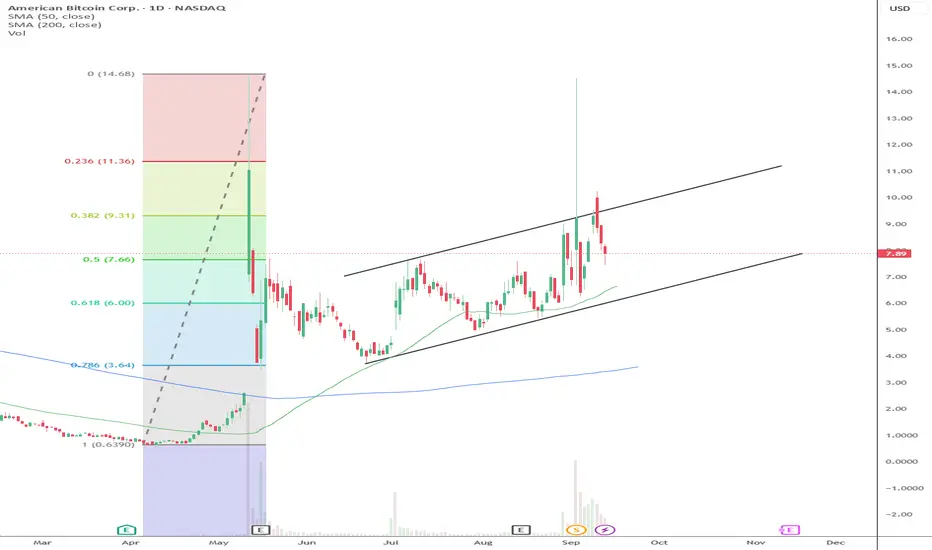
Too soon... Pump and Dump... Long Term Hold...ABTC has fluctuated highs and lows, where is the floor, how high can this go with time. I did buy under $7 and am going to hold for a while. My overall concensus is bullish simply due to my belief that Bitcoin will continually move higher and higher.
I have no timeframe on selling, this is more of a Buffet style, buy and hold forever.
I am not a trader and have no professional experience.
TATA POWERTata Power Company Ltd. (currently trading near ₹410.70) – Overview Tata Power, India’s largest integrated power company, operates across generation, transmission, distribution, and renewable energy. Headquartered in Mumbai, it has a diversified portfolio including thermal, hydro, solar, and wind assets. The company is rapidly transitioning toward green energy, EV charging infrastructure, and rooftop solar solutions, with operations spanning 13+ countries.
FY22–FY25 Snapshot
• Sales – ₹42,576 Cr → ₹56,033 Cr → ₹61,800 Cr → ₹68,500 Cr Growth driven by renewable capacity addition, distribution expansion, and solar EPC orders
• Net Profit – ₹2,156 Cr → ₹3,810 Cr → ₹4,450 Cr → ₹5,200 Cr Earnings supported by margin expansion, green energy mix, and scale efficiencies
• Operating Performance – Moderate → Strong → Strong → Very Strong EBITDA margins improving with renewable scale-up and digital grid management
• Dividend Yield (%) – 0.90% → 1.00% → 1.10% → 1.20% Consistent payouts; reinvestment into clean energy and EV infrastructure
• Equity Capital – ₹319.56 Cr (constant) No dilution; strong promoter backing via Tata Group
• Total Debt – ₹47,000 Cr → ₹44,500 Cr → ₹42,000 Cr → ₹39,000 Cr Gradual deleveraging supported by internal accruals and renewable monetization
• Fixed Assets – ₹58,000 Cr → ₹61,500 Cr → ₹65,000 Cr → ₹68,500 Cr Capex focused on solar parks, EV charging, and smart grid upgrades
Institutional Interest & Ownership Trends Promoter holding stands at ~46.86% (Tata Group), with no pledging. FIIs and DIIs have actively accumulated Tata Power citing its clean energy transition, distribution scale, and ESG alignment. Delivery volumes reflect long-term positioning by infra, ESG, and utility-focused funds.
Business Growth Verdict Tata Power is scaling across renewables, EV charging, and smart distribution networks Margins improving via green energy mix, digital grid, and EPC execution Debt is declining steadily with strong operating cash flows and asset-light models Capex supports long-term competitiveness in clean energy and urban electrification
Management Highlights • FY25 rooftop solar installations up 28% YoY; EV charging points crossed 6,000 nationwide • Distribution business expanded in Odisha and Mumbai; smart metering rollout accelerated • R&D spend at ₹300 Cr; new SKUs launched in solar inverters and battery storage • FY26 Outlook: 10–12% revenue growth, margin retention, PAT expected to cross ₹6,000 Cr
Final Investment Verdict Tata Power Company Ltd. offers a clean energy transformation story built on renewables, EV infrastructure, and smart distribution. Its improving profitability, disciplined capital structure, and ESG-aligned growth make it suitable for accumulation by investors seeking exposure to India’s energy transition and urban electrification. With strong execution, Tata Group backing, and green momentum, Tata Power remains a durable compounder in the large-cap utility space.
