BTC Lower highs - nose diving soonWe've seen this movie too many times. Lower highs, then crossing 50SMA / 200SMA down. We are an inch away from this happening. Never get sensitive about any of this! Follow the trend, technicals, and understand the f&ckery that is taking place. Every single time it drops, esp. when many of the people in crypto are just profit takers. Again, diminishing YoY returns, doesn't solve any real problems, high transaction cost, and still can't buy a banana with it. CBOE:MSTZ CBOE:UVIX are nice hedges and prob the only thing going up in a down market.
Best of luck and always do your DD!
Trend Lines

Mainly long and auxiliary short, the strategy remains unchangedPowell's speech did not have much impact on the market, but silver, also a precious metal, has hit a record high, so we need to be alert to the potential rise in gold in the US market. Long trading remains the main theme. Pay attention to the resistance of 4065-4080 on the top and the support of 4045-4030 on the bottom. Conservative traders should wait for a pullback to go long.

CLSK Breaking out!CLSK continues with momentum closing above the macro triangle upper boundary trend-line and now testing the last resistance before a breakout! This will coincide with a break above wave D and flip the macro structure bullish bringing in more capital!
Daily RSI is overbought with slight bearish divergence but can remain this way for weeks in a strong uptrend!

Copper continues to grow!The two price targets I envision on the chart, which indicate continued upward swings, are the powerful candles of the last two weeks that have made it easier to reach these targets in the medium term, and other than time, which requires more patience, I don't see any reason why we won't reach the desired target!

Canopy: LONGCanopy Market Cap: 400M
Risk Profile: Medium to High risk
Trading above the very important 21 Weekly MA
Broke the 200 daily MA just now at around 1.50
There is some overhead resistance (Red Striped Line) at 1.68
then previous top at 1.90
then, i expect to break it, going for the orange line at around 2.50
Last few days we have some nice pre market buying as well. Since August some nice uptick in volume as well!!
Think we can do a couple off X's from here.
Chart is 'cluttered' but important trend lines, Moving Averages and i drawn a cloud to test something.
Zoomed Out and less clutter:

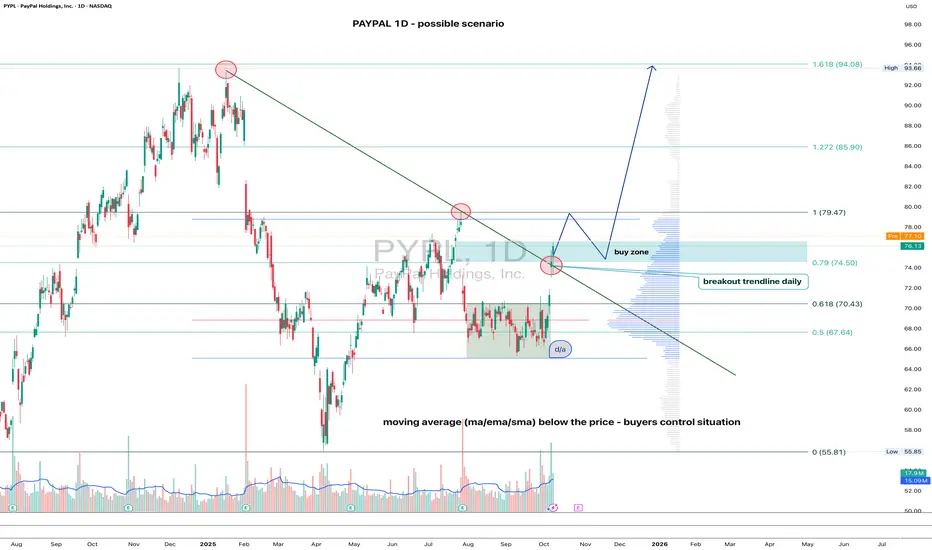
PAYPAL(PYPL) 1D - gaining traction On the daily chart, the price has confidently broken through the descending trendline — the first strong sign of a bullish shift.
All key moving averages (MA, EMA, SMA) sit below the price, showing that buyers are clearly in control.
Buy zone: 74.50.
A retest in this area (74.5–76) looks likely before another push higher.
First resistance: 79.47.
This level might trigger a short-term pullback, but a breakout above it opens the way toward targets at 85.90 and 94.00.
In short - the structure looks healthy, the breakout is done, and PayPal may be just warming up for a bigger move. Stay sharp - dips could be opportunities, not danger.
SILVER (XAG/USD): Bullish Rally ContinuesIt appears that 📈SILVER is expected to continue its upward trend, potentially reaching the 50.00 psychological level.
The observed break of structure on the 4-hour chart suggests a strong presence of buyers.
Given the lack of significant US news today, the market is anticipated to maintain a bullish sentiment.

XAUUSD SUPPORT, RESISTANCE & TRENDLINE ANALYSISGo for "LONG" if it breaks and sustains above 4044.13 and target till 4056.23 and if it breaks this level as well then we can plan for further upside move till 4060.00 & 4100.00.
Plan for "Short Term" "SHORT" position only if it breaks 4031.78 and further downwards till 4019.42 and if it breaks this as well then the next target could be 4007.07. Also, if it breaks breaks 3998.00 then plan for further downside with 3974.00 & 3960.00 as targets.
The breaking of trendline above or below shall also indicate the movement for short term.
NOTE: My overall personal view is Bullish.

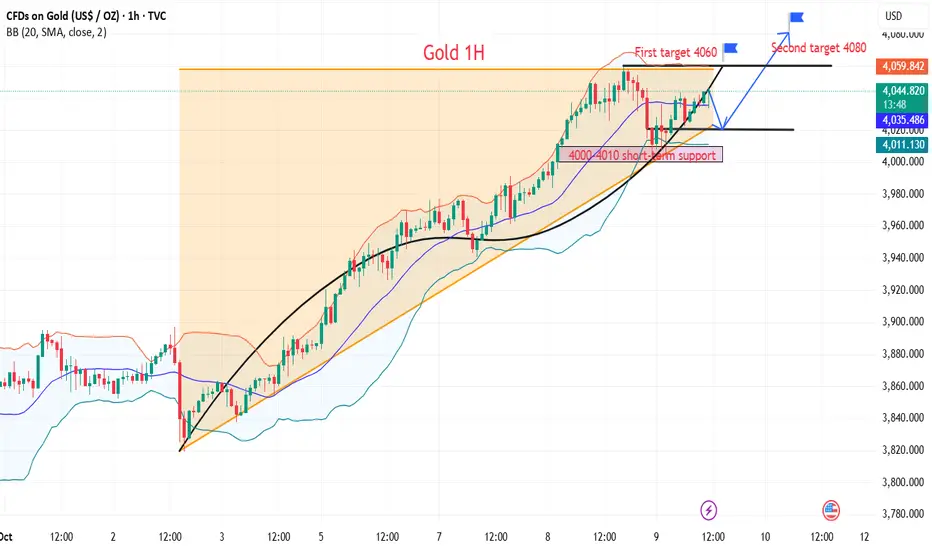
The short-term adjustment of gold is for a better rise
News:
During the Asia-Europe session on Wednesday, spot gold hit a bottom and rebounded. Affected by the ceasefire agreement signed by Hamas in Gaza, it fell nearly 1% during the session, and then rebounded sharply. It is currently down 0.07%, and its price is stable above the historical high of US$4,000 per ounce.
Gold smells a familiar smell of sweeping here, which is in line with our expectations. According to the signal strategy given yesterday, if the price reaches 4020-4025, enter the long position and you can make a profit now.
Specifically:
The bullish momentum has not been broken. The upper double-line support on the hourly chart, along with the channel line, serves as a defensive dividing line.
This rally, which began at 3280 in August, accelerated in September and doubled in October, with a nearly $780 surge, setting a new record and reshaping market perception.
The two closest waves, one at 3720 and the other at 3820, sought support for further gains.
The upper double-line support on the hourly chart is currently between 4000 and 4010, tentatively serving as the dividing line for any shifts in momentum. Holding the upper double-line support level will ensure the overall bullish momentum remains unchanged, and any short-term pullbacks and accelerations are intended to facilitate a stronger rally.
Strategy:
Long Position4020-4030,SL:4010,Target:4060,4080
XAUUSD; Continues To Surge Higher..XAUUSD have fulfilled our previous idea on reaching 4000 ATH, it have persistently keep mounting up. The risk of the U.S government closed down has also led investors and traders to move to gold as safe haven, contributing to the remarkable price increase. We might expect a slight retracement down to 4000-3950 as the next key support before a scale toward 4120 as possible highs remains intact.
Meanwhile XAUUSD resume its climb inside the uptrend region with a range of higher lows and higher highs, showing encouraged bullish momentum.
Like and follow up
Thanks as you share your opinion on this

#XAUUSD: Will There Be Major Price Correction On Gold? Dear Traders,
Gold has been rallying with strong bullish momentum and has not experienced a major correction since the last few weeks. We have identified a key level from which the price can continue its bullish momentum if fundamentals do not change. Furthermore, we can target $4200 in a few weeks if the current momentum continues.
Best regards,
Team Setupsfx_

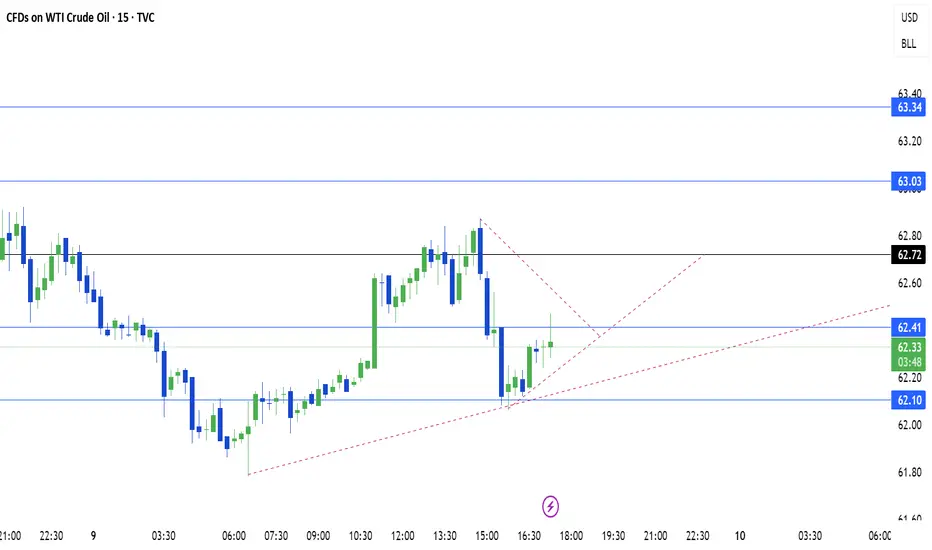
US OIL SUPPORT, RESISTANCE & TRENDLINE ANALYSISAs posted on 6th October US Oil moved upside when it broke the mentioned levels.
We have quiet a room for "LONG" position. Go for LONG only if it breaks 62.72 and might touch 63.03 and if it breaks this as well it might go further up till 63.34.
For "SHORT" positions plan only if it breaks 62.10 and it might lead to 61.72 and 61.26.
Breaking the trendline should also indicate and upward movement.
CHALLENGE DAY 8 - GOLD SELL ACTIVECHALLENGE DAY 8 - GOLD SELL ACTIVE
A+ Setup
1:1 RR
typical setup as previous trades

GOLD – Pullback After Gaza Deal, Fed Speech to Steer Next MoveGOLD – Overview | Pullback After Gaza Deal, But Bullish Structure Intact
Gold eased slightly after the announcement of a Gaza ceasefire deal between Israel and Hamas, as geopolitical tensions cooled.
However, prices remain near record highs, supported by expectations of further Fed rate cuts, strong ETF inflows, and persistent concerns surrounding the U.S. economy and the government shutdown.
Investors now await today’s Fed speech, which could set the tone for near-term volatility in the metal.
Technical Outlook
The price stabilized below the pivot line at 4,041, signaling mild bearish pressure in the short term.
As long as gold trades below this zone, momentum may continue toward 4,026 → 4,010, and a confirmed 15M close below 4,010 could extend the move toward 3,987.
On the other hand, a 15M close above 4,041 would shift momentum back to the upside, opening the way toward 4,058 → 4,072 → 4,092, with the 4,100 area marking the next key bullish target.
Pivot Line: 4,041
Resistance: 4,058 · 4,072 · 4,092
Support: 4,026 · 4,010 · 3,987
Summary:
Gold remains fundamentally supported by global uncertainty and Fed rate-cut bets, even as short-term corrections play out.
Watch for volatility around the Fed speech—a dovish tone may reignite bullish momentum above 4,041, while a hawkish tone could trigger deeper correction below 4,010.

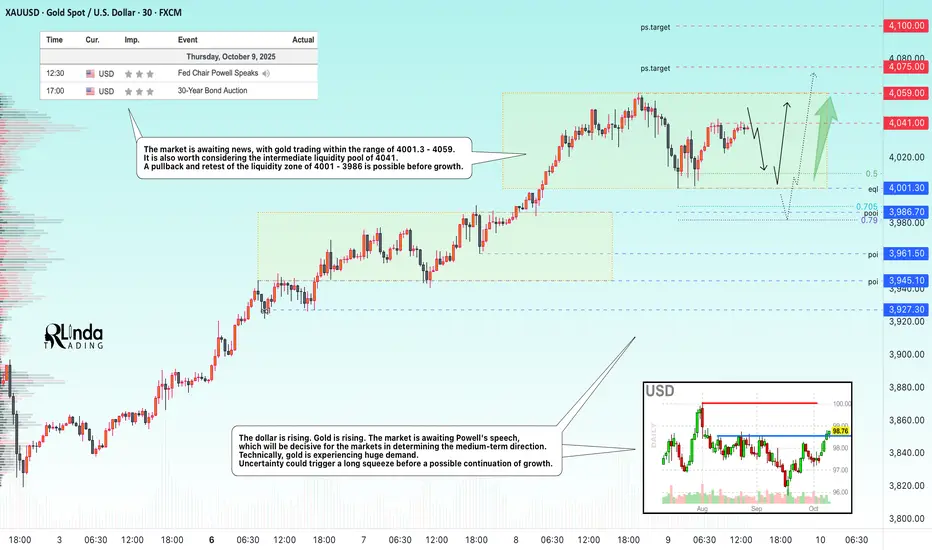
GOLD → The correction will provide a good opportunity for longFX:XAUUSD remains above the psychologically important level of $4,000, having corrected from a record high of $4,059. The market is awaiting Powell's speech, which could set the medium-term tone for the markets...
Key supporting factors: Uncertainty over the shutdown: The phased reopening plan has not yet been approved, which is keeping demand for safe-haven assets high.
Expectations of Fed easing: The probability of a rate cut in October is 100%, and in December is 80%, despite disagreements within the Fed.
As prices rise, the risks of a correction increase, especially against the backdrop of the Fed chair's speech.
Gold remains in a bullish trend. A correction to $4,000 looks like a healthy pause. Further dynamics depend on the Fed's tone and developments with the shutdown — a break below $4,000 is unlikely without new fundamental reasons.
Resistance levels: 4041, 4059, 4100
Support levels: 4001, 3986
Technically, gold has been rising without pullbacks for 35 days. The growth amounted to more than 22%. Accordingly, the market may form corrections, pullbacks, or consolidations within local timeframes. News may provoke such corrective maneuvers before the main movement. I consider the support levels of 4000 - 3986 - 3961 to be areas of interest. A retest or false breakdown could trigger a rebound and growth.
Best regards, R. Linda!
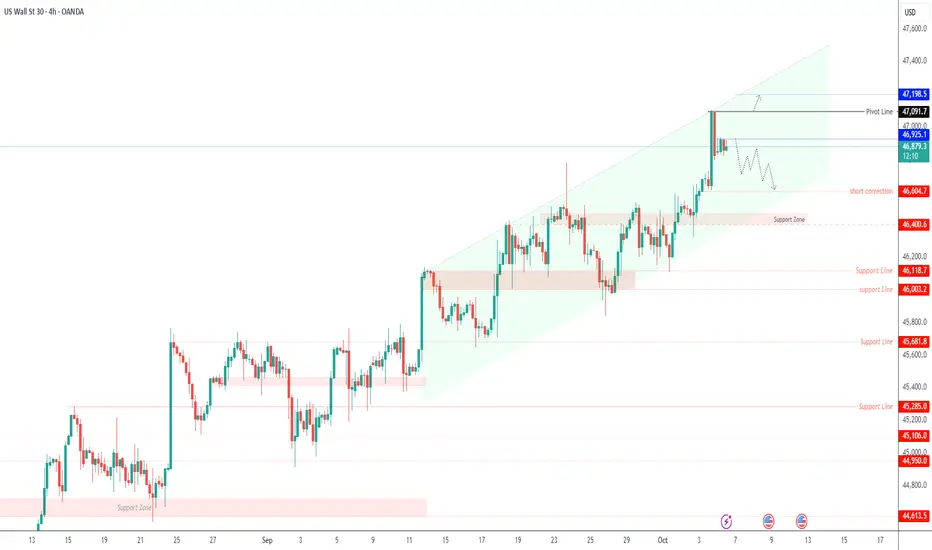
US30 – Short-Term Correction Expected After Record HighUS30 – Overview
The Dow Jones reached a new record high, but now shows signs of a short-term correction before the next move.
A minor pullback toward 46,680–46,610 is possible before the next directional breakout.
Technical Outlook
A break below 46,400 would confirm a shift to a bearish trend, with potential downside continuation.
On the other hand, a confirmed break above 46,925 would reinforce the bullish momentum, targeting 47,090 → 47,200 in extension.
Pivot: 46,925
Support: 46,680 – 46,600 – 46,400
Resistance: 47,090 – 47,200 – 47,350
GOLD - Bullish Channel Holds Above $4000 Gold continues to respect its ascending channel on the 1H timeframe, maintaining strong bullish momentum above the $4000 psychological zone.
After a clean retest of mid-channel support near $4010, buyers regained control, showing renewed strength ahead of major resistance.
⸻
Key Technicals:
• Trend: Bullish continuation within ascending channel
• Support Zone: $4000–$4010
• Resistance: $4040 / $4065 / $4100
• Bias: Buy dips while above $4000
⸻
Scenarios:
🟢 Bullish: Break & candle close above $4040 could extend toward $4065–$4100
🔴 Bearish: Failure to hold $4000 may invite a correction to $3960–$3940
⸻
Trade Setup (for educational purpose):
• Entry: $4025–$4035 breakout retest
• Stop Loss: Below $4000
• Targets: $4065 / $4100
• Risk–Reward: ≈ 1:2
⸻
Commentary:
Gold’s recent structure shows a clear algorithmic rhythm — controlled volatility between mid-channel rejections and upper-band breakouts.
Gold (XAUUSD) holding firm above $4000 within a bullish channel — watching for breakout continuation toward $4065–$4100.
⸻
#XAUUSD #Gold #Breakout #PriceAction #TechnicalAnalysis #AlgorithmicTrading #AuraFinTech #SmartBreakout #TradingStrategy #AITrading #GoldAnalysis #TrendFollowing #Forex #Commodities #GoldForecast

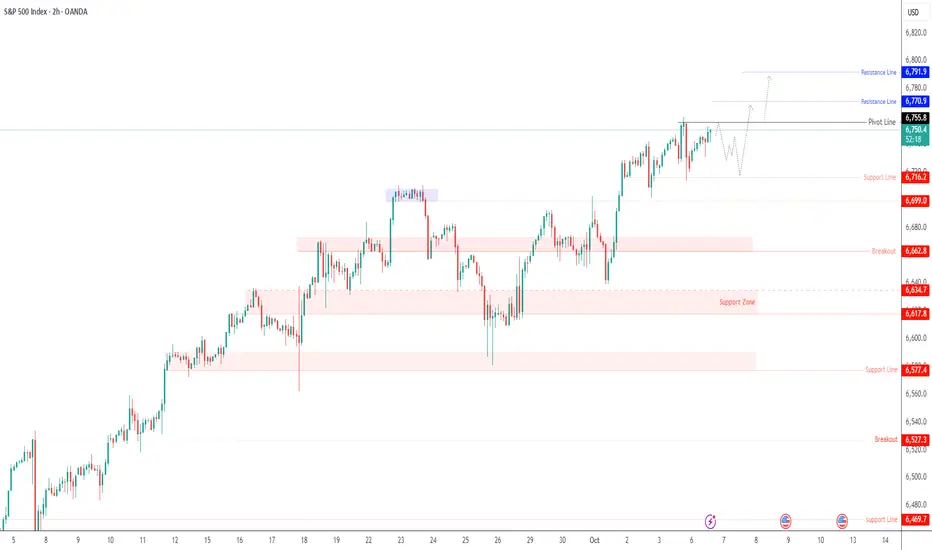
SPX500 Tests Highs as AI and Rate-Cut Hopes Support RallySPX500 – Technical Overview
The S&P 500 continues to trade near record highs as AI strength and renewed rate-cut optimism offset lingering concerns from the U.S. government shutdown.
Markets remain supported by expectations of further Fed easing, though volatility may persist around key resistance zones.
Technical Outlook
The index is testing the previous week’s highs around 6,755–6,727.
A 1H close below 6,727 would confirm a short-term bearish correction toward 6,699 → 6,662.
Conversely, a 1H close above 6,755 would reinforce bullish momentum and open the way toward 6,770 → 6,791 → 6,820.
Pivot: 6,755
Resistance: 6,770 – 6,791 – 6,820
Support: 6,727 – 6,716 – 6,699 – 6,662
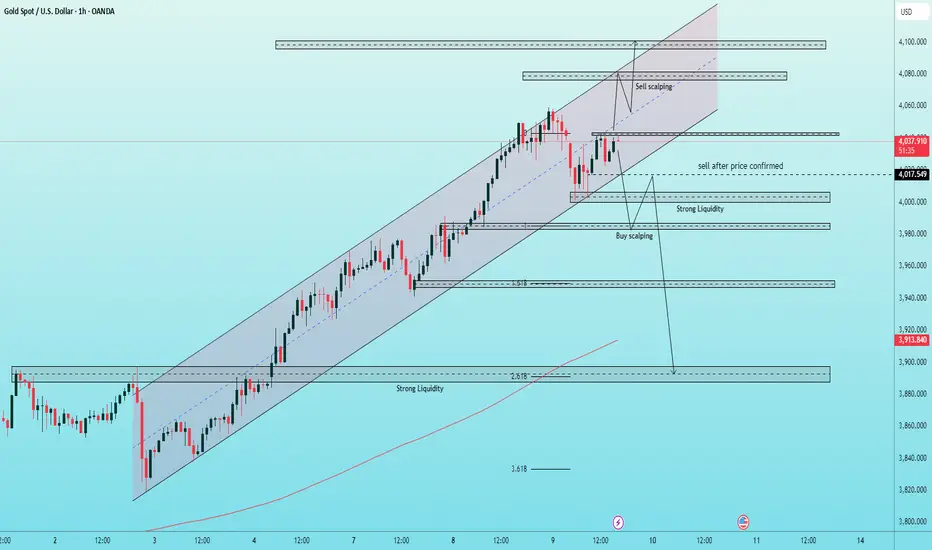
XAUUSD – MID-TERM OUTLOOK ON H1 | STAY CLOSE TO THE MAIN TREND
Hello trader 👋
Gold prices are currently holding steady within the rising channel but are approaching a strong resistance zone around 4043 – 4005, a critical boundary to assess whether the uptrend will continue or begin to adjust.
In the current context, the market is showing signs of caution as the USD rises slightly and political - financial news in the US escalates, causing strong investor sentiment fluctuations.
🔎 Technical Analysis
On the H1 frame, prices continue to move within a clear upward channel, but the upward momentum is beginning to weaken.
Fibonacci extension and volume profile indicate a strong liquidity zone concentrated around 4005 – 3980, where buying and selling forces may appear in a tug-of-war.
Important resistance: 4078 – 4080 (Fibo 4.0 and upper edge of the rising channel)
Important support: 3985 – 3980 (liquidity zone + high volume node)
RSI is giving a slight divergence signal, warning of the possibility of a technical adjustment.
⚙️ Detailed Trading Plan
🔴 MAIN SELL:
Entry: 4078 – 4080
Stop Loss: 4085
Take Profit: 4060 → 4053 → 4025 → 4008
👉 Sell reaction at the channel peak resistance zone, coinciding with the high liquidity area.
🔴 SELL on confirmation of breaking 4005:
Entry: 4015 – 4017
Stop Loss: 4023
Take Profit: 4005 → 3988 → 3970 → 3945
👉 Breakout sell order, only activated when the candle confirms closing below 4005.
🟢 SHORT-TERM BUY:
Entry: 4056 – 4058
Stop Loss: 4050
Take Profit: 4068 → 4088 → 4095
👉 Wave surfing buy order at the support zone within the rising channel.
🟢 BUY SCALPING:
Entry: 3982 – 3985
Stop Loss: 3978
Take Profit: based on price reaction / wave confirmation
👉 Quick buy at the strong liquidity zone if a reversal signal appears.
💡 Fundamental View
Latest news: Bensont has completed the first round of interviews for the Fed Chair candidate, with questions revolving around interest rates and QE, indicating that upcoming monetary policy remains the focal point.
The DXY index has surpassed the 99 mark, up 0.16% on the day, exerting certain pressure on gold.
Market sentiment is fluctuating strongly, reflecting concerns about the direction of US monetary policy in the next quarter.
⚖️ Conclusion
Mid-term trend: Upward but weakening
At this stage, it is necessary to closely follow price action at the 4043 – 4005 boundary to determine the next direction.
Prioritize selling at resistance – buying at support, taking advantage of fluctuations within the price channel.
Maintain a flexible trading mindset, manage capital tightly when the market fluctuates due to news.
📈 Quick Summary:
Sell: 4078–4080 / 4015–4017
Buy: 4056–4058 / 3982–3985
Key zone: 4043 – 4005 (confirm new trend)
Gold Holds 4,010 Ahead of Powell as Shutdown Clouds CPI OutlookHey Traders,
In today’s session, we’re keeping a close eye on XAUUSD for a potential buy setup around the 4,010 zone. Gold remains in a broader uptrend, and the current pullback brings price action near a key support and trend confluence that could attract fresh buyers.
All eyes are on Fed Chair Powell’s remarks later today. With the U.S. government shutdown disrupting key economic releases, including a possible delay of next week’s CPI data, Powell’s tone could heavily influence short-term Dollar sentiment—and by extension, Gold momentum.
If Powell hints at policy caution amid data uncertainty, the safe-haven narrative could re-emerge quickly. We’ll be watching closely for a potential technical trigger to align with the macro backdrop.
Trade safe,
Joe.

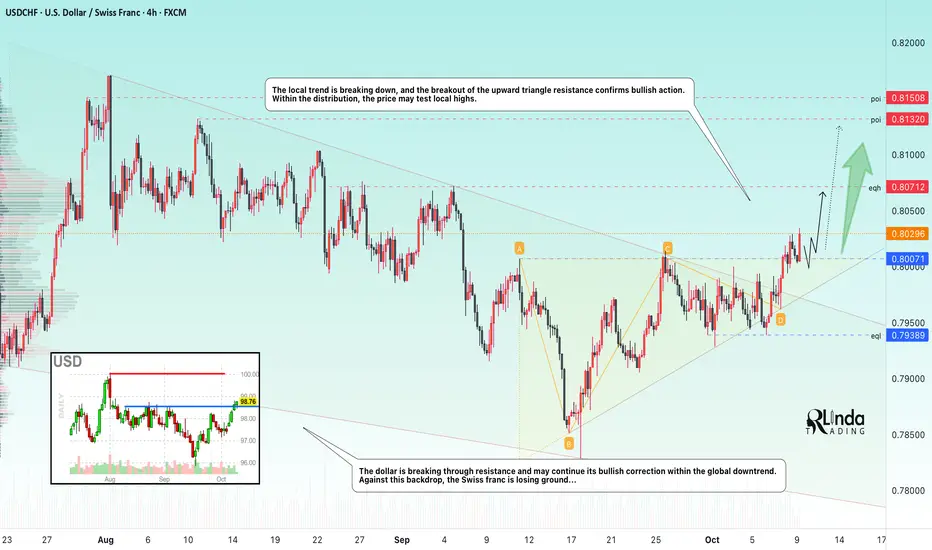
USDCHF → Change in local trend. Confirmation...FX:USDCHF confirms a change in the downtrend and is ready to move into a distribution phase amid growth in the dollar index.
The dollar is breaking through resistance and may continue its bullish correction within the global downtrend. Against this backdrop, the Swiss franc is losing ground...
The currency pair is forming a breakout of the local trend. The breakout of the resistance of the ascending triangle confirms bullish action. As part of the distribution, the price may test local highs.
Resistance levels: 0.8071, 0.8132
Support levels: 0.800
A consolidation of the price above 0.800 may form an intermediate bottom, which will provide support for the bulls before the next run.
Best regards, R. Linda!
Do you dare to follow the short selling?Judging from the hourly chart, gold rebounded after testing the lower support several times, and stagnated after rebounding to around 4040. After closing the hourly line with a doji, it formed a large negative line. This pattern means that gold may pull back to test the lower support in the short term. Secondly, gold is still under trend suppression in the short term, so we have good reasons to short it.
If gold rebounds again to around 4030-4040, we could consider a light short position, with an eye on 4015-4000.
For more real-time updates, please follow🌐

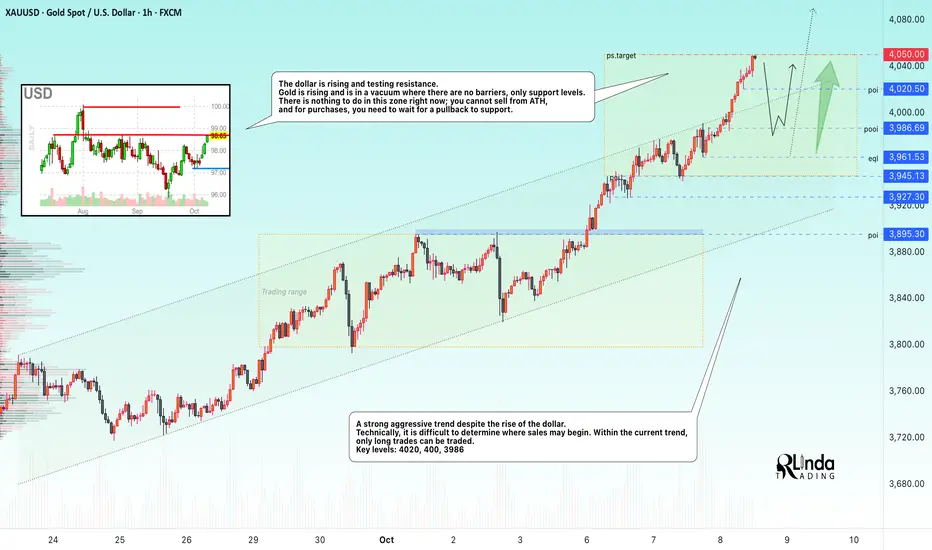
GOLD → Testing 4050 - 4100. Need a pullback to tradeFX:XAUUSD is hitting a new all-time high, testing $4,050, and looks set to reach $4,100. This record growth is linked to falling interest rates and economic risks, which are causing money to flow into hedge assets...
Key drivers: The White House may announce civil service cuts amid the shutdown, which increases uncertainty. The probability of interest rate cuts in October is 95%, supported by the delay in data publication due to the shutdown. Global central banks continue to build up reserves. However, as prices rise, so do the risks of correction. The USD is also receiving support as a safe haven, which may limit further growth in gold.
Resistance levels: 4050, 4075, 4100
Support levels: 4020, 400, 3986
Technically, we need to wait for a slowdown and correction to take a full breath before further movement. I consider the local liquidity zones of 4020 - 4000 - 3986, 3961 to be promising areas of interest. I do not rule out the possibility of sharp shocks in the market, so we need to be prepared...
Best regards, R. Linda!