AVAX Breakout Alert: Eyeing $35–$38 Zone$AVAX/USDT is testing a 200-day accumulation zone. A sustained breakout here could trigger an explosive move, with price potentially running quickly toward the $35–$38 zone.
Add it to your watchlist and keep an eye on a confirmed breakout and close above this level.
DYOR, NFA
Trendlineanalysis

Gold at a turning point – breakout or pullbackGold Daily Chart – Final Week of August
Hello traders, let’s take a look at the gold outlook for the coming week.
Gold has continued to rally strongly after touching the ascending trendline on the D1 chart, in line with the outlook shared earlier. This bounce also makes the triangle pattern more valid. For the week ahead, trading is expected to remain within the 3330–3410 range, giving about 80 dollars of movement.
While the longer-term expectation is for gold to move towards fresh ATH levels, this will first require a confirmed breakout from the triangle. Once that happens, a minor pullback could occur before the next leg higher (as illustrated on my chart).
On the H4 chart, Friday’s rally has allowed us to plot a Fibonacci Extension, highlighting 3390 and 3430 as potential upside levels. These areas may act as short-term selling opportunities, driven by profit-taking from buyers.
On the daily timeframe, a successful breakout from the triangle could push gold towards 3540, marking a new ATH – this is the long-term scenario. On the other hand, if price pulls back, the ascending trendline near 3341 remains a logical level to consider fresh long positions.
Also note that this is the last week of August. On Friday, a liquidity grab is possible as large players rebalance and settle positions before month-end, so extra caution is advised.
This is my personal outlook for XAUUSD in the week ahead. I hope it provides value in shaping your trading plans.
What’s your view on gold right now? Share your thoughts in the comments so we can learn from each other.
GBPUSD Outlook – Trend is My LifeGBPUSD Outlook – Trend is My Life
GBPUSD continues to move in line with the broader bearish structure on the H4 timeframe. Price reactions along the trendline have been accurate, and at the moment, the pair is showing signs of a minor pullback towards the upper trendline. This offers a potential opportunity for a short-term sell, while keeping an eye on the 1.3400 support as a possible swing buy zone.
If 1.3400 breaks decisively, the preferred scenario remains to follow the downtrend with further sells until a clear reversal structure is confirmed.
The MACD indicator continues to signal a strong and sustained bearish bias, adding weight to this outlook. Remember the phrase: “Trend is My Life” – staying aligned with the prevailing trend is key to maximising efficiency across any trading system.
Key levels to watch:
Resistance: 1.3510
Support: 1.3380
Patience in observing price action around these zones will provide better entries and improve trade management.
#GBPUSD #Forex #TechnicalAnalysis #PriceAction #MACD #TrendFollowing

JKCEMENTJKCEMENT given trendline breakout. It has posted v decent result above street's expectations. There is high probability that market may turn its trend which is in favor of new trend. Keep it on radar.

Gold (XAU/USD) 15m Chart AnalysisGold is currently holding above the 3,345 support zone, aligned with the 200 EMA (blue line). Price tested this support area and showed a bullish reaction, indicating potential demand.
🔑 Key Levels:
Support: 3,344 – 3,345 zone
Resistance: 3,357
📈 Bias:
If price sustains above the highlighted demand zone, we may see a bullish continuation toward the 3,357 resistance level. The projection suggests a possible pullback before continuing higher.
⚠️ Watch out:
A clean break below 3,344 could invalidate this setup and open the way for further downside.

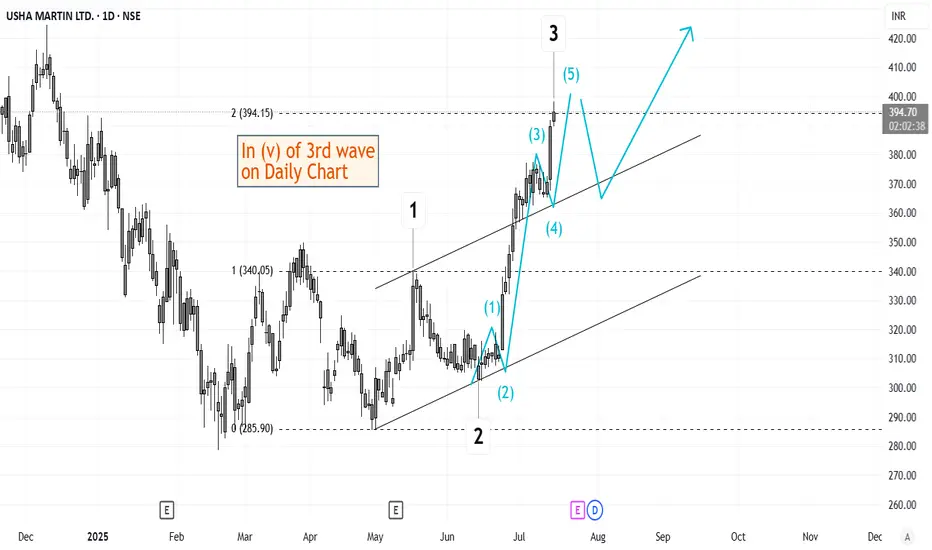
Elliott Wave Analysis of Usha Martin USHAMARTThe script is currently in (v) of 3rd wave on daily time frame. This should be followed by a short retracement and then a 5th wave up. Will keep updating this chart as it progresses.
Gold Weekly Trend Line PotentialsSometimes you connect a couple of wicks and draw out from there...playing around a bit too looking out some more...
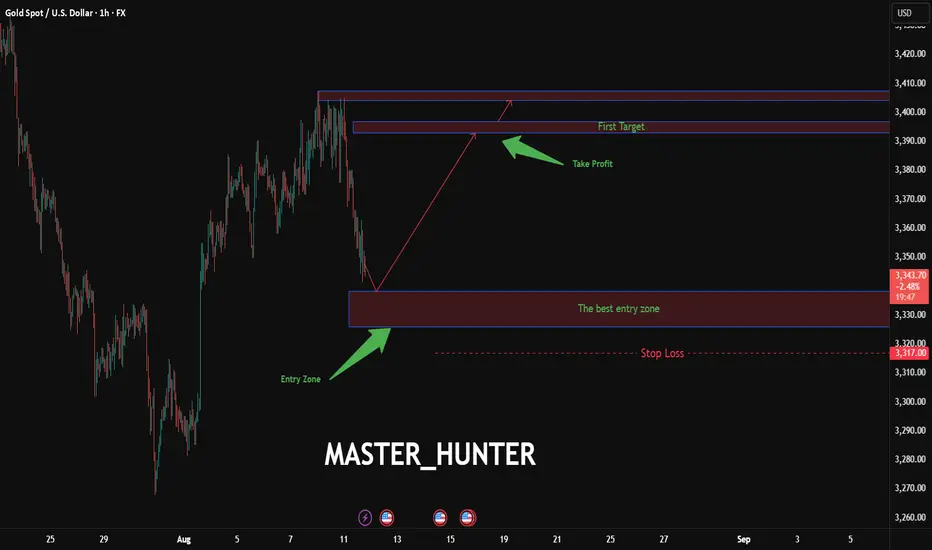
XAU/USD: Gold Rocket to 3407 Unleashed?FX:XAUUSD is primed for a explosive breakout on the 1-hou r chart, with an entry zone at 3326-3338 near a bullish pivot.
First target at 3393 , with a second target at 3407 smashing through resistance.
Set a tight stop at 3317 to lock in risk. A surge past 3340 with volume could ignite this gold rocket. Watch USD weakness and global risk appetite. Get ready to soar!
I will gladly see your comments
#XAUUSD #GoldTrading #ForexSignals #TechnicalAnalysis #TradingView #DayTrading #MarketAnalysis
Bitcoin Cash Ready to Smash Resistance!CRYPTOCAP:BCH is holding strong above its rising trendline, showing solid bullish structure. Price is currently testing a minor resistance zone at the top, forming a potential double-top pattern.
If bulls can break through this level, we could see the pattern invalidate and momentum push for further upside continuation.
DYOR, NFA

BTC Riding the Trend — $120K Target on RadarBitcoin is riding a rising support zone, showing steady bullish momentum despite recent pullbacks.
We’ve seen a key resistance level flip into support, and price is now holding firmly above it. As long as CRYPTOCAP:BTC respects this trendline, bulls have a strong chance to push higher.
The immediate test is the downtrend resistance — a clean breakout here could open the path toward the $120K–$122K zone.
If rejected, price may retest the rising support before making its next move.
DYOR, NFA
Thanks for the reading

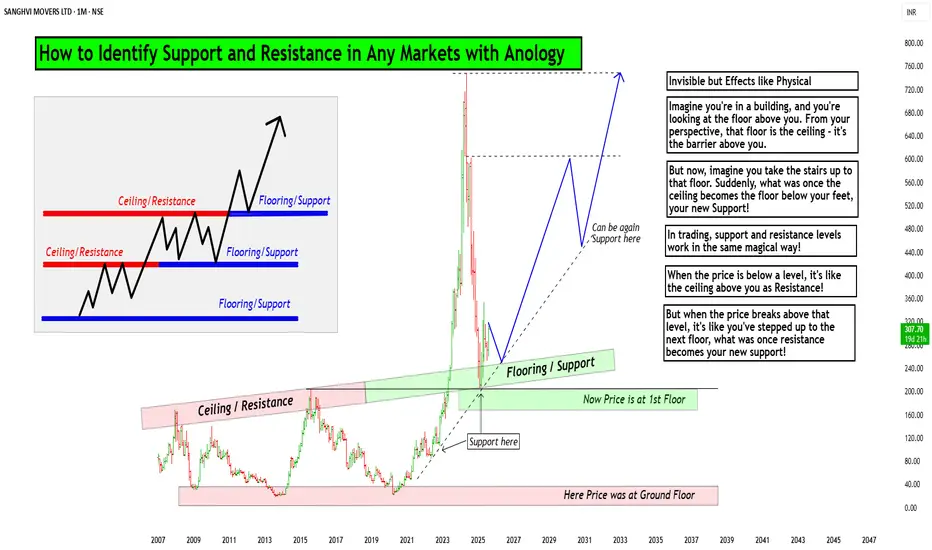
How to Identify Support and Resistance in Markets with AnologyHello Friends,
Welcome to RK_Chaarts,
Today we are going to learn & understand real work of Supports and Resistances in markets,
and Market structure with very good examples (Educational Post)
The Market's Architecture: Support and Resistance
This is an excellent analogy for understanding two of the most worthful concepts in technical analysis: support and resistance. By thinking of the market as a multi-story building, we can visualize how price moves and what happens when it hits certain levels.
- The Core Analogy: The Building and the Elevator
- Imagine the market as a large building with many floors. The price of an asset (like a stock or a cryptocurrency) is like an elevator moving up and down within this structure. The floors and ceilings of the building are not physical barriers but represent specific price points that the market has collectively agreed upon as important.
- The Floor (Support)
The floor of a building provides a solid base and prevents the elevator from falling further. In the market, this is called a support level. A support level is a price point where buying pressure is strong enough to stop the price from declining. When the "elevator" (price) reaches the floor, it finds enough buyers to give it a lift, preventing a deeper fall. A strong support level is like a thick concrete floor—it has been tested multiple times and holds firm, showing that there is significant demand for the asset at that price.
- The Ceiling (Resistance)
- The ceiling of a building sets the upper limit for the elevator's movement on a given floor. This is the market's resistance level. A resistance level is a price point where selling pressure is strong enough to prevent the price from rising further. When the "elevator" hits the ceiling, it encounters a large number of sellers who are ready to take profits, pushing the price back down. A strong resistance level is like a low ceiling—the price hits it and retreats, indicating that many investors believe the asset is overvalued at that point.
Breaking Through: New Levels
The most dynamic part of the analogy is what happens when the elevator breaks through a floor or ceiling.
Breakout (Breaking the Ceiling):
When the price has enough momentum to push through the resistance level (the ceiling), it has essentially moved to a new, higher floor. This is a significant event. The old ceiling, which was previously a barrier, now becomes the new floor. This is a key trading principle: old resistance often becomes new support. The market has established a new, higher trading range, and if the price falls back to that level, it will likely find buyers there, who now see it as a good value.
Breakdown (Breaking the Floor):
Once if price falls from that floor (Support level) which is called as Breakdown in technical language, then lower floor can be the next stop for elevator (Next Support for price), The old floor, which once provided support, now becomes a new ceiling. This is the reverse principle: old support often becomes new resistance. If the price tries to rally back up, it will likely get stuck at this old support level, as it's now seen as a good place to sell.
Structural Integrity (Volume)
Think of market Volume like a construction team. When a lot of people are involved (high volume), the structure is stronger.
Imagine a ceiling in the market. If lots of buyers (high volume) break through it, that's like a robust construction team building a new floor. It's unlikely to collapse.
On the other hand, if sellers break through a floor with high volume, that's a strong sign they're serious about the downward move.
But if the volume is low, it's like a weak construction team. Even if they break through, the move might not last. It's like a flimsy wall that could easily be reversed.
So, volume gives us a sense of whether the market's moves are strong and reliable, or weak and likely to change.
I am not Sebi registered analyst.
My studies are for educational purpose only.
Please Consult your financial advisor before trading or investing.
I am not responsible for any kinds of your profits and your losses.
Most investors treat trading as a hobby because they have a full-time job doing something else.
However, If you treat trading like a business, it will pay you like a business.
If you treat like a hobby, hobbies don't pay, they cost you...!
Hope this post is helpful to community
Thanks
RK💕
Disclaimer and Risk Warning.
The analysis and discussion provided on in.tradingview.com is intended for educational purposes only and should not be relied upon for trading decisions. RK_Chaarts is not an investment adviser and the information provided here should not be taken as professional investment advice. Before buying or selling any investments, securities, or precious metals, it is recommended that you conduct your own due diligence. RK_Chaarts does not share in your profits and will not take responsibility for any losses you may incur. So Please Consult your financial advisor before trading or investing.
EURUSD – Watching Trendline + Resistance Zone for Short🧩 Setup Overview :
Price recently broke below a well-respected ascending trendline
It’s now approaching that same trendline from underneath
The area also aligns with a prior resistance zone and potential lower high
If price retests this zone and shows clear rejection, I’ll consider a short entry
🎯 Trade Plan (If Triggered) :
Short on confirmed rejection (not entering blindly)
Stop Loss: Above the recent high / invalidation point
Target: Next support level — clean structure, favorable R:R
💬 How are you approaching EURUSD here?
Always open to hearing different views. Drop your thoughts below 👇

XAUUSD GOLD Buy Trade
Buy trade condiational buying on Restest and confirmation of bullish candle
Chart shows SL TP Entry point
Partial booking is suggested risk free trade as soon possible ap per risk reward

Gold 15-Min Breakout: Eyes on M30 Supply Zone & FVG RetestPrice is currently approaching a key M30 Supply Zone after a strong bullish impulse from the ascending trendline support.
🔹 Key Observations:
The price broke above a previous short-term resistance zone and is now retesting the Fair Value Gap (FVG) area marked in pink.
The 200 EMA acted as dynamic support, further fueling bullish momentum.
Structure shows a series of higher lows, confirming buyers in control on intraday timeframes.
🔹 Potential Scenarios:
✅ Bullish Continuation:
If the price respects the FVG as demand and forms bullish confirmation, continuation toward the M30 Supply Zone and the 3,399–3,400 region is likely.
⚠️ Pullback Risk:
A deeper retracement below FVG could retest the trendline or the 3,371 support near the 200 EMA before any further upside.
🔹 Trade Plan:
Watching for price action reaction inside the FVG. A clean rejection could offer entries targeting the upper supply zone.

EURJPY LONG After seeing price reject 170.000 monthly area of institutional support we saw a sharp push to the upside on the weekly timeframe from last week and we could see the market push to the upside not that the 4hr broke area of structure resistance

Gold Price Setup – Potential Rejection & Long ScenariosPrice is currently consolidating below the H4 Supply Zone after rejecting the ascending trendline twice.
Two key scenarios are in focus:
✅ Scenario 1 – Deeper Pullback to Demand Zone
A retracement into the 1H + 30M Order Block (OB) and liquidity zone near 3,341–3,355 (marked with $$$) could attract buyers.
If bullish momentum confirms, look for a continuation toward 3,388 and possibly the upper trendline near 3,400+.
✅ Scenario 2 – Immediate Push Higher
If price holds above the moving average and fails to break below 3,355, bulls could step in earlier, driving price back to test the trendline resistance.
Breakout of the trendline could target the higher supply region.
🔍 Key Levels to Watch:
H4 Supply Zone (3,440 area) for potential reversal.
3,341 OB Zone for liquidity sweep and reaction.
Trendline Resistance capping the upside.

XAU/USD Buy Setup 1H Analysis Trendline breakout.Instrument: Gold Spot / USD
Timeframe: 1H (1 Hour)
Chart Tools Used:
Ichimoku Cloud
Trendline breakout
Target projection (highlighted in blue arrow and price levels)
Volume not shown directly but momentum is clear from breakout
---
💹 Buy Setup Analysis
✳ Current Price: $3,362.895
🔼 Entry (Buy): Around $3,363.590 (as marked on the chart)
🎯 Targets:
Target Number Price Level Approx Gain % Move
1st Target $3,393.481 ~$30 ~0.89%
2nd Target $3,433.864 ~$70 ~2.06%
🔻 Stop-Loss (Suggested): Below Ichimoku Cloud, ideally near $3,315.860 or $3,322.672
---
🧠 Strategy Logic
The chart shows a clean bullish breakout of the trendline and Ichimoku cloud.
Strong upward momentum candle confirms the breakout.
Targets are based on measured move and previous resistance zones.
Volume and sentiment look bullish, aligning with the breakout.
A pullback to the breakout zone (~$3,340–$3,350) would be healthy for re-entry.
---
📝 Summary of Buy Setup
Parameter Value
Entry $3,363.590
Target 1 $3,393.481
Target 2 $3,433.864
Stop-Loss $3,322.672–$3,315.860 (zone below cloud)
Risk-Reward ~2:1 to 3:1 based on SL/TP choice

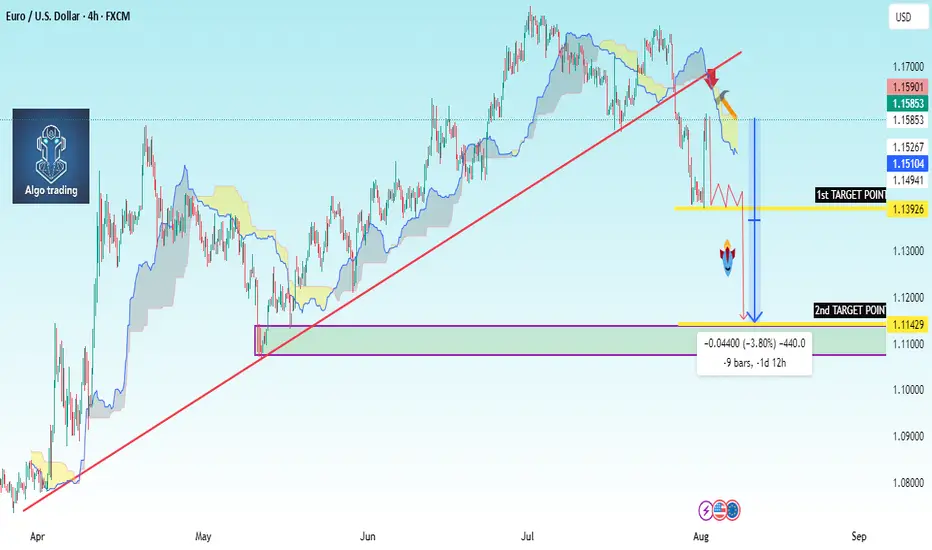
EUR/USD Chart Summary (Bearish Setup):Trendline Break: A long-term bullish trendline has been broken.
Price below Ichimoku Cloud: Indicates bearish momentum.
Bearish Retest: Price pulled back to retest the broken trendline and is now forming a bearish continuation pattern.
Double Target Zones Identified:
1st Target Point: ~1.1329
2nd Target Point: ~1.1144
---
🟠 Suggested Trade Setup:
🔹 Entry (Sell):
Around 1.1585 (where price is hovering now; or on a small pullback).
🔻 Take Profit (TP):
🎯 TP1: 1.1329 (short-term target)
🎯 TP2: 1.1144 (main target if bearish momentum continues)
🛑 Stop Loss (SL):
Place above the recent swing high or cloud resistance — around 1.1670
---
📊 Risk-Reward:
TP1 = ~250 pips
TP2 = ~440 pips
SL = ~85 pips
This gives you a favorable risk-reward (1:3+ to TP
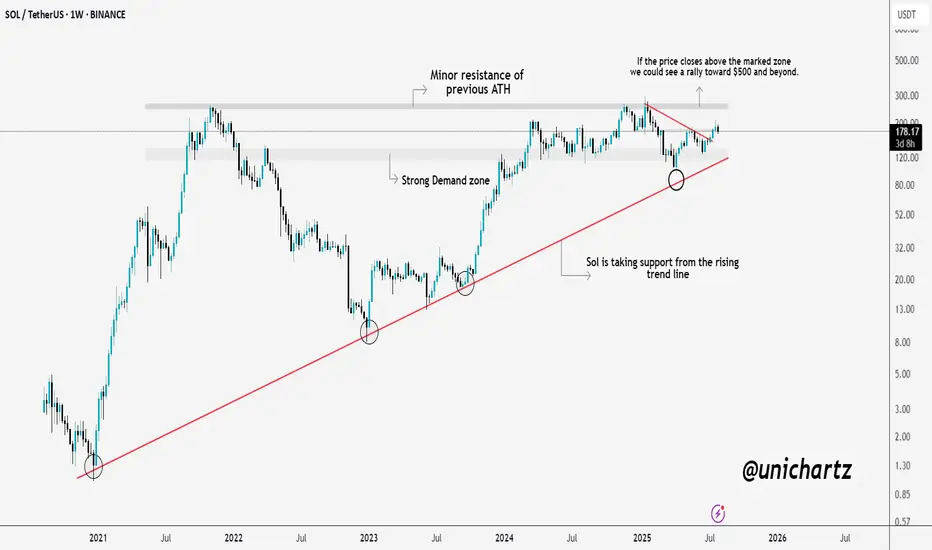
Massive Move Loading? $SOL Prepping for a BreakoutSolana is showing real strength here.
CRYPTOCAP:SOL consistently taking support from the long-term rising trendline, a sign that buyers are defending key levels. We're also approaching a critical resistance zone, which was the previous ATH area.
If SOL manages to close above this zone, we could witness a strong rally towards $500 and beyond. Until then, it’s a crucial level to watch, a breakout here could set the stage for the next leg up.
DYOR, NFA
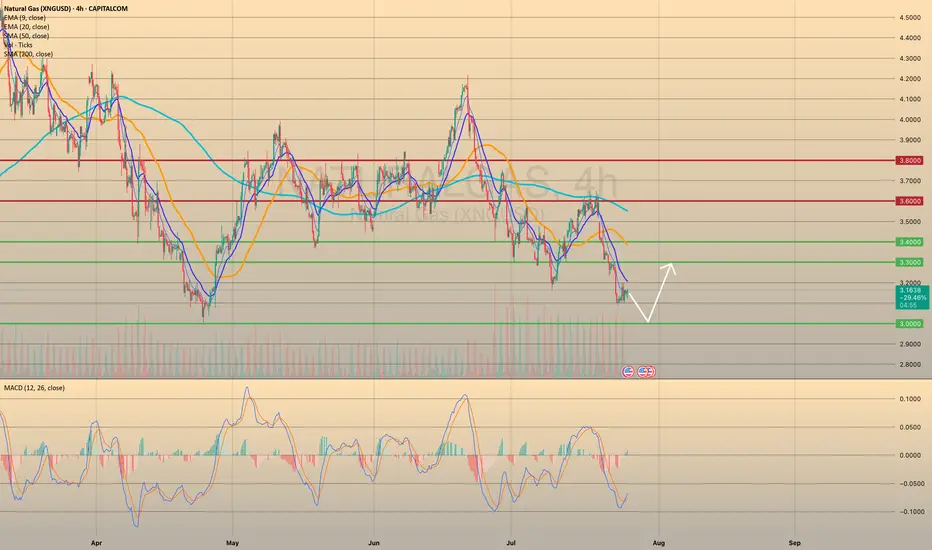
XNGUSD CONTINUES ITS DOWNWARD TREND. FOR HOW LONG?XNGUSD CONTINUES ITS DOWNWARD TREND. FOR HOW LONG?
Recent bearish impulse started at the beginning of this week may come to an end soon. Yesterday the U.S. Natural Gas Storage report came out. Numbers appeared to be lower than expected and lower than previous. (23b vs 28b vs 46b). This is bullish signal for the market participants. Minutes after the report came out, market reacted bullish, however, soon price went sideways.
Right now gas prices continue to decline. Still, the opportunity for short-sellers here is quite limited. Not so far below there is a level of 3.0000, form where I expect the price to rebound, supposedly to a 3.3000.
GBPUSD 1H / 1DWait for the price leave the consolidation zone.
If it comes out in Long, wait for the retest in the support and look to enter in Long.
If it goes short, wait for the Retest at resistance and look to go short.

Bitcoin Decision Time Closing - Pump to $150K, or $100K Retest?Here we see a clear trendline that bitcoin must hold. A breakdown could lead to a retest of the 100-110K levels. If we can hold this trendline until August 15th, the odds of a bullish continuation will increase.

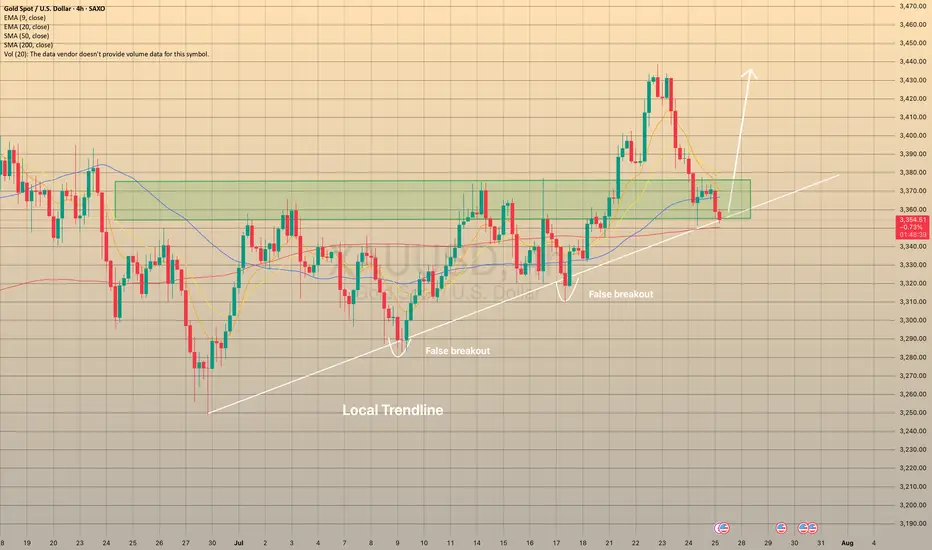
XAUUSD REACHED THE LOCAL TRENDLINEXAUUSD REACHED THE LOCAL TRENDLINE
On July 24 the U.S. Manufacturing PMI report came out way below forecasted (49.5 actual vs 52.6 forecasted). A number below 50 causes concerns among investors and could be a sign of an overall economic slowdown or recession. So, as a result, it could lead to an increase in demand for safe assets like gold.
However, today the price, despite the recent rebound from the trendline after report, came to the trendline once again. There is a high possibility that the price will rebound in nearest future: besides the local trendline we may observe the sma200 on 4-h chart. Additionally, we entered the price zone of 3,350.00-3,375.00, which used to be a resistance zone, now may play out as a support. In case of rebound, the price may go to local highs of 3,440.00 at least.