XAUUSD (H1) – Inverse Head & Shoulders in play Lana focuses on pullback buys above key liquidity 💛
Quick overview
Timeframe: H1
Pattern: Inverse Head & Shoulders confirmed on the chart
Bias: Bullish continuation while price holds above neckline
Strategy: Buy pullbacks into liquidity zones, avoid chasing highs
Technical view – Inverse Head & Shoulders
On H1, gold has completed a clean Inverse Head & Shoulders structure:
Left shoulder: Formed after the first sharp sell-off
Head: Deeper liquidity sweep, followed by strong rejection
Right shoulder: Higher low, showing weakening selling pressure
Neckline: Around the 4030–4040 resistance zone (now being tested)
The recent breakout and strong follow-through suggest buyers have regained control. As long as price holds above the neckline, the structure favors continuation to the upside.
Key levels Lana is watching
Primary buy zone – Pullback entry
Buy: 4363 – 4367
This area aligns with prior structure support and sits inside a healthy pullback zone. If price revisits and shows acceptance, it offers a good risk-to-reward buy.
Liquidity risk zone – Deeper pullback
Liquidity risk: 4333 – 4349
If volatility increases and price sweeps deeper liquidity, this zone becomes the secondary area to watch for bullish absorption.
Upside targets & resistance
High liquidity area: 4512 – 4517
ATH zone: Above the previous all-time high
These zones are expected to attract profit-taking or short-term reactions, so Lana avoids chasing price near these levels.
Fundamental context (market drivers)
Geopolitics: Rising tension after comments about potential military intervention in Colombia adds background support for gold as a safe haven.
Goldman Sachs: Views Venezuela-related developments as having limited impact on oil, keeping broader commodity sentiment stable.
ISM Manufacturing PMI (US): Any sign of slowing manufacturing can pressure USD and indirectly support gold.
Overall, fundamentals remain supportive for gold, reinforcing the bullish technical structure.
Trading plan (Lana’s approach)
Prefer buying pullbacks into 4363–4367 while structure holds.
Be patient if price dips into 4333–4349 and wait for confirmation before entering.
If price falls back below the neckline and fails to reclaim it, Lana steps aside and reassesses.
This is Lana’s personal market view and not financial advice. Please manage your own risk before trading. 💛
Trendtrading

XAUUSD (H2) – BUY priority today Gold holds above 4,400 on safe-haven flows | Trade liquidity, don’t chase
Quick summary
Gold started the week with strong momentum and pushed above 4,400 during the Asian session as global markets rotated into safe-haven assets. Geopolitical risk is the key driver after reports of US ground strikes in Venezuela and the detention of President Nicolás Maduro and his wife.
With that backdrop, my plan today is simple: prioritise BUY setups at liquidity zones, and avoid FOMO while price is elevated.
1) Macro context: Why gold is supported
When geopolitical risk escalates, capital typically flows into gold.
Headline-driven sessions often bring:
✅ fast pumps, ✅ liquidity sweeps, ✅ larger wicks/spreads.
➡️ The safest execution is waiting for pullbacks into predefined buy zones, not chasing highs.
2) Technical view (based on your chart)
On H2, gold has bounced sharply and your chart highlights clear execution areas:
Key levels for today
✅ Buy zone: 4340 – 4345 (trend/structure pullback zone)
✅ Strong Liquidity: lower support band (marked on chart)
✅ Sell zone: 4436 – 4440 (near-term supply / reaction area)
✅ Sell swing / target: 4515 – 4520 (higher objective / profit-taking zone)
3) Trading plan (Liam style: trade the level)
Scenario A (priority): BUY the pullback into 4340–4345
✅ Buy: 4340 – 4345
SL (guide): below the zone (adjust to spread / lower TF structure)
TP1: 4400 – 4410
TP2: 4436 – 4440
TP3: 4515 – 4520 (if momentum continues with headlines)
Logic: 4340–4345 offers a cleaner R:R than chasing above 4,400.
Scenario B: If price holds above 4,400 and only dips lightly
Look for a buy only on clear holding signals near the closest support/strong liquidity (M15–H1).
Still not recommending FOMO entries in headline volatility.
Scenario C: SELL reaction (scalp) at supply
✅ If price tags 4436–4440 and shows weakness:
Sell scalp: 4436 – 4440
SL: above the zone
TP: back toward 4400–4380
Logic: This is a near-term supply area — good for quick profit-taking, not a long-term reversal call.
4) Notes (avoid getting swept)
Asian session can spike hard on headlines → wait for pullback confirmations.
Reduce size if spreads widen.
Only execute when price hits the level and prints a clear reaction (rejection / engulf / MSS).
What’s your plan today: buying the 4340–4345 pullback, or waiting for price to push into 4515–4520 before reassessing?

NZDJPY – Bullish Momentum Building Toward ABC TargetNZDJPY is showing strong bullish structure on the 1H timeframe, supported by multiple confluences pointing toward continuation — with the final C-leg target still in play.
🧠 Trade Setup & Logic:
Bullish Ascending Channel: Price is moving within a larger bullish channel, supporting the overall long bias.
Bullish ABC Sequence: A clean ABC correction is underway, with price currently progressing through the BC leg and heading toward the projected C target.
BC Reaction Zone: This zone aligns with a bullish institutional order block , offering strong support and an ideal entry zone.
Descending Channel Break: Price broke out of a short-term descending channel structure, confirming a shift in momentum and trend continuation.
Target Confluence: The C target of the ABC sequence has not yet been reached. Interestingly, it sits inside a bearish order block , which may serve as a draw on liquidity and a potential reversal or reaction area.
🎯 Key Levels:
Entry Zone: Near BC zone / order block support (~90.3)
Target: 91.00 (ABC projected C-leg completion inside bearish OB)
Stop-Loss: Below 90.00 (invalidates bullish structure)
📚 Confluences Summary:
✅ Bullish ascending channel
✅ ABC bullish correction
✅ BC support zone + institutional order block
✅ Descending channel breakout
✅ Target not yet hit — potential continuation toward liquidity in bearish OB
💬 Do you wait for confirmation at BC zones, or enter on structure breaks? Drop your thoughts or questions below!

XAUUSD Liquidity Rotation Under Black Swan Risks in 2026XAUUSD H1 – Liquidity Rotation Under Black Swan Risks in 2026
Gold is once again being driven by liquidity and macro uncertainty. While short-term price action is rotating around key Volume Profile levels, the broader backdrop for 2026 is increasingly shaped by underestimated systemic risks, often ignored during periods of market optimism.
TECHNICAL STRUCTURE
On H1, gold has completed a sharp downside liquidity sweep followed by a strong rebound, signalling aggressive absorption from buyers at lower levels.
Price is now rotating inside a short-term recovery structure, with liquidity clusters clearly defining where reactions are likely to occur.
The market is currently trading between sell-side liquidity above and buy-side liquidity below, favouring range-based execution rather than chasing momentum.
KEY LIQUIDITY ZONES
Sell-side liquidity / resistance:
4513 – POC sell zone
4487 – VAL sell scalping area
These zones represent heavy historical volume where sellers previously defended price. Reactions here may trigger short-term pullbacks before continuation.
Buy-side liquidity / support:
4445 – Buy POC
4409 – Major buy zone and liquidity support
These levels align with value areas where demand has stepped in strongly, making them critical zones for price stabilisation.
EXPECTED PRICE BEHAVIOUR
Short term: price is likely to continue rotating between buy and sell liquidity, creating two-way opportunities.
A sustained hold above buy-side liquidity keeps the bullish structure intact.
A clean break and acceptance above sell-side liquidity would open the path toward a retest of ATH levels.
MACRO & BLACK SWAN CONTEXT – WHY 2026 MATTERS
2026 is shaping up to be a year of hidden tail risks, including:
Increasing political pressure from President Trump on the Federal Reserve
Key elections in the US and multiple emerging markets
Elevated risk of an AI-driven technology stock bubble due to excessive valuations
Historically, environments marked by political stress, central bank credibility concerns, and asset bubbles tend to strengthen demand for hard assets, particularly gold.
BIG PICTURE VIEW
Gold remains structurally supported by liquidity and macro uncertainty
Short-term price action is tactical and level-driven
Long-term, gold continues to act as insurance against systemic and political risk
When markets underestimate risk, liquidity quietly shifts. Gold tends to move first.

NZDJPY NEXT LEG UPExpecting a continuation of the overall uptrend on NZDJPY
We can see that is has found dynamic on support on 20th creating a higher low, expecting.
TP1: 91.223
TP2: 91.922

CADJPY for this week bearish expectations
OANDA:CADJPY constantly we are have bullish trend, currently here expecting to see point of revers.
SUP zone: 114.200
RES zone: 112.300

TROW Long 1D Investment Conservative TradeConservative Trade
+ long impulse
+ 1/2 correction
+ SOS level
+ supporting zone
? ultravolume 2Sp+
= perforated T2
+ 1/2 correction
+ volumed 2Sp+
Calculated affordable virtual stop limit
1 to 2 R/R take profit
- outside 1D
+ inside 1M
Monthly CounterTrend
"- short balance
+ expanding ICE
+ support zone
+ biggest volume 2Sp+
+ weak test
+ 1/2 correction"
Yearly Trend
" '+ long impulse
+ T2 level
+ support zone
- deep correction
+ volumed interacting bar"

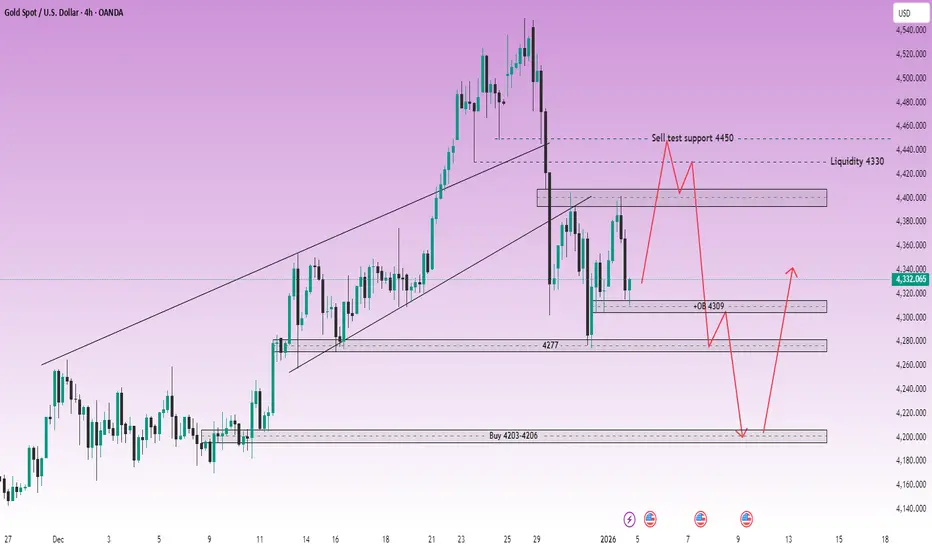
XAUUSD (H4) – Monday SetupGeopolitical shock risk, gold may spike | Trade liquidity and reaction zones only
Quick summary
News around Trump’s claim that Maduro has been detained, plus Venezuela’s response (they don’t know his and his wife’s whereabouts and are demanding proof of life), raises geopolitical uncertainty sharply. For gold, that’s a classic catalyst for a gap/spike at Monday open.
So my rule for Monday: no FOMO, only trade liquidity zones and confirmed reactions on the chart.
1) Macro context: Why gold can surge on Monday
Rising geopolitical tension often drives flows into safe-haven assets like gold.
When facts are unclear and tensions escalate, the market can open with:
✅ sharp spikes, ✅ liquidity sweeps, ✅ wider spreads.
➡️ Best approach: wait for price to hit levels, then trade the reaction — not the headline.
2) Technical view (H4 – based on your chart)
Gold is currently moving inside a larger structure after a heavy move, and your chart highlights the key zones clearly:
Key zones
Sell test support 4450 (pullback area where price may get sold)
Liquidity 4330 (major liquidity magnet)
OB 4309 (order block / short-term reaction zone)
Support 4277 (intermediate support)
Buy zone 4203–4206 (deep support / swing buy area)
3) Monday trading scenarios (Liam style: trade the level)
Scenario A (priority): Spike up → SELL around 4450
✅ If gold pumps on the headline at the open:
Sell around 4450 (sell-test zone)
SL: above the most recent swing high (refine on lower TF)
TP1: 4330
TP2: 4309
TP3: 4277
Logic: Headline-driven opens often spike to sweep buy-side liquidity first, then rotate back into value/liquidity.
Scenario B: Sweep down → BUY at liquidity zones
✅ If price gets pulled down first:
Buy around 4330 (Liquidity)
Buy confirmation at 4309 (OB)
SL (guide): below 4300
TP: 4380 → 4450 (scale out)
Logic: 4330 is a major liquidity magnet and often produces a sharp reaction bounce.
Scenario C (worst-case dump): BUY the deep support 4203–4206
✅ If volatility is extreme and price flushes:
Buy: 4203 – 4206
SL: 4195
TP: 4277 → 4330
Logic: This is a deep swing-buy area if the market does a hard liquidity reset.
4) Key notes for a headline-driven Monday open
Avoid trading the first 5–10 minutes if spreads widen.
Only enter once price hits the level and shows a clear reaction (rejection / engulf / MSS on M15).
Reduce size — geopolitical opens can whip hard.
Do you think Monday’s move sweeps up into 4450 first, or drops straight into 4330 liquidity?
Paradeep Phosphate : Breakout Trade
Paradeep Phosphate is a leading Indian fertilizer manufacturer, specializing in the production of Di-Ammonium Phosphate (DAP), NPK, and other complex fertilizers. The company operates a large manufacturing facility in Odisha.
It shows a downfall of 36% from it's recent high and after a consolidation of 1 and a half month, it is now ready to shoot to the moon.
On 30/12/2025 it gives a breakout from it's range at around 166 price.
With a marketcap of 17000 cr Paradeep Phospate has already proved as a multibagger since its listing but a lot has yet to come and now is the time to kick in to get some handsome returns.

XAUUSD D1 – Liquidity Rotation in a Bullish ChannelLiquidity Rotation Inside a Strong Bullish Channel
Gold remains in a clear long-term uptrend on the daily timeframe, trading inside a well-defined ascending channel. Recent volatility, however, suggests the market is entering a liquidity-driven correction phase rather than a trend reversal.
TECHNICAL STRUCTURE
On D1, price is still respecting the rising channel, with higher highs and higher lows intact.
The rejection from the upper channel highlights profit-taking and sell-side liquidity absorption near premium levels.
Current price action suggests a rotation between upper liquidity (distribution) and lower value zones (accumulation).
KEY LIQUIDITY ZONES TO WATCH
Sell-side liquidity (premium zone):
4480 – 4485
This area represents a strong liquidity cluster near the upper channel and prior expansion highs, where price has shown clear rejection.
Buy-side liquidity (value zones):
4180 – 4185
A psychological level and mid-channel support where buyers may re-enter if price rotates lower.
4000 – 4005
Major long-term liquidity and Fibonacci confluence near the lower channel boundary, acting as a key structural support.
EXPECTED PRICE BEHAVIOUR
Short term: price may continue to fluctuate and rebalance between liquidity pools, with choppy conditions likely.
Medium term: as long as price holds above the lower channel, pullbacks are considered corrective within the broader bullish trend.
A clean rejection from sell liquidity followed by a move into buy liquidity would be a healthy reset for continuation later.
FUNDAMENTAL & GEOPOLITICAL BACKDROP
Geopolitical risk has sharply increased after former President Trump announced a large-scale US operation against Venezuela, including the arrest of President Maduro.
This event adds a new layer of uncertainty to global markets and reinforces safe-haven demand.
Historically, rising geopolitical tensions, combined with a softer US dollar environment, tend to support gold prices, especially on higher timeframes.
BIG PICTURE VIEW
Gold’s long-term bullish narrative remains intact
Current moves are driven by liquidity rotation, not weakness
Geopolitical risk could accelerate upside once the corrective phase completes
Patience remains key. Let price move between liquidity zones before committing to the next directional leg.

XAUUSD (D1) – Elliott ABC in play Lana sells the pullback, waits to buy at major liquidity 💛
Quick summary
Timeframe: Daily (D1)
Elliott view: Price is likely developing an ABC corrective structure after a strong rally
Strategy: Sell the B-wave pullback into supply, buy only when price returns to strong liquidity
Context: Precious metals started 2026 strong, but short-term volatility and re-accumulation swings are still expected
Fundamental backdrop (supports the bigger trend)
Gold and silver opened 2026 with strong momentum, extending the best run since the late 1970s. Goldman Sachs remains bullish on precious metals and continues to highlight an aggressive long-term target (around $4,900 for gold).
Lana’s key point: the long-term bull cycle can remain intact, but the market still needs healthy corrections to reset liquidity and build new structure.
Technical view (D1) – Elliott ABC structure
On the Daily chart, after the powerful top, gold dropped sharply, forming a clean Wave A. The current structure suggests:
Wave B: a corrective rebound into resistance/supply
Wave C: a potential move back down into liquidity zones before the next major direction is confirmed
This ABC lens helps avoid getting trapped when the news looks bullish, but price is still in a corrective phase.
Key levels from the chart
1) Sell zone (B-wave supply)
Sell: 4435 – 4440
This zone aligns with marked resistance and a Fibonacci pullback cluster (0.236 / 0.382). If price retraces here and shows rejection, it’s a strong area to look for B-wave selling pressure.
2) Buy zone (major liquidity – potential C-wave completion)
Buy Liquidity: 4196 – 4200
This is the strongest liquidity area on the chart. If Wave C plays out, Lana will look for buying opportunities here with clearer risk control.
3) Deeper accumulation liquidity
Accumulate liquidity: the lower accumulation area highlighted on the chart
If the market sweeps deeper than expected, this is the region where longer-term buyers may step in.
Trading plan (Lana’s approach)
Primary idea: Sell rallies into 4435–4440 if price shows weakness (B-wave rejection).
Primary buy plan: Wait for price to revisit 4196–4200 and confirm support (liquidity absorption).
If price breaks and holds above the sell zone, Lana stops selling and waits for a new structure to form.
Note on early-year behavior
The first weeks of the year often bring “messy” moves as liquidity returns and positioning resets. Lana will only trade at planned zones and avoid entries in the middle of the range.
This is Lana’s personal market view and not financial advice

GBPCAD higher bearish expecting
OANDA:GBPCAD whats next, we are have strong bearish push, currently price on sup. zone, expecting break of same and new bearish push.
SUP zone: 1.85800
RES zone: 1.82500, 1.82000

XAUUSD Long Update 01/02/2026Bases are loaded. Price has triggered all 3 Buy orders and is building momentum to the ATH.
If momentum is strong towards the all time high, I may hold. Price may go to $5K (hype and human psychology). However, the first sign of a lower low, or the failure to make a higher high—I'm out.

Advanced Algorithmic Trendline Breakout Strategies● Advanced Algorithmic Trendline Breakout Strategies: A Comprehensive Analysis of Dynamic Support/Resistance and Geometric Target Projection
● Part I: The Theoretical Architecture of Market Geometry
• 1. Introduction to Algorithmic Price Action
The intersection of classical technical analysis and modern algorithmic trading has birthed a new class of indicators that bridge the gap between subjective chart interpretation and objective mathematical execution. At the core of this evolution is the automation of the trendline—a tool as old as the Dow Theory yet as relevant as high-frequency trading algorithms. This report provides an exhaustive, expert-level analysis of a specific methodology: the automated construction of trendlines based on user-defined pivot points, the identification of breakouts via closing price confirmation, and the projection of price targets using a vertical distance metric derived from the structure's final swing point.
This methodology is not an invention of the digital age but rather a quantification of principles established by the titans of technical analysis: Robert D. Edwards, John Magee, John Murphy, and Thomas Bulkowski. By synthesizing Edwards and Magee’s geometric rigidity, Murphy’s trend-following philosophy, and Bulkowski’s statistical rigor, we establish a robust framework for identifying high-probability structural shifts in financial markets.
• 2. The Lineage of The Path of Least Resistance
To understand the efficacy of an automated trendline strategy, one must first dissect the theoretical lineage that validates the trendline as a predictive tool. The concept of the trendline is rooted in the physical laws of inertia and momentum, applied to market psychology.
• 2.1 The Dow Theory Foundation
John Murphy, in Technical Analysis of the Financial Markets, posits that the trend is the foundational concept of all technical analysis. Murphy explains that market action discounts everything, meaning that the price chart is the ultimate arbiter of truth. The trendline serves as the visual representation of the primary trend defined by Charles Dow. In an uptrend, demand consistently exceeds supply at progressively higher price levels. The trendline connects the troughs of these demand waves. As long as the price remains above this line, the physical law of inertia suggests the trend will continue.
The automated methodology described utilizes this principle by identifying Pivot Lows (in an uptrend) or Pivot Highs (in a downtrend) to anchor the trendline. This mirrors Murphy’s instruction to draw lines under significant reaction lows. However, where Murphy relied on visual inspection, the algorithm relies on specific lookback parameters to define what constitutes a significant reaction, thereby standardizing the identification of the trend across all assets and timeframes.
• 2.2 Edwards and Magee: The Geometry of Conflict
While Dow and Murphy focused on the trend's direction, Edwards and Magee formalized the geometry of the trendline. In Technical Analysis of Stock Trends, they describe the trendline as a dynamic boundary of conflict between buyers and sellers. They introduced the crucial concept that a trendline is a line of dynamic support or resistance. Unlike a horizontal support level (e.g., $100), which represents a static price memory, a trendline represents a time-dependent price memory.
In a rising market, the value buyers place on an asset increases with time. A trendline sloping upward at a 45-degree angle indicates that the market demands a specific rate of price appreciation to maintain bullish sentiment. The automated indicator’s logic—extending a line infinitely to the right based on two points—is a direct application of this geometric theory. It creates a line in the sand that moves. If price fails to keep up with the slope of the line (i.e., breaks below it), it signals a deceleration of momentum that Edwards and Magee classify as a potential reversal signal.
• 2.3 Bulkowski’s Statistical Empiricism
Thomas Bulkowski revolutionized the field by testing these classical theories against vast datasets. His Encyclopedia of Chart Patterns moves beyond the anecdotal evidence of Edwards and Magee to provide statistical probabilities. Bulkowski’s work is essential to the Target Projection component of this methodology. He established that patterns like wedges, triangles, and flags have predictable failure rates and measure rules.
The methodology’s reliance on the vertical distance for target calculation is a generalized application of Bulkowski’s findings on Measured Moves. Bulkowski observed that the volatility inherent in the pattern (represented by its height) is often replicated in the breakout move. By automating this measurement, the indicator moves from a discretionary guesstimate to a statistically grounded projection.
• 3. The Geometry of Trendline Construction
The automated generation of trendlines requires precise definitions of points and lines that can be executed by code. This section explores the mathematical mechanics used by the indicator and their theoretical implications.
• 3.1 Pivot Point Identification Logic
The script constructs the trendline by connecting two distinct points in time. These are not arbitrary points but Pivots or Swing Points.
Definition: A Pivot High is a candle that has a higher high than the N candles preceding it and the N candles following it. A Pivot Low is the inverse.
User Input: The snippet references Start Date and End Date inputs. This implies a semi-automated approach where the trader identifies the region of interest, and the algorithm snaps the trendline to the exact mathematical extremes (High or Low) within those timestamps.
This Hybrid approach solves a major issue in algorithmic trading: context. A fully automated script might draw trendlines across every minor fluctuation. By allowing user input for the anchor points, the tool leverages human pattern recognition (identifying the Forest) while using algorithmic precision for the execution (identifying the Trees and calculating the exact slope).
• 3.2 The Slope and Infinite Extension
Once the two pivots (P1 at t1, P2 at t2) are locked, the algorithm calculates the linear equation of the trendline:
y = mx + c
Where:
m (slope) = (Price2 - Price1) / (Time2 - Time1)
x is the current time index.
c is the y-intercept.
The crucial feature described in the research is the infinite extension to the right. This extension transforms the historical line into a future-predictive tool. It allows the trader to see where the price must be at a future time tn to maintain the trend.
Wedge Construction: In a wedge pattern, two trendlines converge. The automated extension allows the user to define the upper resistance line independently of the lower support line. As time progresses, the gap between price and this extended line narrows, decreasing volatility and increasing the probability of a violent breakout—a phenomenon described by Bulkowski as coiling.
• 3.3 Logarithmic vs. Arithmetic Scaling
A nuance often overlooked but critical in Edwards and Magee’s work is the scale of the chart. They heavily favored semi-logarithmic charts for long-term trend analysis because a straight line on a log chart represents a constant percentage rate of change.
Algorithmic Implication: While most simple scripts use arithmetic calculations (Price2 - Price1), advanced implementations of this methodology (as hinted at in market geometry references) may need to account for log-scale slopes, especially for long-term targets. However, for the vertical distance calculation method described (measuring price difference at a specific bar), the arithmetic difference is the standard convention in modern coding (Pine Script/Python).
• 4. Dynamic Support and Resistance Mechanics
The trendline created is not just a visual aid; it is a functional barrier.
Bullish Trendline: Connects Pivot Lows. Acts as dynamic Support.
Bearish Trendline: Connects Pivot Highs. Acts as dynamic Resistance.
The dynamic nature implies that the support level rises with every new candle (in an uptrend). This puts constant pressure on the bears. If they cannot push price down fast enough, the rising support line will eventually intersect with the current price, forcing a decision. This interaction is the Trigger Event for the strategy.
● Part II: The Mechanics of the Breakout
• 5. Defining the Breakout Event
In classical analysis, a breakout is subjective. Edwards and Magee speak of decisive penetrations. The automated methodology rigorously defines this using boolean logic.
• 5.1 The Close vs. Wick Debate
The research material explicitly states that a breakout is identified based on closing prices.
The Trap of Wicks: Intraday price action often pierces trendlines due to temporary liquidity sweeps or stop-hunting algorithms. These are false breakouts. A wick above a resistance line shows that buyers pushed price there, but sellers were strong enough to push it back down before the close.
The Commitment of the Close: A closing price beyond the trendline indicates that the market sentiment has fundamentally shifted. Buyers (in a bullish breakout) were willing to hold the asset at a higher valuation through the end of the session.
Murphy’s Rule: John Murphy emphasizes that a closing price filter (e.g., requiring a 3% penetration or a two-day close) significantly reduces whipsaws. The automated script simplifies this to a single bar close logic:
Signal = Close > TrendlineValue
This binary condition (True/False) allows the script to print a BC (Breakout Candle) label instantly, providing the trader with an actionable signal that removes hesitation.
• 5.2 Volume Confirmation
Snippet 16 and 17 highlight the necessity of volume. A breakout on low volume is suspect. The Edwards and Magee standard requires an increase in volume on upside breakouts.
Algorithmic Integration: While the primary trigger is price, the most robust versions of this indicator likely include a volume condition (e.g., Volume > SMA(Volume, 20)). This aligns with Bulkowski’s finding that breakouts with above-average volume are less likely to experience a failure or a deep throwback.
• 5.3 The Throwback and Pullback Phenomenon
Bulkowski’s statistics are vital here. He notes that after a breakout, price returns to the trendline (Throwback) in approximately 40-60% of cases, depending on the pattern.
Methodology Handling: The automated target logic (discussed in Part III) is static once the breakout occurs. This is crucial because if a throwback occurs, the trendline value has changed (it has moved higher/lower). By locking in the targets at the moment of the breakout candle, the algorithm provides a fixed reference point for the trader to manage risk during the chaotic throwback phase.
• 6. Breakout Filters and False Signals
To further refine the signal, the methodology references concepts like Change of Character (CHOCH) and Liquidity Sweeps.
• 6.1 Change of Character (CHOCH)
Snippet 19 and 11 mention an optional CHOCH module. This concept, popular in Smart Money Concepts (SMC), looks for the breach of a prior swing high/low in addition to the trendline break.
Confluence: If a bearish trendline is broken (price goes up), AND the price also breaks above the most recent significant Pivot High (CHOCH), the probability of a sustained reversal increases. This aligns with Dow Theory’s requirement for a pattern of higher highs to confirm a new uptrend.
• 6.2 The Busted Pattern Strategy
Bulkowski identifies a specific scenario called a Busted Pattern: when a breakout occurs, moves less than 10%, and then reverses to break the other side of the pattern. These often result in powerful moves in the reverse direction. While the core indicator focuses on the initial breakout, understanding this failure mode is essential for risk management (Stop Loss placement).
● Part III: The Vertical Distance Target Projection Model
• 7. Theoretical Derivation of the Target
The most distinctive feature of this methodology is its target calculation: Projecting the vertical distance between the breakout line and the last pivot. This differs from the standard Pattern Height rule in subtle but significant ways.
• 7.1 The Measure Rule vs. Last Pivot Logic
Classic Measure Rule (Triangles/Wedges): Edwards and Magee typically measure the widest part of the triangle (the base) and project that from the breakout.
Automated Method: Measures the distance at the Last Pivot before the breakout.
Why the distinction?
In a converging pattern like a wedge or triangle, volatility is compressing. The widest part represents volatility from weeks or months ago. The Last Pivot represents the current volatility state immediately preceding the breakout.
Volatility Compression: As the price coils into the apex, the energy available for the initial thrust is often proportional to the most recent swing. Using the Last Pivot provides a more conservative and highly probable target (Target 1) compared to the widest part, which might be an overestimation in a low-volatility environment.
• 7.2 Mathematical Formula for Target Calculation
Let t_break be the time of the breakout candle.
Let P_break be the closing price of the breakout candle (or the trendline value).
Let P_pivot be the price of the most recent significant swing point (High or Low) at time t_pivot.
Let L(t) be the value of the trendline at time t.
Step 1: Calculate Vertical Distance (D)
The distance is measured strictly vertically at the time index of the pivot.
D = | P_pivot - L(t_pivot) |
Crucially, this uses the trendline value at the historical pivot time, not the current time.
Step 2: Project Targets (T)
The distance D is projected from the Trendline value at the breakout point (or the breakout price itself, depending on specific script implementation).
Target 1 (1.0x): T1 = P_break +/- (D x 1.0)
Target 2 (1.618x): T2 = P_break +/- (D x 1.618)
Target 3 (2.618x): T3 = P_break +/- (D x 2.618)
• 7.3 Fibonacci Harmonics
The use of 1.618 (Golden Ratio) and 2.618 multipliers aligns the strategy with harmonic trading theory. Bulkowski often references Fibonacci extensions as secondary targets when the primary measure rule is exceeded.
Target 1 represents the Measured Move (Symmetry).
Target 2 represents the Extension (Momentum run).
Target 3 represents the Exhaustion (Statistical outlier).
• 8. Comparative Analysis of Target Methods
The following table contrasts the Vertical Distance at Last Pivot method with other classical targeting methods referenced in the literature.
Method: Widest Base
Source: Edwards & Magee
Measurement Basis: Widest part of pattern (start of trendlines).
Projection Point: Breakout Point
Pros: Captures full potential of the structure.
Cons: Can be overly ambitious for late breakouts; ignores volatility compression.
Method: Flagpole
Source: Murphy
Measurement Basis: Entire preceding trend leg (Flagpole).
Projection Point: Breakout Point
Pros: Best for Bull Flags/Pennants.
Cons: Often overestimates targets for Reversal patterns (like wedges).
Method: Last Pivot (Vertical)
Source: Automated Method
Measurement Basis: Distance from Trendline to Last Swing.
Projection Point: Breakout Point
Pros: Adjusts for recent volatility; higher probability T1.
Cons: May underestimate the move in explosive breakouts (requires T2/T3).
Method: Percent Decline
Source: Bulkowski
Measurement Basis: Percentage drop/rise of prior trend.
Projection Point: Breakout Price
Pros: Statistically robust across large datasets.
Cons: Harder to automate visually on a chart compared to geometric lines.
• 9. Intraday vs. Swing Targets
The methodology applies to both intraday and swing trading.
Intraday: The Last Pivot method is superior because intraday volatility changes rapidly (e.g., opening range vs. lunch hour). Measuring the most recent swing captures the immediate liquidity conditions better than a pivot from 4 hours ago.
Swing/Daily: On daily charts, the Widest Base method of Edwards and Magee often aligns with the Last Pivot method if the pattern is a Rectangle or Channel (where width is constant). It only diverges significantly in Triangles.
● Part IV: Pattern-Specific Applications and Analysis
The automated trendline tool is pattern-agnostic—it simply sees a line and a pivot. However, the trader applies it to specific structures. This section analyzes how the tool performs on the specific patterns mentioned in the research.
• 10. The Wedge (Rising and Falling)
Wedges are defined by converging trendlines with a distinct slope against the prevailing trend.
Falling Wedge (Bullish): Resistance line slopes down; Support line slopes down (steeper).
Automated Setup: User draws the Resistance Trendline connecting lower highs.
Target Logic: The Last Pivot is the most recent Lower Low.
Bulkowski Stat: Falling wedges break upward 69% of the time.
Nuance: Because wedges converge, the Last Pivot distance is naturally smaller than the Base. This makes the automated Target 1 very achievable. Snippet 16 shows a specific example of a Wedge in Tata Motors where the target was exactly hit using the High minus Low difference, validating the math.
• 11. The Bump and Run Reversal (BARR)
This is a proprietary pattern identified by Thomas Bulkowski. It consists of three phases:
Lead-in: A steady trend (30-45 degrees).
Bump: A rapid acceleration (speculative excess) moving price far away from the trendline.
Run: The reversal after the trendline break.
Applying the Automated Tool to BARR:
Construction: The user draws the trendline along the Lead-in phase pivots.
The Vertical Distance Check: Bulkowski validates the pattern by measuring the vertical distance of the Bump height. It must be at least 2x the height of the Lead-in height.
Target: The automated tool is perfect for this. The Last Pivot corresponds to the Bump High.
D = Height of Bump.
Target = Breakout Price - D.
This implies a full retracement of the speculative bump, which is exactly Bulkowski’s target for this pattern.
• 12. Triangles (Symmetrical, Ascending, Descending)
Symmetrical Triangle: Indecision. Breakout can be either way.
The 50-75% Rule: Snippet 17 emphasizes that breakouts are most reliable when they occur 50-75% of the way to the apex.
Automated Filter: If the user sets the trendline, the visual proximity of the Last Pivot to the breakout point tells the story.
If D is tiny, the breakout is near the apex (late). Targets will be small.
If D is large, the breakout is early (potentially premature).
The Sweet Spot generates a moderate D and a high-probability Target 1.
• 13. Flags and Pennants
These are continuation patterns.
Edwards & Magee: The Flag flies at half-mast. The move after the flag equals the move before (Flagpole).
Automated Adaptation: The tool measures the flag's width.
Target 1 (1x Width): A scalper's target inside the trend.
Target 3 (2.618x Width): Often approximates the full Flagpole height.
Insight: This highlights the utility of the multi-target system. T1 ensures money is banked if the trend fails; T3 captures the classical Measured Move of the Flagpole.
● Part V: Statistical Validation, Risk Management, and Coding
• 14. Statistical Reliability (The Bulkowski Data)
No technical analysis report is complete without addressing failure rates. Bulkowski’s data provides the reality check for the geometric projections.
• 14.1 Pattern Success Rates (2025 Data)
The research snippets provide updated statistics for 2025:
Head and Shoulders: 89% accuracy (when confirmed).
Double Bottoms: 88% success in bull markets.
Symmetrical Triangles: 76% success in direction of trend.
Bull Flags: 91.5% success rate (highest reliability).
These high success rates validate the Breakout signal. However, success is often defined as a 5% move, not necessarily hitting the full target. This is why the Target 1 (1:1) rule of the automated indicator is so effective—it aims for a statistically probable move rather than a home run.
• 14.2 The Busted Opportunity
If a pattern fails (e.g., a Bull Flag breaks up, hits T1, then collapses), it becomes a Busted Pattern. Bulkowski found that busted patterns have higher average gains than standard patterns because the trapped traders provide fuel for the reversal.
Strategy: If price reverses and closes back below the trendline after triggering a breakout, the automated system’s signal is invalidated. Advanced traders reverse their position immediately, targeting the opposite side pivot.
• 15. Risk Management: Stop Loss Placement
Where does the stop loss go?
Method A (Conservative): Below the Last Pivot used for the calculation.
Logic: If price breaks the trendline but then takes out the pivot that created the setup, the structure is broken (Dow Theory violation).
Risk/Reward: Since Target 1 is calculated using distance D (Trendline to Pivot), placing the stop at the Pivot means the Risk is D.
Result: A perfect 1:1 Risk/Reward Ratio for Target 1.
Method B (Aggressive): Just below the trendline or the breakout candle.
Logic: Minimizes risk.
Danger: High susceptibility to Throwbacks (40-60% probability).
The report recommends Method A for swing trading (to survive the throwback) and Method B only for high-momentum scalping.
• 16. Algorithmic Implementation Challenges
Translating this theory into code (e.g., Pine Script) involves specific challenges.
• 16.1 Repainting
The script must leverage confirmed pivots. If the script uses a pivothigh function with rightbars=5, the pivot is only confirmed 5 bars after it happens.
Solution: The trendline is drawn retrospectively, but the breakout is real-time. The script must ensure that the Last Pivot index is stable before the breakout candle closes.
• 16.2 Parameter Sensitivity
The lookback period for pivot detection determines the scale of the trendline.
Short Lookback (e.g., 5 bars): Catches micro-trends. Targets are small. High noise.
Long Lookback (e.g., 20 bars): Catches major structural trends. Targets are large. Fewer signals.
Recommendation: Users should align the lookback with the timeframe (e.g., 5 on Daily chart, 20 on 1-minute chart) to capture relevant liquidity sweeps.
• 17. Conclusion: The Synthesis of Old and New
The automated trendline breakout strategy is a testament to the enduring validity of classical technical analysis. By automating the insights of Edwards and Magee (dynamic support/resistance), adhering to the filters of John Murphy (closing price confirmation, volume), and applying the statistical rigor of Thomas Bulkowski (measured move targets, failure rates), the methodology transforms subjective art into objective science.
The Vertical Distance to Last Pivot calculation stands out as a robust, volatility-adaptive metric that provides realistic profit objectives. Whether applied to a Bulkowski Bump and Run or a classic Murphy Flag, the logic holds: Energy accumulated during the compression (Pivot Distance) is released during the expansion (Target).
For the modern trader, this tool does not replace analysis; it standardizes it. It ensures that every breakout traded adheres to the same geometric rules, allowing for consistent risk management and performance tracking—the ultimate goal of any professional trading system.
● Appendix: Data Tables and Reference Summaries
• Table 1: Comparative Breakout Statistics (Source: Bulkowski & 2025 Data)
Pattern Type: Head & Shoulders | Breakout Direction: Down | Success Rate: 89% | Avg. Throwback Rate: ~45-50% | Target Reliability (T1): High
Pattern Type: Bull Flag | Breakout Direction: Up | Success Rate: 91.5% | Avg. Throwback Rate: Low | Target Reliability (T1): Very High
Pattern Type: Sym. Triangle | Breakout Direction: Trend Continuation | Success Rate: 76% | Avg. Throwback Rate: Moderate | Target Reliability (T1): Moderate (depends on apex proximity)
Pattern Type: Falling Wedge | Breakout Direction: Up | Success Rate: 69% | Avg. Throwback Rate: Low | Target Reliability (T1): High
Pattern Type: Bump & Run | Breakout Direction: Reversal | Success Rate: Variable | Avg. Throwback Rate: Low (Violent Move) | Target Reliability (T1): Very High (for T1)
• Table 2: Target Projection Multipliers
Target Level: T1 | Multiplier of Distance (D): 1.0 | Theoretical Basis: Geometric Symmetry / Measured Move | Usage Case: Primary Take Profit (Conservative)
Target Level: T2 | Multiplier of Distance (D): 1.618 | Theoretical Basis: Golden Ratio Extension | Usage Case: Strong Trends / Runners
Target Level: T3 | Multiplier of Distance (D): 2.618 | Theoretical Basis: Deep Harmonic Extension | Usage Case: Climactic / Blow-off Tops
• Table 3: Filter Logic Summary
Filter Name: Close Filter | Condition: Close > Trendline | Source Justification: Edwards & Magee / Murphy (Avoid wicks/noise)
Filter Name: Volume Filter | Condition: Vol > AvgVol | Source Justification: Murphy / Bulkowski (Confirm institutional participation)
Filter Name: Pivot Filter | Condition: Pivot > Previous Pivot | Source Justification: Dow Theory (Trend definition)
Filter Name: Time Filter | Condition: 50-75% to Apex | Source Justification: Bulkowski (Avoid dead zones in triangles)

XAUUSD H1 – Liquidity Controls the Pullback Liquidity-Driven Correction Inside a Broader Bullish Narrative
Gold is entering a technically sensitive phase after an explosive rally. While the long-term narrative remains bullish, short-term price action suggests the market is rotating around liquidity and Fibonacci extension levels rather than trending cleanly.
TECHNICAL OVERVIEW
On H1, price has transitioned from an ascending channel into a corrective structure, indicating distribution after a strong impulsive leg.
The recent sell-off broke short-term support, but downside momentum is now slowing as price approaches liquidity clusters.
Current behaviour favours range rotation and liquidity hunts instead of straight-line continuation.
PRIORITY SCENARIO – SELL ON RALLIES
Focus on selling into strong liquidity and Fibonacci extensions
Primary sell zone: 4505 – 4510
Confluence of strong liquidity and Fibonacci 2.618 extension
Secondary sell zone: 4230 – 4235
Fibonacci 1.618 extension and prior reaction zone
Expected behaviour:
Price rebounds into these upper liquidity areas, fails to reclaim structure, and rotates lower as sellers defend premium levels.
ALTERNATIVE SCENARIO – BUY FROM LIQUIDITY SUPPORT
If downside liquidity is fully absorbed, look for selective long setups
Buy liquidity zone: 4347 – 4350
This area represents short-term value where price may stabilise and attempt a corrective bounce before the next directional decision.
KEY TECHNICAL INSIGHTS
The current move is best viewed as a technical correction, not a long-term trend reversal.
Liquidity zones and Fibonacci extensions are acting as the primary decision points.
Chasing price between zones offers poor risk-to-reward; execution should be level-based.
MACRO CONTEXT – WHY GOLD REMAINS SUPPORTED
The surge in gold prices throughout 2025 revealed what markets increasingly suspect:
Rising geopolitical instability
A structurally weaker US dollar
Persistent safe-haven demand
Gold posted its strongest annual gain in 46 years, echoing the late-1970s bull market. While central banks may avoid highlighting these pressures, price action continues to reflect growing systemic uncertainty.
This macro backdrop supports gold in the medium to long term, even as short-term corrections unfold to rebalance positioning.
SUMMARY VIEW
Short term: trade the correction via liquidity and Fibonacci zones
Medium to long term: bullish narrative remains intact
Best edge comes from patience and execution at key levels, not directional bias alone
Let price come to liquidity — that’s where decisions are made.

XAUUSD (H1) – Early 2026 OutlookShort-term recovery inside a larger bullish cycle 💛
Quick market recap
2025 performance: Gold surged ~64%, the strongest annual gain since 1979
Recent move: Sharp year-end correction driven by profit-taking and margin adjustments, not trend reversal
Big picture: The multi-year bull market in precious metals remains intact
Fundamental context (why the trend still matters)
Despite the late-2025 pullback, the broader precious metals complex remains structurally strong. Gold, silver, platinum, and palladium all benefited from:
Fed rate-cut cycle expectations
Persistent geopolitical tensions
Strong central bank buying
Industrial demand and supply constraints (especially for silver and platinum)
Most analysts agree the recent correction was technical in nature. The long-term outlook still points toward gold potentially testing 5,000 USD/oz and silver approaching 100 USD/oz in 2026, although short-term volatility is expected to remain high.
Technical view (H1) – Based on the chart
After failing to hold above the ATH, gold experienced a sharp bearish displacement, followed by a stabilization phase near a strong support zone. Price is now attempting a recovery, but the structure suggests this is still a corrective move within a broader range.
Key observations:
Strong sell-off broke short-term bullish structure
Price is rebounding from major support, forming a potential higher low
Overhead liquidity and Fibonacci zones remain key reaction areas
Key levels Lana is watching
Buy zone – Strong liquidity support
Buy: 4345 – 4350
This is a strong liquidity zone where price already reacted. If price revisits this area and holds structure, it offers a favorable risk-to-reward buy aligned with the larger bullish cycle.
Sell zone – Short-term resistance (scalping)
Sell scalping: 4332 – 4336
This zone aligns with short-term resistance and Fibonacci reaction levels. If price fails here, a brief pullback toward support is possible.
Important overhead liquidity
Key liquidity: 4404 area
A clean break and hold above this level would signal stronger bullish continuation toward higher targets.
Scenarios to consider
Scenario 1 – Range correction continues
Price reacts at short-term resistance, rotates back into liquidity, and builds a base before the next directional move.
Scenario 2 – Bullish continuation resumes
A break above overhead liquidity opens the path toward higher levels, potentially retesting prior highs as the new year unfolds.
Lana’s approach 🌿
Trade zones, not headlines
Focus on price reaction at liquidity levels
Accept short-term volatility while respecting the long-term bullish structure
This analysis reflects Lana’s personal market view and is not financial advice. Please manage risk carefully and trade responsibly 💛

4 Continuation Patterns Every Trader Must KnowWelcome back to another Mubite educational guide.
In trading, trends rarely move in a straight line. They pause, take a breath, and consolidate
before pushing forward. Unfortunately, many amateur traders mistake these healthy pauses for
reversals and panic-sell their positions too early.
To maximize your profits, you must learn to identify Continuation Patterns . These specific formations signal that the market is simply resting and the prevailing trend is about to resume.
Mastering these allows you to ride the trend to its full potential.
Here are the top 4 patterns you need to master.
1. The Rising Three Methods (Bullish)
This is a powerful pattern that occurs during a sustained uptrend. It represents a pause where
bulls take a break, but bears fail to push the price down significantly.
Structure:
1. Long Bullish Candle: A large green candle in line with the uptrend.
2. Three Small Bearish Candles: Three small red bodies that stay within the high
and low range of the first candle.
3. The Breakout Candle: A final large bullish candle that closes above the close of
the first candle.
● Psychology: The small pullback tricks weak hands into selling, but buyers step back in
with force, confirming the uptrend is still alive.
2. The Falling Three Methods (Bearish)
The opposite of the Rising Three, this pattern occurs in a downtrend and signals that selling
pressure is far from over.
Structure:
1. Long Bearish Candle: A large red candle in line with the downtrend.
2. Three Small Bullish Candles: Three small green bodies that retrace slightly but
stay within the range of the first candle.
3. The Breakout Candle: A final large bearish candle that closes below the close of
the first candle.
● Psychology: Sellers take profits, causing a small bounce, but buyers lack the conviction
to reverse the trend. Sellers return to push prices to new lows.
3. The Tasuki Gap (Upside & Downside)
Gaps are significant in price action. The Tasuki Gap is a unique continuation pattern that uses a
gap to confirm trend strength.
Upside Tasuki Gap (Bullish): A bullish candle is followed by another bullish candle that
"gaps up." The third candle is bearish and closes into the gap but does not close it
completely.
Signal: If the gap remains open, it acts as support. The trend is still up.
Downside Tasuki Gap (Bearish): A bearish candle is followed by another bearish
candle that "gaps down." The third candle is bullish and closes into the gap but does not
fill it.
Signal: The unfilled gap acts as resistance. The trend is still down.
4. Mat Hold Pattern (Bullish)
This is arguably one of the strongest continuation signals in Crypto and Forex trading. It is very
similar to the Rising Three Methods but shows even stronger bullish pressure.
● Structure: A long bullish candle is followed by a gap up and three small candles that
drift lower but stay well above the open of the first candle. A final large candle
continues the uptrend.
● The Difference: In a Mat Hold, the pullback is shallow (usually staying in the upper half
of the first candle's range), showing that bears have almost no power to push price
down.
3. The Tasuki Gap (Upside & Downside)
Gaps are significant in price action. The Tasuki Gap is a unique continuation pattern that uses a
gap to confirm trend strength.
● Upside Tasuki Gap (Bullish): A bullish candle is followed by another bullish candle that
"gaps up." The third candle is bearish and closes into the gap but does not close it
completely.
○ Signal: If the gap remains open, it acts as support. The trend is still up.
● Downside Tasuki Gap (Bearish): A bearish candle is followed by another bearish
candle that "gaps down." The third candle is bullish and closes into the gap but does not
fill it.
○ Signal: The unfilled gap acts as resistance. The trend is still down.
4. Mat Hold Pattern (Bullish)
This is arguably one of the strongest continuation signals in Crypto and Forex trading. It is very
similar to the Rising Three Methods but shows even stronger bullish pressure.
● Structure: A long bullish candle is followed by a gap up and three small candles that
drift lower but stay well above the open of the first candle. A final large candle
continues the uptrend.
● The Difference: In a Mat Hold, the pullback is shallow (usually staying in the upper half
of the first candle's range), showing that bears have almost no power to push price
down.
__________________________________________________________________________________
TRADING TIP: Context is King
Just like reversal patterns, continuation patterns must be traded with intent.
1. Volume Analysis: Look for lower volume during the "pause" (the small middle candles)
and exploding volume on the breakout candle.
2. Trend Confirmation: These patterns only work if there is an established trend. Do not
look for them in a chopping/ranging market.
__________________________________________________________________________________
Disclaimer: This analysis by Mubite is for educational purposes only and does not constitute
financial advice. Always manage your risk.
Which of these 4 patterns do you see most often on the Bitcoin chart? Let us know in the
comments below!

EUR/USD Is Compressing — The Breakout Direction EUR/USD – 1H MARKET ANALYSIS
Market Context
EUR/USD is currently trading inside a clear range structure, bounded by a defined support zone below and a major resistance zone above. The market is transitioning from a corrective phase into a potential re-accumulation leg.
1. Price Structure
Price recently reacted strongly from the support zone, confirming this area as active demand.
The pullback held above EMA 89, while price is attempting to reclaim EMA 34, suggesting selling pressure is weakening.
The overall structure remains higher low–based, meaning the bullish structure is still valid unless support fails.
2. Moving Average Context
EMA 34 (short-term): Acting as dynamic resistance; a clean reclaim would signal momentum shift.
EMA 89 (mid-term): Continues to act as dynamic support, confirming that the market is not bearish.
Compression between price and EMAs indicates energy building for the next expansion.
3. Key Zones
Support Zone: Strong buyer reaction area; loss of this zone would invalidate the bullish setup.
Resistance Zone: Previous supply area where sellers previously stepped in; this is the main upside objective.
4. Scenarios & Outlook
Primary Scenario – Bullish Continuation (Preferred)
Price holds above the support zone.
Gradual push higher with higher lows.
Upside targets:
First: reclaim mid-range liquidity
Final: test of the resistance zone
Alternative Scenario – Range Extension
Price consolidates between EMA 34 and support.
Sideways movement before expansion.
Invalidation Scenario
Strong H1 close below the support zone.
This would open the door for deeper downside and trend reassessment.
5. Trading Bias
Bias: Mild bullish
Strategy: Buy pullbacks near support, avoid chasing price mid-range
Risk Note: Confirmation is required near resistance — do not anticipate breakouts blindly
Summary
EUR/USD is stabilizing after a pullback, showing signs of renewed demand. As long as price remains above the support zone, the market favors a push toward the resistance area. Discipline and patience remain key in this range-based environment.

Bitcoin Is Coiling — The Next Move Won’t Be QuietBITCOIN (BTC/USD) – 4H MARKET ANALYSIS
Market Structure Overview
- Bitcoin is currently trapped in a well-defined range on the H4 timeframe.
- Price is oscillating between a major resistance zone around 90,000–90,500 and a strong support zone around 86,500–87,000.
- Repeated rejections at resistance and consistent reactions from support confirm a classic consolidation / distribution range.
Key Technical Observations
- Each push into the resistance zone is met with strong selling pressure, indicating supply dominance at higher levels.
- Sellers, however, are failing to break decisively below support, suggesting buyers are still absorbing liquidity.
- The repeated zig-zag structure inside the range shows liquidity being built, not trend continuation yet.
- Volume remains relatively muted compared to impulsive legs → typical behavior before a -volatility expansion.
Scenarios to Watch
Bullish Breakout Scenario
A clean breakout and acceptance above 90,500 could trigger a strong upside expansion, opening the path toward 92,000–94,000.
This would confirm accumulation and invalidate the current range.
Bearish Breakdown Scenario
A decisive break below 86,500 would shift the structure into a deeper corrective phase.
In that case, downside momentum could accelerate quickly as range support fails.
Trading Bias & Strategy
Neutral bias while inside the range.
Best strategy: trade reactions at the edges of the range, not the middle.
For swing positioning, patience is key — wait for a confirmed breakout with volume before committing size.
Conclusion
Bitcoin is not trending it is preparing.
The longer the range holds, the stronger the eventual breakout.
Stay disciplined, protect capital, and let the market reveal direction before acting.

EURUSD Is Coiling — One Clean Break Will Decide the Next MoveEURUSD (1H)
1) Market Structure
Price is in a sideways accumulation range after a prior bullish leg.
Repeated higher reactions from the same base indicate buyers are absorbing supply near support.
Upper wicks near 1.1800+ show sell pressure overhead → market needs a clean break to expand.
2) Key Levels
Support Zone: 1.1760 – 1.1770
Structural base of the range. Holding this zone keeps bullish scenarios valid.
Target 1 / Resistance: 1.18040
First breakout trigger. Needs a clear H1 close above to confirm strength.
Target 2 / Resistance: 1.18197
Range ceiling. Acceptance above this level confirms a true breakout.
3) Trading Scenarios
Scenario A (Preferred): Buy from Support
Condition: Price sweeps 1.1760–1.1770 and reclaims 1.1775–1.1780 with rejection.
Targets:
TP1: 1.18040
TP2: 1.18197
Scenario B (Breakout Buy):
Condition: H1 close above 1.18040, followed by a shallow pullback holding above 1.1800.
Target: 1.18197, then reassess for extension.
Invalidation:
A clean H1 close below the support zone invalidates bullish structure and opens downside risk.
4) Macro Drivers to Watch
USD strength: Rising US yields, hawkish Fed tone, strong US data → EURUSD capped or pushed lower.
EUR strength: ECB staying restrictive, improving Eurozone data, risk-on sentiment → supports breakout.
High-impact catalysts: CPI, PCE, NFP, PMI, FOMC/ECB speeches, and moves in DXY & US10Y.

XAUUSD LongGold made an all time high then sharply corrected.
The previous swing levels (marked by blue boxes) were the most recent levels that price pushed from in the higher time frame uptrend. If the uptrend is to continue from here these levels should be respected.
The indication (break-out) gave me my target. The break of the previous swing high gave me my BSO entry. The swing low gave me my BLO entry, and my Stop Loss is where price would break structure—suggesting that I would be wrong about this trade, so exiting would be wise.
I also bought the middle of the range in this case because I liked the structure and I'm not sure if I'll get my BLO opportunity.

XAUUSD H1 – Short-Term SELL Opportunity Looking for a Short-Term SELL Move Inside the Uptrend Channel
Gold is entering a technical pullback phase after losing momentum near the upper boundary of the rising channel. For today, the focus is to look for short opportunities on reactions, using Volume Profile levels and the recent break of short-term support.
TECHNICAL CONTEXT
On H1, price is still inside a rising channel, but the market has shown a clear loss of short-term bullish structure, signalling profit-taking pressure.
The POC–VAH area above is now acting more like a sell-on-rally zone rather than an immediate continuation point.
Weak rebounds during the Asian session can offer better timing for short setups in a corrective phase.
PRIORITY SCENARIO – MAIN PLAN
Sell the pullback into value
Primary sell zone: 4497 – 4500 (Sell VAH)
Confirmation sell zone: 4465 – 4468 once price confirms a break of support during the Asian session
Expected behaviour:
Price rebounds into high-volume areas, shows rejection, then continues lower toward the next liquidity pocket.
CORRECTION TARGETS
Nearest support: around 4431
Potential buy zone: 4399 – 4396 (Fibonacci extension 1.618 plus lower-channel support)
This area is a key liquidity confluence where a bullish reaction could appear and the corrective move may complete.
WHY THE SELL IDEA MAKES SENSE
H1 structure shows short-term momentum fading
Volume Profile highlights the POC–VAH region as a high-probability sell-on-rally area
This move is treated as a correction within a broader bullish trend, not a long-term reversal
MACRO BACKDROP AND USD
The US Dollar Index (DXY) has extended its weekly decline for three straight sessions, reaching the lowest levels since early October. Key drivers include:
US CPI for November coming in weaker than expected
Signs of cooling in the US labour market
Rising expectations that the Fed could deliver two additional rate cuts in 2026
A softer USD supports gold in the medium to long term, but short-term technical corrections remain normal as the market rebalances.
SUMMARY VIEW
Priority is to sell rallies into 4497–4500 and 4465–4468
The downside move is viewed as a technical correction
Watch 4399–4396 closely for a potential bullish reaction and end of the pullback

XAUUSD (H1) – Early-week SELL bias Sharp drop from ATH, look to sell the pullback into resistance & liquidity
Strategy summary
Gold opened the week with a fast sell-off (roughly a $20 drop intraday), signalling strong profit-taking after the All-Time High sweep. With the current structure, my focus is SELL on pullbacks, using the trendline / resistance zones and nearby liquidity clusters as execution areas.
1) Technical read (H1 – based on your chart)
All-Time High remains a major psychological ceiling. After an ATH sweep, a corrective leg is common.
Price is trading below the Buyside Liquidity band, which often gets retested before the next directional move.
Key levels on your chart:
Sell zone: 4494 – 4497 (main pullback sell area)
Strong Liquidity: around 4474 (reaction / decision point)
Lower liquidity supports: 4441 – 4444 and 4403 – 4406 (areas to watch for reactions)
2) Trade plan (Liam style: trade the level)
Scenario A (priority): SELL the pullback
✅ Sell zone: 4494 – 4497
SL (guide): above the zone (refine on lower TF / spread)
TP1: 4474
TP2: 4441 – 4444
TP3: 4403 – 4406
Logic: This is a clean resistance / pullback area. Selling the reaction is safer than chasing shorts at the lows.
Scenario B: BUY reaction at lower liquidity (scalp only)
If the sell leg extends into support, you can consider a short-term bounce trade:
Buy: 4441 – 4444 (quick reaction zone)
Deeper buy: 4403 – 4406 (better value zone)
Only take buys with clear holding signals on lower timeframes — no catching falling knives.
3) Macro context (news) – why gold is swinging
The sharp move lower suggests markets are re-pricing risk after an extended rally.
US–Israel tensions are elevated, with Trump and Netanyahu reportedly clashing over Gaza, Iran and post-war order — geopolitical risk can trigger fast liquidity-driven swings.
In headline-driven sessions, gold often runs a two-step pattern: liquidity sweep → correction → direction. That’s why I’m sticking to level-based execution and avoiding FOMO.
4) Risk notes
Don’t chase shorts during heavy red candles.
Focus on 4494–4497 for shorts and scale out at the TP levels.
Max risk per trade: 1–2%.
What’s your bias for this week: selling the 4494–4497 pullback, or waiting for 444x/440x to buy a reaction bounce?
