GOLD → Retest of trend resistance before declineFX:XAUUSD is recovering amid uncertainty, but there is a fairly strong resistance zone ahead that could hold back growth and trigger a decline...
Since the opening of the session, the price has recovered slightly after a week-long decline. Growth is being held back by two-sided risks: on the one hand, pressure on the dollar and Moody's downgrade of the US credit rating are supporting the metal, while on the other hand, high bond yields and possible US trade agreements are limiting growth.
Investors are awaiting new statements from the Fed and are monitoring US negotiations with key partners. Amid concerns about fiscal stability and weak economic data, gold may remain in positive territory, but positive trade news could turn it down again.
Resistance levels: 3257, 3265
Support levels: 3206, 3153
A false breakout of the specified resistance will confirm the inability to continue growth. Consolidation after a false breakout of 3257 - 3265 below 3257 could trigger a reversal and a fall to areas of interest...
Best regards, R. Linda!
Trendtrading

EURAUD READY FOR ANOTHER SWING RALLYI just entered this EURAUD Swing long trade.
Reason;
Monthly is extremely bullish.
Weekly is extremely bullish.
4H changed trend from downtrend to a bullish structure with confirmation through higher highs and higher lows.
The trade was entered on 4H time frame.
It's a 4RR trade setup.

Why Traders Chase — and Always LoseHard truth:
You don’t miss opportunities. You chase noise.
Let’s break down the real reason you keep “missing moves”:
1. FOMO is not urgency — it’s confusion.
When you enter because “everyone’s talking about it,” you’re not trading a setup. You’re reacting to social proof.
2. Volatility ≠ opportunity.
Big moves look attractive, but if they’re not in your plan — they’re distractions, not trades.
3. The market rewards patience, not activity.
Every click, every chart, every refresh feeds your dopamine — not your edge.
🚫 Solution?
Stop scanning. Start filtering.
Use tools that prioritize structure over noise. That’s why we built TrendGo — to give clarity in chaos and help you avoid traps masked as opportunity.
📌 Don’t chase. Build your edge.

$WMT #WMT attention shoppers line followers make money Very simple way to make sure profit on this huge box filled with Chinese garbage
Am buyer on #daily trimmed by 11 Am , wait to load afterhours for overnight #trade

USDJPY Bullish Breakout Setup – Retest at Key Demand ZoneUSDJPY is respecting a clean bullish structure after rebounding from the 140.100 base. Price made a higher high near 148.650, followed by a pullback into the previous demand zone around 145.000.
Technical Breakdown:
Market Structure: Higher highs and higher lows indicate a strong uptrend.
Demand Zone: Clean reaction from the 145.000 zone, which previously acted as resistance-turned-support.
Target Zones:
First TP: 147.900 (previous swing high)
Final TP: 150.600 (key resistance level)
Invalidation Level : Close below 144.800 could invalidate this bullish scenario.
If price sustains above 145.000, the bullish trend is likely to continue.
As always, manage risk carefully.
Like & Follow for more clean, high-timeframe breakdowns!

How To Setup & Use The Trend Trading IndicatorThis video gives an in depth explanation of each setting of the Trend Trading Indicator so you can understand how to set up the indicator properly and get your desired results.
We cover the following:
Master trend signals and settings
How to configure your master trend signal timeframes correctly
How to get rid of signals when the market is ranging
Each type of extra signal: strong all timeframe trends, pullbacks during strong trends, trend score signals and more
What timeframes and settings to use for intraday trading
Customizing the settings to get the results that fit your trading style
Make sure to test out your settings on various markets using historical data to ensure you have the indicator performing according to your specific parameters.
If you have any questions about using the indicator or the settings, feel free to reach out to us.
Happy Trading :)

EURCAD no3 view, bearish continuation still to expect
OANDA:EURCAD last two analysis on EURCAD doing, going good, will be attached, having now one more update and new view.
Price at end is break RAISING WEDGE and BEARISH FLAG, pushing strong bearish, strong volumem and momentum is gathered and still here having strong bearish expectations.
SUP zone: 1.57200
RES zone: 1.53000, 1.51600

GBPUSD - Liquidity Grab & BoS Signals Bearish ReversalSmart Money Concepts (SMC) Analysis
1. Liquidity Sweep & Break of Structure (BOS):
Price consolidates above a trendline with multiple rejections (blue lines).
A liquidity grab occurs below this trendline – classic inducement setup.
After the grab, a bearish BOS (break of structure) is confirmed with a strong candle closing below the trendline and recent lows.
2. Order Block:
Price retested a 4H bearish order block (grey shaded zone) before rejection. This OB aligns with the last bullish candle before the drop.
Rejection from the OB confirms institutional interest (SMC).
3. Imbalance / Fair Value Gap (FVG):
The drop left a minor imbalance zone, suggesting possible continuation down to fill the inefficiency.
Price Action Analysis:
1. Trendline Break:
Ascending trendline has been broken with strong bearish momentum.
Indicates a shift from higher lows to lower lows → possible trend reversal.
2. Supply Zone Respect:
The price failed to make a new high and was firmly rejected at resistance.
Double top or lower high formation adds bearish confluence.
3. Target & Risk-Reward:
The trade setup indicates a short entry just below trendline break.
Target around 1.29393, likely based on previous demand zone or liquidity pocket.
Stop above 1.33664, likely above the OB or structural high.
Solid RRR (>3:1) visible.
Confluences Supporting Bearish Bias:
Break of internal structure (Price Action)
Liquidity sweep below trendline (SMC)
Bearish Order Block rejection (SMC)
Strong bearish engulfing candle
Favourable RR trade plan
Conclusion:
This is a high-probability bearish setup combining a trendline liquidity sweep (inducement), break of structure, order block rejection, and efficient risk-reward positioning. The price is expected to target 1.29393, aligning with a previous demand or liquidity zone.
Thanks for your time..

Natural gas short tradeShorted Naturalgasm @ 309.5 looking at recent double top. The major trend in natural gas is downtrend. This trade is in confluence with major trend. The volume is also supporting the trade.

Gold Trend Analysis – Potential Movement ForecastThe recent price action suggests a potential turning point in gold’s trend. While the market has maintained an ascending trajectory , the latest pullback introduces a level of caution. The structure remains intact within the trend channel , but the rejection near resistance indicates that bullish momentum may be cooling off.
Key price zones such as 3800.796, 3549.659, and 3238.064 will be decisive in determining the next movement. If buyers defend these levels, a rebound towards higher resistance is likely. However, a break below support could accelerate a deeper correction.
Market sentiment currently leans towards buy-side accumulation , as marked across the chart, yet a confirmation signal from price behavior is required before engaging further in longs. Managing risk effectively in these conditions will be crucial to navigate the upcoming price movements.

Nasdaq - Printing The Obvious Bottom!Nasdaq ( TVC:NDQ ) already finished the correction:
Click chart above to see the detailed analysis👆🏻
After we witnessed a minor "crash" of about -25% over the past couple of weeks, the bottom might be in on the Nasdaq. We simply saw another very bullish all time high break and retest and depite the possibility of a second retest, I am (still) extremely bullish at these levels.
Levels to watch: $17.000
Keep your long term vision,
Philip (BasicTrading)

Gold Breakout and Potential RetraceHey Traders, in today's trading session we are monitoring XAUUSD for a buying opportunity around 3300 zone, Gold was trading in a downtrend and successfully managed to break it out. Currently is in a correction phase in which it is approaching the retrace area at 3300 support and resistance area.
Trade safe, Joe.

Looking to short CL to continue lowerCL is making a corrective move higher before moving down to the ultimate target of last Daily structure leg down. It retraced to Daily bearish Fair Value Gaps (internal range liquidity zones) which should act as resistance. 15M bearish structure is in Extreme premium.
I'm looking for CL to break down bullish corrective structure on 5M chart and start a final move down.

CONFUSION SETS IN.....Hello! You are looking at a 6 hour chart, here.
Starting out, we can see the 100 day moving average starting to ascend above the 14 day moving average, which indicates bearish momentum is building!
On the other hand, we can also see what appears to be a bullish pennant forming, which indicates bullish momentum to the upside.
As a disclaimer, I have not taken into account volume or any oscillators, but it appears this pair will be bullish for the short term, but bearish in the long term.
Depending on whether you are a long term or short term trader, I personally like what I am seeing from this 6 hour chart! Let me know if this was helpful for you! I love to read comments. Thank you for reading. Trade wisely.

Candlestick Patterns + Trend and Momentum: A Perfect CombinationCandlestick patterns provide valuable insights into price action, showing potential reversals, continuations, or market indecision. However, to significantly improve their effectiveness, combining candlestick analysis with trend and momentum indicators is essential. Here’s how you can use these combinations to trade with more confidence and accuracy.
1. Why Candlestick Patterns Matter
Candlestick patterns visually represent traders’ psychology through price movements, including four key prices: Open, Close, High, and Low. Some of the most common and useful patterns include:
Doji: Indicates market indecision and potential reversals.
Hammer & Hanging Man: Signals possible trend reversals at support or resistance.
Engulfing Pattern: Often marks the beginning of a significant reversal.
Morning/Evening Star: Combination patterns that strongly suggest a trend reversal.
2. Adding Trend and Momentum Indicators
Candlestick patterns alone might lead to false signals or confusion. By pairing them with other technical tools, such as moving averages, RSI (Relative Strength Index), or MACD (Moving Average Convergence Divergence), you gain crucial context to confirm the reliability of the patterns.
Here’s how:
Trend Alignment:
Using moving averages, such as the 20 or 50-period EMA, helps confirm whether a bullish candlestick pattern appears in an uptrend (strengthening the signal) or countertrend (potentially weaker signal).
Momentum Confirmation:
Oscillators like the RSI or MACD can confirm the underlying momentum behind a candlestick pattern. For instance, a bullish engulfing pattern becomes more reliable if it coincides with RSI moving upward from oversold territory or MACD showing a bullish crossover.
Volume Analysis:
Higher volume on the candle that forms the pattern typically confirms increased market interest and strengthens the validity of the signal.
3. Practical Example: Bullish Engulfing + RSI
Imagine you spot a bullish engulfing pattern forming at a clear support level after a downtrend:
Step 1: Identify the Pattern: Confirm the bullish engulfing visually.
Step 2: Check RSI: Ensure RSI is below 30 or rising, signaling oversold conditions and potential bullish momentum.
4. Why This Approach Works
Enhanced Accuracy: Combining candlestick signals with trend and momentum indicators increases signal reliability.
Improved Risk Management: Clearer signals mean more confident entries and better-defined stop-loss levels.
Reduces False Signals: Multiple confirmations reduce the risk of false breakouts or reversals.
5. Final Tips
Always look for multiple confirmations (trend, momentum, volume) before making trade decisions based solely on candlestick patterns.
Be patient—waiting for full confirmation can help avoid premature trades.
Regularly backtest and practice recognizing these combined signals to strengthen your trading strategy.

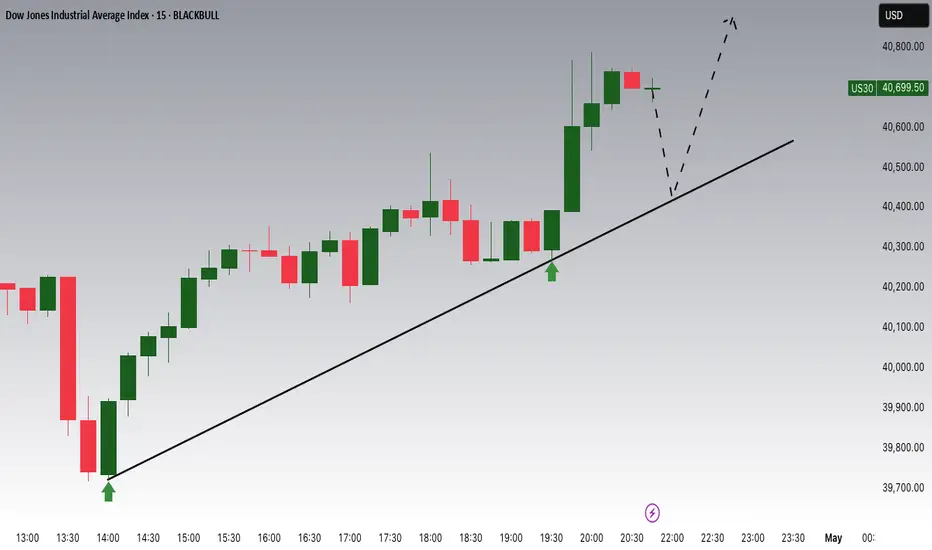
Dow Jones Potential UpsidesHey Traders, in today's trading session we are monitoring US30 for a buying opportunity around 40400 zone, Dow Jones is trading in an uptrend and currently is in a correction phase in which it is approaching the trend at 40400 support and resistance area.
Trade safe, Joe.
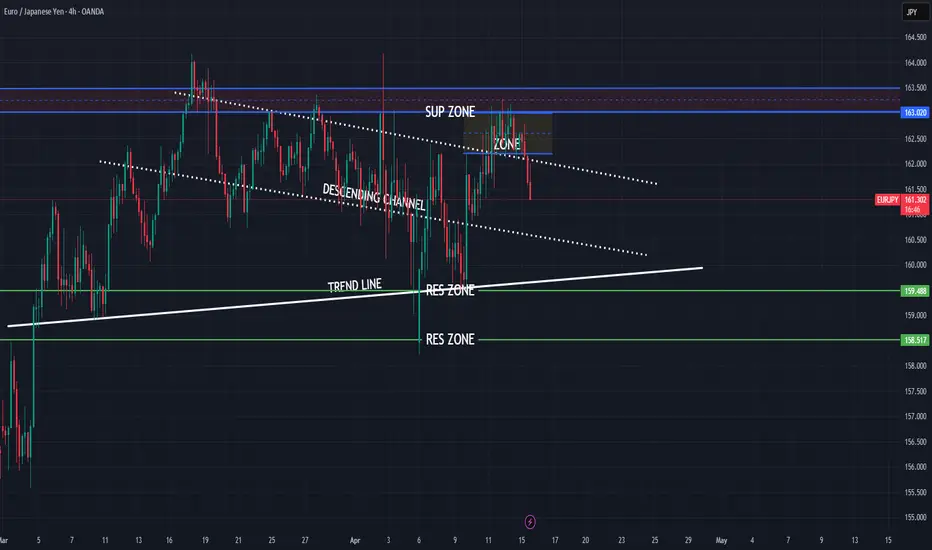
EURJPY strong bearish expectations
OANDA:EURJPY strong bullish expectations i am have, but things will not go like expected..
Currently price in DESCENDING CHANNEL, in moment we are have break of same, but price is make revers in zone and pushing now bearish.
Here now exepcting fall till trend line.
SUP zone: 163.000
RES ozne: 159.500, 158.500
How To Customize The 1 Minute Scalping IndicatorThis tutorial explains each setting of the 1 Minute Scalping Indicator in detail so you understand exactly how to adjust your settings to get the results you would like from the indicator.
Here is a list of the details we discuss:
How to fix loading errors
Tooltips that explain each setting for your reference
Trade modes and how they are affected by other settings
Average candle size rejection parameters
Higher timeframe candle filters, settings and levels
External indicator trend filtering capabilities and how to set them up correctly
Stoploss and take profit calculations and settings you can adjust
Signal arrow customization options
Candle coloring adjustments
Visual/styling options
Make sure to watch the whole video so you fully understand how each setting affects the indicator for best results.

How To Filter Signals On The 1 Minute Scalping IndicatorThis tutorial shows you how to use external indicators to filter out signals on the 1 Minute Scalping Indicator so that you only get signals that are in the direction of the trend.
Step By Step Process:
1. Pick an external indicator that provides an output value of 1 for bullish, -1 for bearish or 0 for neutral and add it to your chart. We have multiple indicators that can do this, but you can also customize your own indicators to provide this value and use that to filter out signals.
2. Set your desired trend parameters on your external indicator and make sure that indicator is on the same chart as the 1 Minute Scalping Indicator.
3. Go to the indicator settings for the 1 Minute Scalping Indicator and turn on one of the 3 available External Indicator Filters. Then from the dropdown menu, select the external indicator you want to use and make sure to choose the output value that gives the 1, -1 or 0 output for trends. Our indicators will have an output titled "Trend Direction To Send To External Indicators" to make that value easy to find in the dropdown menus.
That's it! Let the 1 Minute Scalping Indicator reload with the external indicator trend values and it will only show buy signals during bullish trends, only show sell signals during bearish trends or no signals during neutral markets. Make sure to back test your setup until you find the best external indicators and settings to use that work best for your trading style and then apply that setup to any chart you would like.
Here is the code you can use to add a trend value to your own custom indicators and send it to the 1 Minute Scalping Indicator:
trendDirection = 0
if close > ema1
trendDirection := 1
else if close < ema1
trendDirection := -1
else
trendDirection := 0
plot(trendDirection, title="Trend Direction To Send To External Indicators", color=#00000000, display=display.data_window)
Change the (close > ema1) and (close < ema1) to use your own variables from within your script.

GBPAUD bearish view for new week
OANDA:GBPAUD from first analysis from 26.Mart we are folow situation, i am make updates, we are not have bearish trend confirmation, price is make new bullish push on start of April.
Currently from start of last week price is start showing bearish signs. We have now 4h rectangle pattern visible, from here in new week expecting still bearish continuation.
SUP zone: 2.12000
RES zone: 2.04000, 2.00500

Bitcoin AnalysisBitcoin is currently moving within a defined price channel, and at the moment, it is trading near the top (resistance) of the channel.
This area often acts as a supply zone, where sellers tend to step in. Therefore, it may be a good opportunity to consider a short position, especially if it's supported by confirmation signals like divergence, reversal candlestick patterns, or other technical resistances.
As always, don’t forget to apply proper risk management, set your Take Profit levels, and consider Risk-Free strategies in case the market turns unexpectedly — especially in the high-volatility crypto environment.


Crucial Zone Ahead: Will TAO Confirm a Bullish Reversal? TAO/USDT Daily Chart Analysis
Trend Line Breakout:
The chart shows a successful breakout above a long-term descending trend line, indicating a potential shift in momentum from bearish to bullish.
Fakeout Rejection:
A previous attempt to break above the trend line resulted in a fakeout and strong rejection, but this recent move looks more decisive.
Key Resistance Cleared:
The price has clearly broken above a key resistance level, suggesting renewed buying pressure. However, confirmation is still needed.
Current Price Action:
Price is now hovering above the trend line and testing the local resistance zone.
Watch for a breakout confirmation and retest of the marked zone (approx. $265–$275) to validate further upside movement.
Next Targets:
If the breakout holds, potential upside targets could be the previous high resistance zones between $305–$335.
📌 Strategy Tip:
Wait for a daily candle close above the marked zone for confirmation. If it fails, we could see a pullback into the local support range near $270–$290
