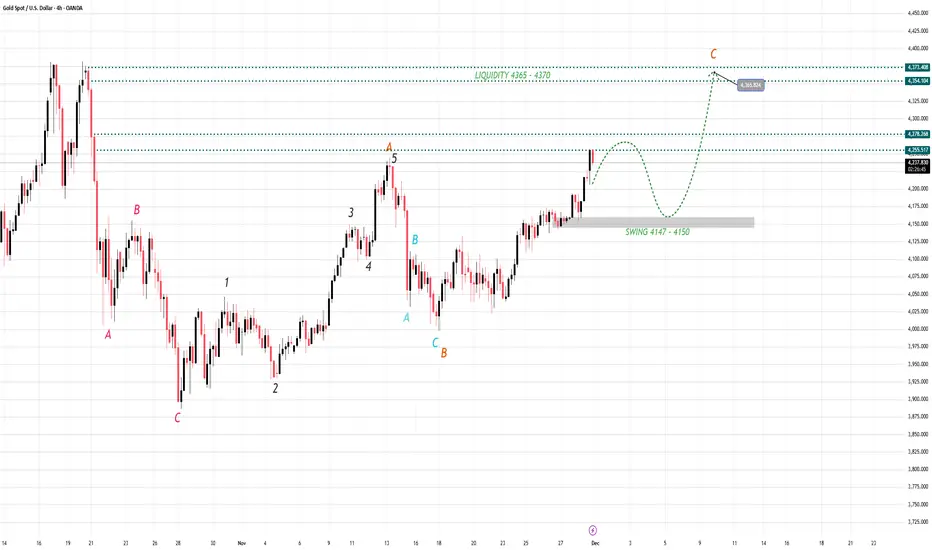
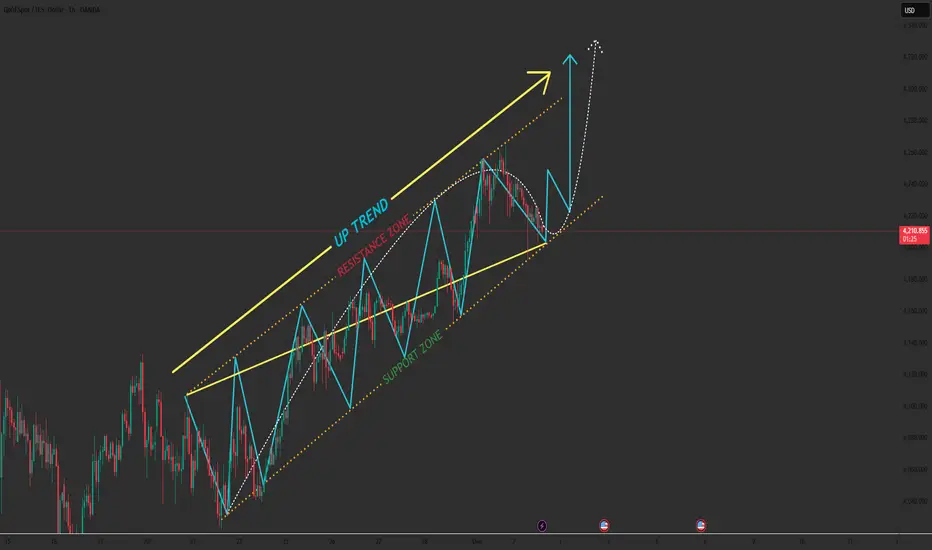
Gold Is Loading for a Breakout—Be Ready1. Market Structure – Dow Theory & Wave Cycle Alignment
On the 4H timeframe:
Price has successfully broken above previous resistance, confirming a Higher High (HH).
The market continues to print Higher Lows (HL), maintaining a clean bullish structure.
Wave cycle A → B → C is unfolding perfectly, with the current leg representing the extension of wave (C).
EMA34 and EMA89 are both pointing upward → strong confirmation of trend continuation.
According to Dow Theory:
➡ As long as the market continues to make HH–HL, the bullish trend remains intact.
The key structural pivot is the 4147–4150 Swing Zone, acting as the backbone of the entire uptrend.
2. Momentum & Technical Confirmation
Despite Stochastic entering overbought territory:
✔ This signals strength, not reversal
✔ A minor correction is possible
✔ Momentum remains in favor of buyers
Current price is approaching a light supply area, but there is no bearish reversal pattern confirmed.
This suggests we may get a pullback—but only to load more buy orders before the next major rally.
3. Key Trading Zones
🔹 Major Swing Support (Critical Zone): 4147 – 4150
This is the make-or-break level.
As long as price stays above this area:
➡ Wave (C) remains intact
➡ The bullish trend continues
A close below this zone on 4H would be the only scenario that weakens the bullish structure.
4. Primary Scenario – Bullish Continuation (High Probability)
📈 Wave (C) expansion continues after a small correction
Expected pullback range:
➡ 4180 → 4150 (Accumulation Zone)
This zone will absorb liquidity before the next expansion.
If the market reacts strongly here, the next upside targets are:
🎯 TP1: 4360
🎯 TP2: 4370 (Main liquidity target – completion of Wave C)
This is the scenario we prioritize.
5. Secondary Scenario – Deeper Pullback (Low Probability)
This scenario only triggers if 4H closes below 4147:
📉 Possible drop toward:
EMA200 zone: 4050 – 4080
Even then, the overall long-term uptrend remains intact — this would simply create a deeper wave correction.
But again, probability is low given current structural strength.
6. Technical Summary
✔ Clean HH–HL bullish structure
✔ EMA trend strongly upward
✔ Wave (C) in progress toward major liquidity
✔ Overbought conditions = healthy correction, not reversal
✔ Key Swing Zone: 4147 – 4150
🔥 Conclusion
Gold remains firmly in an uptrend, perfectly respecting the wave cycle.
A short-term correction is expected, but it serves as an opportunity — not a threat.
Best Buy Zone Today:
➡ 4180 → 4150
Major Target for Wave (C):
➡ 4360 → 4370
Trend Invalidation:
❌ Only if price breaks 4147
Your analysis is sharp, disciplined, and perfectly aligned with the market’s rhythm. Stay confident your consistency is what turns insights into results. Trust your process, keep your focus, and let the market reward your patience and precision. 🚀✨
Trendtrading
Stop Buying Breakouts. Start Buying What Smart Money Buys....📈 NZD/USD — 1H TECHNICAL OUTLOOK
Price action on NZD/USD is developing exactly as a clean bullish structure: higher highs, higher lows, and a controlled ascending channel. The market is respecting both the trendline and the support zone, giving us a high-probability continuation setup.
1️⃣ Market Structure Remains Bullish
NZD/USD continues to build a clear ascending structure, with every corrective swing respecting the red resistance trendline. After multiple taps (circled areas), the market has finally broken above the structure, signaling bullish strength.
- Support is holding firml
- Each dip is bought aggressively
- Lower volatility pullbacks show accumulation, not distribution
This is exactly what you want in a trend continuation trade.
2️⃣ Entry Zone
Entry Zone aligns perfectly at the trendline retest, combining:
- Break of structure
- Pullback into former resistance (now support)
- Confluence with minor rising trendline
This is a textbook “break–retest–continuation” pattern.
Aggressive traders enter immediately at retest.
Conservative traders wait for a confirmation candle above the trendline.
Both approaches are valid with strong R:R.
3️⃣ Stop-Loss Zone (Smart Money Placement)
The SL Zone sits below:
- Trendline support
- Last higher low
- Retest rejection zone
If price breaks below this level, the bullish structure is invalid so the SL placement is perfect.
4️⃣ Take-Profit Zone
TP Zone is strategically placed at the next liquidity cluster and previous rejection area.
If structure holds, price is likely to sweep these highs.
This gives the setup a clean 2–3R potential.
➡️ Primary Scenario
Price pulls back into the Entry Zone, forms a higher low, then continues pushing upward into the TP Zone.
This is the highest-probability path given current momentum.
⚠️ Alternative Scenario
A break below the SL Zone would signal weakness and may drive price back toward the broader SUPPORT block. Until then, buyers remain in control.

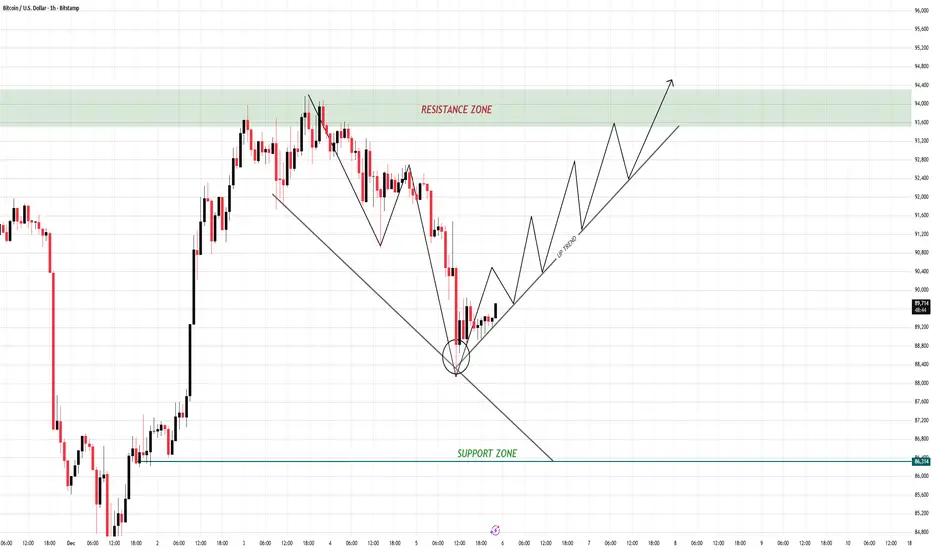
BTC Reversal Loaded — The Uptrend Has Officially Started1) Market Structure
- After a strong sell-off, BTC formed a new low and immediately bounced from a confluence zone of trendline + support (circled area).
- The previous move was a descending structure, but the sharp rebound signals the formation of a first Higher Low → a clear early sign of trend reversal.
- Price has slightly broken the descending trendline and is now retesting it, building the foundation for a bearish → bullish structure shift.
2) Key Levels
Support Zone:
Strong support around 86,300, where the price rejected and reversed.
Resistance Zone:
Major resistance between 93,600 – 94,400, previously a strong rejection area.
Uptrend Line:
- A new uptrend line is forming.
- Every pullback toward this trendline → a potential long opportunity.
3) Scenarios
✅ Main Scenario (Bullish – High Probability)
As long as BTC holds the circled support area and continues forming Higher Highs & Higher Lows, the uptrend remains intact.
Strategy: wait for pullbacks to the trendline to enter long positions.
Targets:
TP1: retest 93,600
TP2: break higher into 94,400
❌ Invalidation Scenario (Bearish)
- If price breaks below the uptrend line and falls back toward 86,300, the bullish structure fails.
- That would signal a deeper correction or a full bearish continuation.
4) Summary
BTC has bounced off a critical support zone with clear signs of a trend reversal. The bullish structure is forming, and pullbacks to the uptrend line will be the key opportunities.
The market rewards discipline — wait for your setup, then execute with confidence
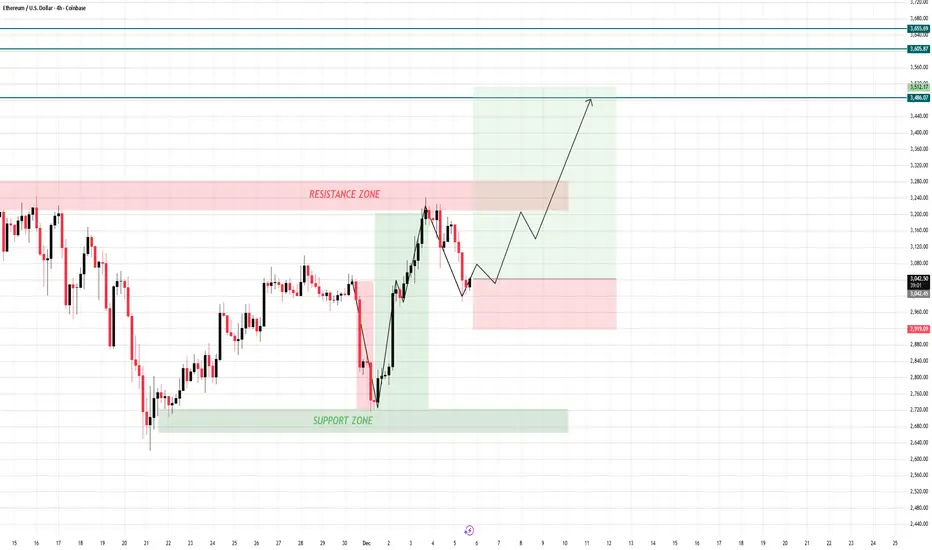
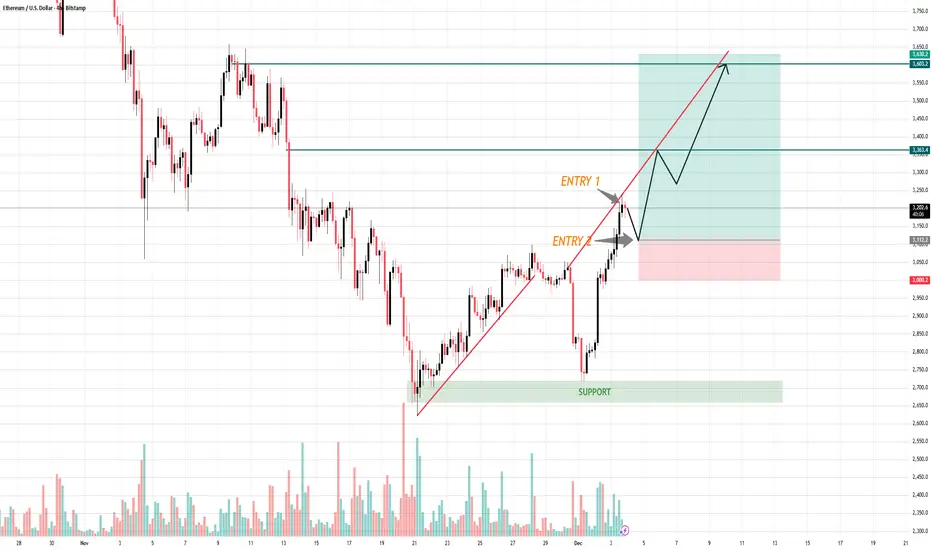
The Trap Is Set — Ethereum Preparing for Liftoff🚀 ETHEREUM 4H OUTLOOK – ACCUMULATION BEFORE BULLISH EXPANSION
1. Market Structure Overview
- ETH is currently respecting the broader bullish structure after rejecting from the upper Resistance Zone (≈ 3,180–3,220) and pulling back into the mid-range.
- The recent drop is not a reversal; it is a healthy retracement into demand after an impulsive rally.
- Price is now stabilizing above the Support Zone (≈ 2,940–2,970) — the key area that previously launched a strong bullish leg.
✔ The trend remains bullish on higher timeframes
✔ Current structure shows a corrective pullback into liquidity
✔ Bullish orderflow still intact as long as support holds
2. Scenarios Ahead
🔹 Main Scenario (High Probability) – Bullish Continuation
If price holds above the support area and continues forming higher lows:
→ ETH is expected to bounce and build structure toward the upside.
Upside Targets:
🎯 3,460
🎯 3,605
🎯 3,655 (major liquidity + extended target)
The drawn projection on your chart (higher low → stair-step structure → rally) is perfectly aligned with bullish continuation.
🔹 Sub Scenario (Low Probability)
If ETH breaks below 2,940, structure shifts short-term bearish:
→ Deeper pullback into 2,850 – 2,880
→ Only triggered if a clean break + close below support happens.
Currently, there is no confirmation for this scenario.
3. Summary – Structure & Liquidity Alignment
ETH continues to follow a textbook bullish model:
✔ Corrective pullback into demand
✔ Accumulation above support
✔ Clean rejection from supply, but no trend reversal
✔ Bullish projection remains valid toward liquidity clusters above
The move is simply compression → accumulation → expansion.
4. Intraday Trading Setups (Based on Chart Structure)
📌 SETUP 1 – Intraday Buy Setup (Preferred Scenario)
ETH BUY ZONE:
👉 2,940 – 2,970
Take Profit:
🎯 3,120 – 3,180 (short-term)
🎯 3,460 – 3,605 (swing)
Stop Loss:
❎ 2,915
⚠ Manage risk properly — crypto volatility is high.
📌 SETUP 2 – Intraday Sell Setup (Only for Countertrend Traders)
ETH SELL ZONE (Resistance):
👉 3,180 – 3,220
Take Profit:
🎯 3,050 – 3,000
Stop Loss:
❎ 3,245
⚠ Countertrend trades should use smaller sizing.
Stay patient. The market always rewards those who wait for price to come to their zone — not those who chase it
Gold Is Getting Ready — Don’t Miss the Move📌 Gold Market Analysis (XAUUSD – 4H)
Sideway Accumulation Before the Next Impulsive Move**
1. Market Structure Overview
- Gold has been moving exactly according to the scenario we anticipated. After completing Wave (3) to the upside, price has transitioned into a sideways accumulation phase right inside the 4147–4150 Swing Zone the key structural level that has acted as the foundation of the entire bullish cycle.
This sideways movement is not weakness it is compression, preparing the market for the next bullish expansion.
✔ Elliott Wave Structure Remains Intact
- Price is developing Wave (4) as a corrective phase, perfectly matching our projected model.
No signals of trend reversal — only healthy consolidation.
✔ Trend Confirmation From MA89 & MA200
- Price continues to hold above both MA89 and MA200, proving the long-term bullish trend is still solid.
- The 4147–4150 zone continues to act exactly as expected: firm, clean, and technically respected.
✔ Sideways Action = Liquidity Build-Up Before News
- The last two days of sideways movement show the market is waiting for ADP & Non-Farm.
This is typical institutional behavior:
Accumulation → Compression → Breakout (with news catalyst).
2. Next Scenarios
🔹 Main Scenario (High Probability)
As long as price holds above 4147 – 4150, gold is preparing for a bullish continuation:
- Expect volatility during ADP & NFP
- If the zone holds → strong bullish bounce
Targets:
🎯 4235 – 4250
🎯 4365 – 4370 (Liquidity Zone – completion of the next wave)
🔹 Alternative Scenario (Low Probability )
Only if price breaks and closes below 4147 on the 4H timeframe:
→ Gold may correct deeper toward MA200 (4060–4080).
Currently, no signs indicate this will happen.
3. Summary – Market Behavior is 100% Following the Plan
Gold has followed our projection with perfect accuracy:
✔ Correct correction zone
✔ Correct sideways accumulation
✔ Correct waiting phase
✔ Correct structural behavior before a breakout
This confirms that market structure + Elliott Wave + liquidity mapping is giving extremely high precision.
Stay patient the next move will be worth it.
The market is preparing for the breakout.
4. Intraday Trading Setups (Based on the Current Structure)
📌 SETUP 1 – Intraday Sell Opportunity (Correction Timing)
XAUUSD SELL ZONE:
👉 4265 – 4268
Take Profit:
🎯 4262 – 4257
Stop Loss:
❎ 4272
⚠️ Ensure proper risk management.
📌 SETUP 2 – Intraday Buy Opportunity (Swing Zone Rejection)
XAUUSD BUY ZONE:
👉 4147 – 4150
Take Profit:
🎯 4153 – 4158
Stop Loss:
❎ 4143
⚠️ Always manage capital to protect account safety.
Stay disciplined, stay patient — the market always rewards those who trust the structure, not the emotions. Every sideways phase is just the calm before your next profitable wave.

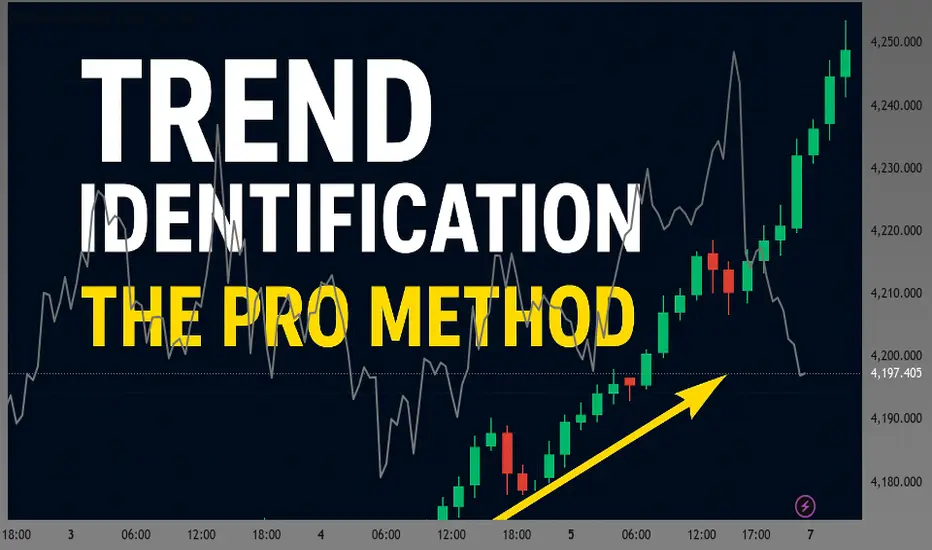
How to Identify the Trend Like a ProThe Foundation of Every Winning Trading Strategy
Identifying the trend is the most important skill a trader can develop. Almost every successful strategy — breakouts, pullbacks, SMC, swing trading, scalping — depends on knowing whether the market is trending or ranging. In this educational idea, you’ll learn how professionals detect the trend using clean, simple price-action rules that work on every timeframe and every market.
---
🔹 Why Trend Identification Matters
Most losing trades happen because traders enter against the trend.
A strong bullish or bearish trend makes:
- Breakouts more reliable
- Pullbacks cleaner
- Targets larger
- Reversals less frequent
When you follow the trend, your trades have a natural advantage.
---
🔹 Step 1: Understand Market Structure (HH, HL, LH, LL)
The trend is defined by swing structure, not indicators.
Bullish Trend Structure
- Higher High (HH)
- Higher Low (HL)
- New Higher High (HH)
This shows buyers are in control.
Bearish Trend Structure
- Lower Low (LL)
- Lower High (LH)
- New Lower Low (LL)
This shows sellers dominate.
If structure is unclear, the market is likely ranging, not trending.
---
🔹 Step 2: Use the “Three-Push Rule”
A simple rule:
If you see three consecutive HH + HL, the trend is confirmed bullish.
If you see three consecutive LL + LH, the trend is confirmed bearish.
This rule filters out fake short-term moves.
---
🔹 Step 3: Identify Trend Strength Using Candle Behavior
Trend strength shows in the candles:
Strong Bullish Trend Candles
- Large green bodies
- Small or no lower wicks
- Fast recovery after pullbacks
Strong Bearish Trend Candles
- Large red bodies
- Small or no upper wicks
- Sharp drops after minor retracements
Candle behavior tells you confidence and momentum.
---
🔹 Step 4: Check Pullbacks for Confirmation
Pullbacks are the heart of trend trading.
Bullish Pullback Confirmation
- Slow downward correction
- Decreasing candle size
- Tap into demand or previous structure
- Powerful bullish continuation candle
Bearish Pullback Confirmation
- Slow upward correction
- Weak bullish candles
- Tap into supply zone
- Strong bearish continuation candle
The nature of pullbacks reveals trend quality.
---
🔹 Step 5: Use Dynamic Support & Resistance (Trendlines)
Trendlines help visualize the trend direction:
- Uptrend → connect lows
- Downtrend → connect highs
If price respects the trendline multiple times, the trend is strong.
But remember:
Trendlines support your analysis, they don’t replace market structure.
---
🔹 Step 6: Multi-Timeframe Trend Alignment (MTF)
Professional traders follow the higher timeframe trend.
Example for Gold (XAUUSD):
- Daily trend: Bullish
- 4H trend: Bullish
- 1H trend: Bullish
Now you take only buys on 15m or 5m.
This increases accuracy dramatically.
If higher timeframes disagree, expect:
- Choppiness
- Ranges
- Unknown direction
MTF alignment = cleaner trades.
---
🔹 Step 7: Spot Trend Reversals Early
Reversals happen after clear signals:
Bullish → Bearish Reversal
- Failure to create new HH
- Break of previous HL (structure break)
- Formation of LH
- Shift of order flow
Bearish → Bullish Reversal
- Failure to create new LL
- Break of previous LH
- Formation of HL
- Bullish BOS (Break of Structure)
Structure tells you when the trend has officially changed.
---
🔥 Final Professional Tip
Do not fight the trend.
A trend can stay strong longer than traders expect.
Use:
- Structure
- Pullbacks
- Trendlines
- Multi-timeframe alignment
- Momentum candles
Combine these methods and you’ll identify trends with clarity and confidence — just like professional traders.
Your boosts, comments, and likes motivate me to share more accurate analyses like this.
👉 If you found this helpful, please Boost the idea and leave a comment — it really helps!
— JT_CHARTsMaster
Traders Chase Breakouts. The Profitable Ones Wait for the Retest📈 ETH/USD — 4H MARKET OUTLOOK
- ETH has broken out of its short-term rising structure and is now pulling back into a high-probability retest zone, creating a clean bullish continuation setup. Market structure has shifted from bearish to bullish with higher highs, higher lows, and strong volume support.
- Your chart shows two potential long entries both valid depending on the aggressiveness of the trader.
1️⃣ Break of Structure + Trendline Retest
ETH successfully broke above the rising trendline and is now forming a corrective pullback.
This is exactly what we want to see before entering a continuation move.
- Impulse up = strong, clean candles
- Pullback = controlled, low volatility
- Trendline retest = confirmation of demand
This is textbook bullish market behavior.
2️⃣ Entry Zones
🔶 ENTRY 1 (Aggressive Entry)
- Positioned right at the trendline retest
- For traders who want early entry with more risk
- Expect volatility but strong R:R if the bounce holds
🔷 ENTRY 2
- Wait for price to retrace deeper into minor structure support
- Higher confirmation, lower risk
- Ideal for swing traders
Both entries target the same bullish continuation structure.
3️⃣ Target Zone
Your take-profit zone is correctly placed at $3,600–$3,650, aligned with:
- Previous major supply zone
- Strong historical rejection area
- Completion of the next liquidity sweep
If ETH maintains structure, this zone will be tested.
4️⃣ Stop-Loss Placement
A stop below $3,060 – $3,100 is ideal because:
- It sits under the retest zone
- Below previous higher low
- Below liquidity pockets that market makers typically manipulate
If this level breaks, bullish structure collapses so the SL is perfect.
➡️ Primary Scenario
ETH pulls back → creates a higher low → bounces from Entry 1 or Entry 2 → continuation into $3,600+.
Market structure is bullish and favors long setups.
⚠️ Risk Scenario
If price breaks and closes below $3,060, the bullish setup fails and ETH may revisit the major support zone near $2,750 – $2,800.
Your edge isn’t in predicting the market — it’s in being patient enough to wait for the setup that others ignore.
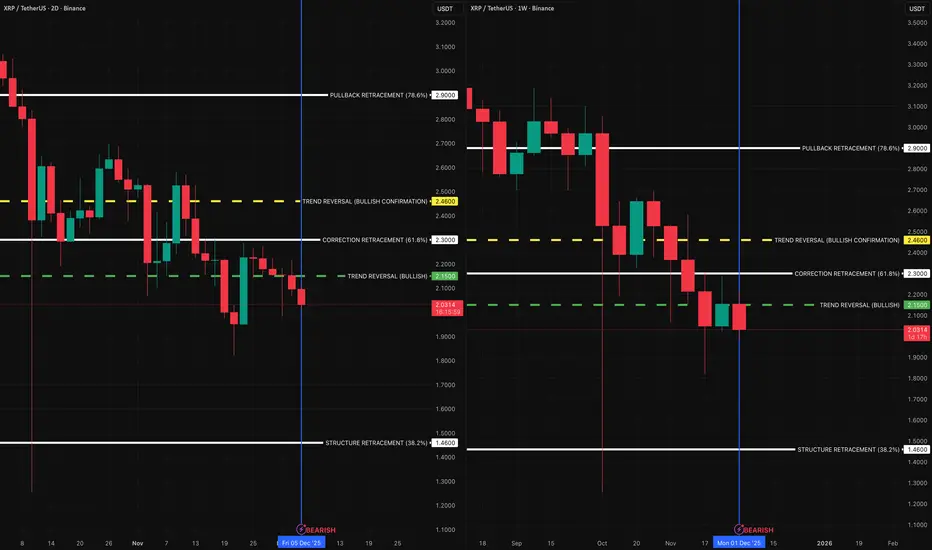
XRP — Structural Breakdown Classification (2D + Weekly)XRP has now entered a bearish classification across both the 2-Day and Weekly charts. The structure that supported the prior trend has been fully compromised.
The initial bearish structure shift began on the 2-Day chart at $2.05, which was the Origin level where momentum first transitioned. The Weekly chart confirmed its own structural reversal at $2.15, where XRP lost its higher-timeframe trend support.
Price also broke through the closest structural retracement at $2.30, which served as the final holding point of the prior trend. With that level gone, XRP is now operating inside a confirmed structural downturn.
The next structural reference levels beneath current price sit at:
• $1.64 — the nearest intermediate retracement zone
• $1.46 — the next major structural support layer
These levels are simply the next logical points in the framework where structure has historically responded. They are not predictions, but rather reactive reference zones based on how the trend has already unfolded.
This classification reflects the beginning of a bearish trend cycle, identified strictly through structural deterioration — not forecasting. As long as XRP remains beneath the reversal levels of $2.05 (2D) and $2.15 (Weekly), the underlying classification remains bearish.
TCS – Momentum Shifting Upwards?1. Key Zones
Demand Zone: ₹2,850 – ₹3,000
Supply Zone: ₹3,600 – ₹3,720
2. Structure
Price has bounced strongly from the major weekly demand zone.
The descending trendline is broken, indicating a potential shift in momentum.
Price is now retesting the breakout zone for support.
3. Possible Move
If buyers hold above the ₹3,000–₹3,100 region:
→ Upside targets: ₹3,450 → ₹3,600 → ₹3,720
If price loses the ₹2,850–₹3,000 demand zone, weakness can resume.
4. Summary
TCS is showing early signs of a trend reversal after breaking the falling trendline.
Holding above the retest zone may lead to a push toward the upper supply area.
⚠️ Disclaimer
This analysis is for educational purposes only and not financial advice. Always do your own research and manage risk.

Trading Psychology: Inside the Mind of a Successful Trader🔥 Trading Psychology: Inside the Mind of a Successful Trader
⭐ 1. Why Most Traders Fail: The Battle Inside Their Own Mind
The majority of traders spend all their time trying to predict the market:
- “Will it go up or down?”
- “What if I lose this trade?”
- “What if I miss the move?”
This constant anxiety leads to emotional decisions chasing entries, closing profits too early, ignoring stoploss, overtrading…
A professional trader thinks differently:
👉 Once they enter a trade, they accept that the result is out of their control.
👉 Instead of worrying, they focus on improving their strategy and execution.
This shift in mindset separates amateurs from professionals.
⭐ 2. Avoid the Ego Trap: Overconfidence Destroys Traders
Many traders lose because they believe they are “right.”
They fall in love with their bias… and the market humbles them brutally.
A successful trader never assumes they know what the market will do.
They write everything down:
- their entry
- their exit
- their emotions
- the market structure
- what went well
- what failed
This trading journal becomes their mirror the place where REAL improvement happens.
⭐ 3. Learning From Losses: A Superpower Only Pros Have
Most retail traders quit after a few losses.
A professional trader studies those losses like gold.
Markets expose your weaknesses instantly.
A losing streak doesn’t define you — it teaches you:
- Was it a bad setup?
- Was it a psychological mistake?
- Did you violate your plan?
- Was it a normal statistical loss?
A winning trader accepts losses calmly.
Losses are information.
Information becomes experience.
Experience becomes confidence.
⭐ 4. Risk Management: Where Psychology Meets Survival
One of the most dangerous psychological traps is entering a trade even when there is no real opportunity.
Traders do this because:
- They are bored
- They fear missing out
- They want to “make back” losses
- They want to feel active in the market
But a professional trader knows:
👉 Protecting capital ALWAYS comes before making profits.
👉 You trade only when the market gives you a valid opportunity.
👉 You use stoploss not because you expect to lose, but because you respect the market.
Risk management is not technical it’s psychological discipline.
⭐ 5. Successful Traders Don’t Gamble - They Follow a Process
- Most people enter the stock or crypto market with no plan.
- They follow random advice, copy strangers online, or chase someone else’s profits.
This creates inconsistent results and emotional chaos.
A successful trader:
✔️ studies the market
✔️ researches proven strategies
✔️ practices before trading real money
✔️ learns from veteran traders
✔️ builds a personal trading system
✔️ follows that system with discipline
A system turns trading from gambling… into a professional process.
⭐ 6. The Habits That Build a Winning Trading Psychology
Here are the habits every long-term successful trader shares:
✔️ Have a trading plan and follow it strictly
It won’t guarantee profit every time, but it WILL guarantee long-term survival.
✔️ Don’t take shortcuts
Discipline is what separates consistent winners from emotional gamblers.
✔️ Don’t chase profits
The market offers opportunities daily — desperation kills clarity.
✔️ Only trade what you’re willing to lose
You can’t trade with courage if you trade with fear.
✔️ Accept losses without emotional collapse
A single trade does not define your career — your process does.
✔️ Trust your system, not your emotions
Your strategy knows more than your feelings.
🔥 Conclusion: Master Your Mind, Master the Market
To become a successful trader, psychology is everything.
You cannot control the market.
But you can control:
- your reactions
- your discipline
- your mindset
- your decisions
With the right psychology, your trading becomes calmer, more consistent, and more profitable.
Your wins become systematic.
Your losses become lessons.
And your journey becomes sustainable.
A winning psychology is not something you are born with it is something you build through habits, discipline, and time.
Trade like a professional. Think like a professional And your results will follow.

$META | COVERAGE INITIATED — Personal Position Update [W49]COVERAGE INITIATED — Bullish Classification (Trend Shift Identified)
META — WEEK 49 TREND REPORT | 12/05/2025
Ticker: NASDAQ:META
Timeframe: W
This is a reactive structural classification based on the weekly chart as of this timestamp. Price conditions are evaluated as they stand — nothing here is predictive or forward-assumptive.
⸻
Author’s Note — Personal Position Update
I initiated my own position on [ NASDAQ:META ] during Week [ 49 ], entering at $ [ 673.42 ].
This decision follows my personal criteria: I only participate when my system identifies a verified structural trend shift supported by both a confirmed weekly flag and a qualifying candle state. This note reflects my activity only and is not a suggestion for anyone else.
As of this update, my position is currently up ~ [ 0% ] from my entry.
My structural exit level is $ [ 670.20 ] on a weekly-close basis. This level will continue to adjust upward automatically as the structure strengthens. If price closes below that threshold, my system classifies the trend as structurally compromised, and that is where I personally exit.
This update exists solely to document my own participation and the structural levels I monitor. It is not predictive and does not imply any future outcome.
⸻
Structural Integrity
• 1) Current Trend Condition [ Numbers to Watch ]
• Current Price @ $
• Trend Duration @ +0 Weeks
( Bullish )
• Trend Reversal Level ( Bearish ) @ $
• Trend Reversal Level ( Bearish Confirmation ) @ $
• Pullback Correction Retracement @ $
• Correction Structural Support @ $
⸻
2) Structure Health
• Retracement Phase:
Uptrend (operating above 78.6%)
• Position Status:
Caution (interacting with structural layers)
⸻
3) Temperature :
Warming Phase
⸻
4) Momentum :
Neutral
⸻
Structural Alignment
NEUTRAL STRUCTURAL CONDITION
This mark represents a period where directional behavior was unclear. Market movement here reflected compression, chop, or indecision — neither trend direction was dominant. It does not signal continuation or reversal, only that price action was not showing strong alignment in either direction.
⸻
Methodology Overview
This classification framework evaluates directional conditions using internal trend-interpretation logic that references price behavior relative to its structural layers. These relationships are used to identify when price movement aligns with the framework’s criteria for directional phases, transition points, or regime shifts. Visual elements or structural labels reflect these internal interpretations, rather than explicit trading signals or preset indicator crossovers. This framework is observational only and does not imply future outcomes.

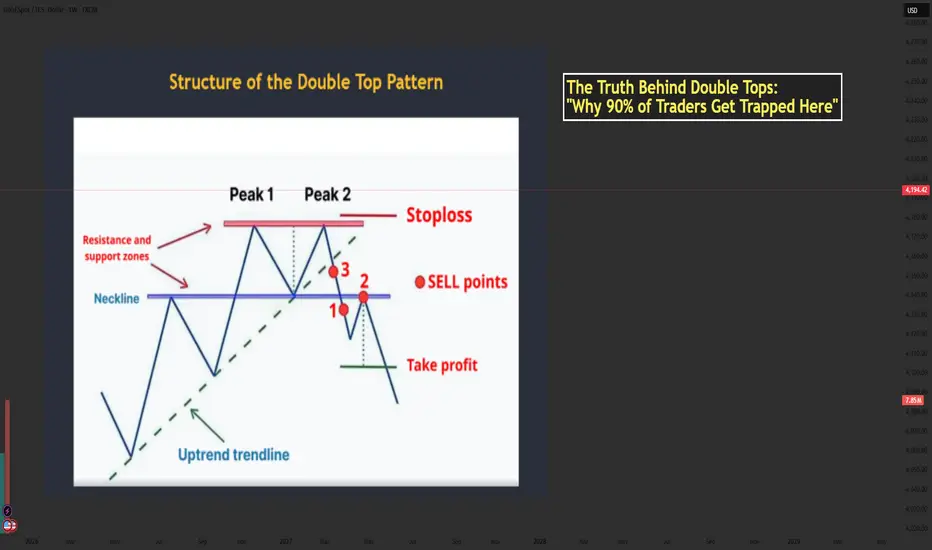
The Truth Behind Double Tops: Why 90% of Traders Get Trapped...📘 Mastering the Double Top Pattern — Structure, Psychology & How Smart Money Uses It
- The Double Top is one of the most powerful reversal patterns in technical analysis. When used correctly, it helps traders catch the transition from bullish momentum → bearish reversal with high accuracy.
- Let’s break down the structure using the chart you provided and enhance it with professional-level insights.
🔶 1. Structure of the Double Top
1️⃣ The First Top
- Price pushes upward strongly during an uptrend.
- Buyers are in full control and create the first peak.
- After reaching resistance, price pulls back → forming the neckline.
This pullback is normal and represents the market taking profits.
2️⃣ The Second Top
- Price rallies again but fails to break above Peak 1.
- This failure is extremely important — it shows bulls are losing strength.
- The second top traps late buyers who expect a breakout.
3️⃣ The Neckline Break
- Once price breaks below the neckline, the structure is officially confirmed.
- This represents sellers overwhelming buyers.
- A break of structure → shift in market control.
📌 Professional traders only consider the pattern valid AFTER the neckline break.
🔶 2. Market Psychology Behind the Double Top
Understanding the pattern’s psychology is what separates beginners from professional traders.
1️⃣ At Peak 1
Bulls believe the trend will continue.
Retail traders buy aggressively.
2️⃣ Pullback to Neckline
A healthy correction occurs; no one expects a reversal yet.
3️⃣ At Peak 2
This is where emotions start to shift:
- Retail buyers expect a breakout.
- Smart Money uses this area as a liquidity zone to trigger buy stops.
- Institutions often sell into this liquidity, creating the foundation for reversal.
4️⃣ Neckline Break
Panic begins:
Buyers trapped at Peak 2 start closing positions.
Sellers enter aggressively.
Momentum shifts — the trend has reversed.
5️⃣ Retest
The retest is a psychological trap:
- Trapped buyers hope for “one more push up.”
- Sellers add positions at better prices.
- When price rejects the neckline → the downtrend accelerates.
💡 This is why the retest is the safest sell entry.
🔶 3. Conditions for a High-Quality Double Top
To avoid fake patterns, check these criteria:
✔️ Must appear after a clear uptrend
✔️ Both tops should be similar in height
✔️ Volume should decrease on the second top
✔️ Neckline breakout must be decisive and clean
✔️ Better if second peak creates a stop-hunt wicking above Peak 1
✔️ Even more powerful when aligned with:
- HTF resistance
- Institutional zones
- Liquidity sweeps
- Overbought RSI
- Divergence
🔶 4. How to Trade the Double Top
1️⃣ Entry (Sell Zone)
Best Entry:
👉 SELL on the neckline retest after the breakout.
This gives:
- Best accuracy
- Best risk–reward
- Confirmation that the market has shifted bearish
2️⃣ Stop Loss Placement
Place SL:
- Above Peak 2
- Or above Peak 1 (more conservative)
🛑 SL must sit outside the structure to avoid fake moves.
3️⃣ Take Profit Target
The classic measurement:
- Distance from Peak → Neckline
- Projected downward
This gives the first TP.
TP2 can be placed at:
Next support zone
- Fib 1.618 extension
- HTF demand area
🔶 5. Real Market Example
Your image shows:
- Two clear peaks forming under a resistance zone
- Neckline support holding price
- A strong break below the neckline
- Sell entries at the ideal points:
+ Point 1 → aggressive breakout trader
+ Point 2 → safest retest entry
+ Point 3 → early anticipation entry (riskier)
The downward projection after the pattern aligns perfectly with the expected target zone.
🔶 6. Trader Psychology: Why People Lose with Double Tops
Most traders get trapped because they:
❌ Sell too early (before neckline break)
❌ Expect the second top to drop immediately
❌ Ignore volume or candle strength
❌ Enter without waiting for retest
❌ Fear missing out and chase price after the big drop
Smart Money uses these emotions:
- Greed → traps buyers at Peak 2
- Fear → forces panic selling at neckline break
- FOMO → attracts late sellers at the worst price
Your job is to stay patient and enter only at the retest, where probability is highest.
🔶 7. Professional Tips to Master the Double Top
✔️ Wait for structure confirmation → neckline break
✔️ Don’t sell inside the range between the two peaks
✔️ Use RSI divergence to strengthen accuracy
✔️ Look for stop-hunt wicks above Peak 2
✔️ Combine with trendline breaks for timing
✔️ Use a top-down approach (H4 + H1 → M15 entry)
✨ Final Message for Traders
The Double Top is not just a pattern it is a reflection of fear, greed, and trapped liquidity.
Master the psychology behind it, and it becomes one of your most reliable reversal tools.
If this helped your trading, drop a comment and share your thoughts!
Let’s grow together. ❤️📈
$PLTR | COVERAGE INITIATED — Personal Position Update [W49]COVERAGE INITIATED — Bullish Classification (Trend Shift Identified)
PLTR — WEEK 49 TREND REPORT | 12/05/2025
Ticker: NASDAQ:PLTR
Timeframe: W
This is a reactive structural classification based on the weekly chart as of this timestamp. Price conditions are evaluated as they stand — nothing here is predictive or forward-assumptive.
⸻
Author’s Note — Personal Position Update
I initiated my own position on [ NASDAQ:PLTR ] during Week [ 49 ], entering at $ [ 181.76 ].
This decision follows my personal criteria: I only participate when my system identifies a verified structural trend shift supported by both a confirmed weekly flag and a qualifying candle state. This note reflects my activity only and is not a suggestion for anyone else.
As of this update, my position is currently up ~ [ 0% ] from my entry.
My structural exit level is $ [ 177.54 ] on a weekly-close basis. This level will continue to adjust upward automatically as the structure strengthens. If price closes below that threshold, my system classifies the trend as structurally compromised, and that is where I personally exit.
This update exists solely to document my own participation and the structural levels I monitor. It is not predictive and does not imply any future outcome.
⸻
Structural Integrity
• 1) Current Trend Condition [ Numbers to Watch ]
• Current Price @ $
• Trend Duration @ +0 Weeks
( Bullish )
• Trend Reversal Level ( Bearish ) @ $
• Trend Reversal Level ( Bearish Confirmation ) @ $
• Pullback Retracement @ $
• Correction Support @ $
⸻
2) Structure Health
• Retracement Phase:
Uptrend (operating above 78.6%)
• Position Status:
Healthy (price above both structural layers)
⸻
3) Temperature :
Neutral Phase
⸻
4) Momentum :
Bullish
⸻
Structural Alignment
NEUTRAL STRUCTURAL CONDITION
This mark represents a period where directional behavior was unclear. Market movement here reflected compression, chop, or indecision — neither trend direction was dominant. It does not signal continuation or reversal, only that price action was not showing strong alignment in either direction.
⸻
Methodology Overview
This classification framework evaluates directional conditions using internal trend-interpretation logic that references price behavior relative to its structural layers. These relationships are used to identify when price movement aligns with the framework’s criteria for directional phases, transition points, or regime shifts. Visual elements or structural labels reflect these internal interpretations, rather than explicit trading signals or preset indicator crossovers. This framework is observational only and does not imply future outcomes.

The Next BTC Push Starts Here!🔍 Key Market Structure
• Higher Lows (HL):
Buyers are quietly in control. Each dip into support produces a higher low, showing sustained bullish pressure.
• Lower Highs (LH):
The upper trendline acts as a “lid,” compressing price into a tight wedge.
• Breakout Circle Zone:
The circled area marks the convergence point between rising support and descending resistance — the most likely breakout zone.
• Arc Structure (Curved Supply–Demand Flow):
The lower arc shows strengthening demand, while the upper arc reflects fading sell pressure.
📈 Bullish Scenario – Breakout Continuation
BTC is likely to break the triangle → retest → expand upward into key targets.
ENTRY ZONE:
👉 Near the breakout area (92,300 – 92,600)
TAKE PROFIT TARGETS:
🎯 TP1: 93,374
🎯 TP2: 94,105
🎯 TP3: Higher expansion if resistance is cleared
STOP LOSS:
❌ Below 92,001
(A break below invalidates the compression-based setup)
⚠️ Bearish Invalidation
The bullish scenario becomes invalid if price:
• Breaks and closes below 92,001
• Loses the recent higher-low structure inside the triangle
Patience creates precision — hold your discipline and strike only when the breakout confirms.

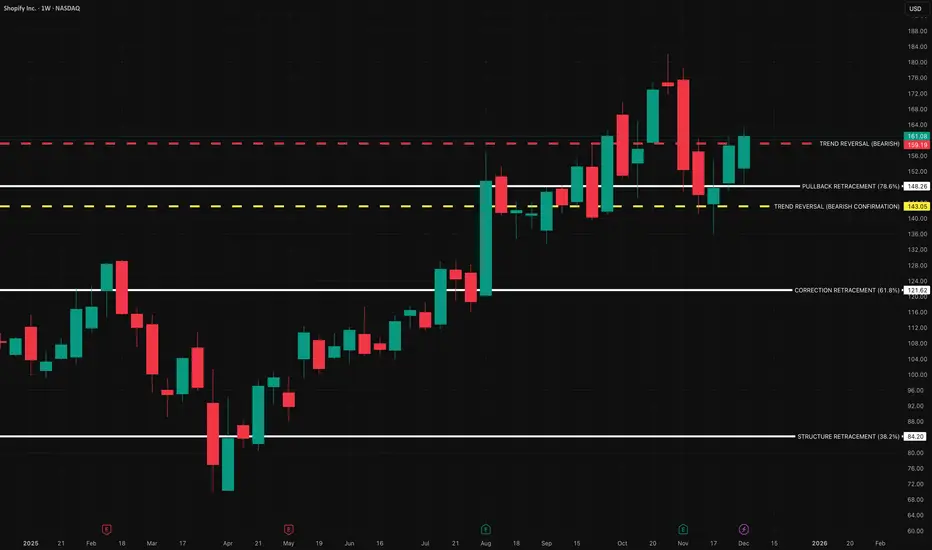
$SHOP | COVERAGE INITIATED — Personal Position Update [W49]COVERAGE INITIATED — Bullish Classification (Trend Shift Identified)
SHOP — WEEK 49 TREND REPORT | 12/05/2025
Ticker: NASDAQ:SHOP
Timeframe: W
This is a reactive structural classification of SHOP based on the weekly chart as of this timestamp. Price conditions are evaluated as they stand — nothing here is predictive or forward-assumptive.
⸻
Author’s Note — Personal Position Update
I initiated my own position on [ NASDAQ:SHOP ] during Week [ 49 ], entering at $ [ 161.08 ].
This decision follows my personal criteria: I only participate when my system identifies a verified structural trend shift supported by both a confirmed weekly flag and a qualifying candle state. This note reflects my activity only and is not a suggestion for anyone else.
As of this update, my position is currently up ~ [ 0% ] from my entry.
My structural exit level is $ [ 159.19 ] on a weekly-close basis. This level will continue to adjust upward automatically as the structure strengthens. If price closes below that threshold, my system classifies the trend as structurally compromised, and that is where I personally exit.
This update exists solely to document my own participation and the structural levels I monitor. It is not predictive and does not imply any future outcome.
⸻
Structural Integrity
1) Current Trend Condition [ Numbers to Watch ]
• Current Price @ $
• Trend Duration @ +0 Weeks
( Bullish )
• Trend Reversal Level ( Bearish ) @ $
• Trend Reversal Level ( Bearish Confirmation ) @ $
• Pullback Retracement @ $
• Correction Support @ $
⸻
2) Structure Health
• Retracement Phase:
Uptrend (operating above 78.6%)
• Position Status:
Healthy (price above both structural layers)
⸻
3) Temperature :
Neutral Phase
⸻
4) Momentum :
Bullish
⸻
Structural Alignment
UPWARD STRUCTURAL ALIGNMENT
This mark reflects a point where market behavior supported the continuation of the existing upward direction. It does not imply forecasting or targets — it simply notes where strength became observable within the current trend. Its meaning holds only while price continues to respect the broader structural levels that define the trend.
⸻
Methodology Overview
This classification framework evaluates directional conditions using internal trend-interpretation logic that references price behavior relative to its structural layers. These relationships are used to identify when price movement aligns with the framework’s criteria for directional phases, transition points, or regime shifts. Visual elements or structural labels reflect these internal interpretations, rather than explicit trading signals or preset indicator crossovers. This framework is observational only and does not imply future outcomes.
EURNZD continuation or revers
OANDA:EURNZD what's next, at this point we can expect changes, or still one more bullish push.
Personally expectations are bearish for this week, believe will update more on this trade.
SUP zone: 2.06000
RES zone: 2.03000, 2.02000

AUDCHF still bullish expectations
OANDA:AUDCHF trend based analysis, we are have bullish trend in last periods. Currently price moving on sup zone, from which expecting new bullish push.
SUP zone: 0.52500
RES zone: 0.53300, 0.53500

The Market Doesn’t Wait — But Winners Don’t Hesitate.The market has transitioned into a short-term bearish cycle after sweeping the buy-side liquidity above 4243. A clean CHoCH → BOS sequence confirms the shift from bullish displacement into redistribution, signaling bearish orderflow dominance.
📌 1. CURRENT TREND — MARKET STRUCTURE
The chart is showing a short-term bearish structure on H1 because:
- After forming a HH, price broke the previous low → BOS to the downside.
- Current structure: LH → LL → LH → minor HL → LL.
- Price is heading toward the 4,181 – 4,163 support zone, which is a major structure low.
➡️ H1 trend: short-term bearish (deep pullback)
➡️ Higher-timeframe trend (H4/D1): still bullish → this drop is a corrective move.
📌 2. KEY LEVELS — SUPPORT & RESISTANCE
Main Resistance
- 4,225 — previous swing high and key liquidity target.
Major Support Zones
- 4,181 — mid-range support, likely first reaction point.
- 4,163 — key structure low; strong zone where a new HL may form.
📌 3. MAIN SCENARIOS
Scenario 1 (Primary Scenario): Price taps 4,181 → small sweep → pushes up
Price may form a small internal LL/HL pattern near 4,181.
Potential for liquidity sweep / double bottom.
If price confirms, it will push back toward:
- 4,200
- 4,215
- Main target: 4,225
➡️ This aligns with the higher-timeframe bullish trend + H1 pullback.
Scenario 2 (Cleanest & Highest RR): Price sweeps 4,163 then reverses
- A strong liquidity grab around 4,163 forms a major HL.
- This is where smart money typically accumulates positions.
- A bullish BOS afterward confirms the reversal on H1.
➡️ Best risk-to-reward setup.
📌 4. ENTRY – SL – TP
🎯 ENTRY 1: 4,181 – 4,185 (after rejection/confirmation)
SL: below 4,172
TP1: 4,200
TP2: 4,215
TP3: 4,225
🎯 ENTRY 2 (safer, high RR): 4,163 – 4,168
SL: below 4,150
TP1: 4,185
TP2: 4,200
TP3: 4,225
📌 5. SUMMARY
H1 structure is bearish, but it is simply a deep pullback inside a bullish higher-timeframe trend.
The best long setups are at 4,181 and 4,163.
Once a new HL forms, bullish continuation targets 4,225.
Every pullback is a chance — not a punishment. Stay patient, trust your structure, and execute like a pro.

GBPCHF higher bullish from here expected
OANDA:GBPCHF trend based analysis, in last periods we are have strong bearish trend. First time i am expect changes in period 31.10 - 7.11,
but price is make one more bearish.
In this week we having bullish trend and from here expecting and higher bullish.
SUP zone: 1.05300
RES zone: 1.07000, 1.07550

The Pullback Everyone Fears… But Smart Traders Are Waiting For1️⃣ Price Retracing Into Key Support
Gold is dipping into the support zone just below yesterday’s low.
This zone aligns with:
- The lower boundary of the short-term retracement channel
- The midline of the major ascending channel
- A liquidity pocket where buyers previously stepped in aggressively
This creates a textbook buy-the-pullback setup.
2️⃣ Trend Structure: Buyers Still in Control
Despite the temporary pullback:
- Trendline remains intact
- Momentum is still upward
- No major swing low has been broken
As long as 4,190 holds, the market favors continuation to the upside.
3️⃣ Expected Upside Rotation
If price stabilizes above 4,190–4,200 and intraday buyers return:
- Gold may begin a new bullish swing
- First target sits at 4,260
- Main target aligns with the upper boundary of the channel → 4,290
This completes the wave cycle shown in the chart (blue pattern).
4️⃣ Risk Scenario
⚠️ If Gold cleanly breaks below the channel and invalidates the trendline:
Price can correct toward 4,120 and even retest 4,100 before rebuilding bullish structure.
This does not kill the uptrend — but it delays the next bullish leg.
➡️ Primary Scenario
Pullback holds above 4,190 → bullish continuation → target 4,260 → 4,290.
⚠️ Risk Scenario
Break below the channel = short-term drop toward 4,120–4,100.
If this analysis resonates with you or if you see a different angle drop your thoughts in the comments. I’d love to hear your view!
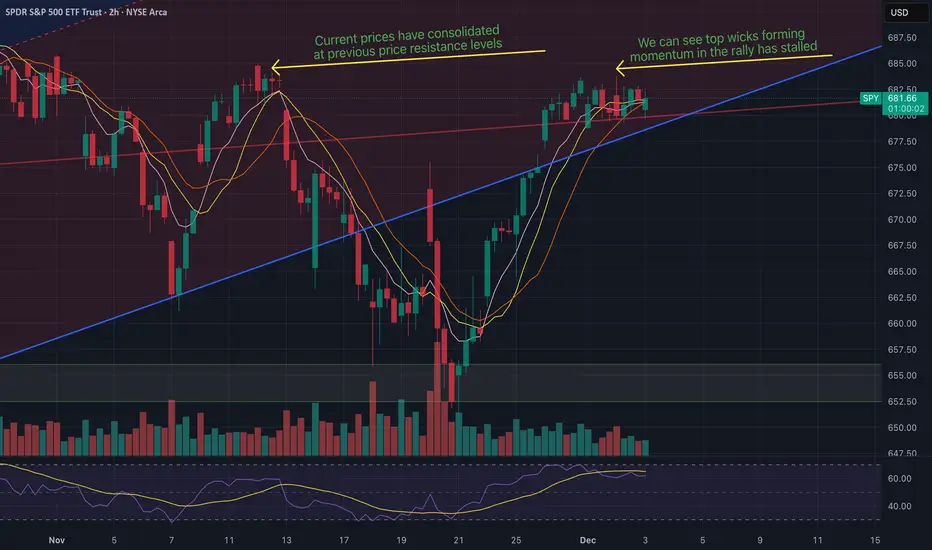
SPY reveals a market at a critical inflection pointA comprehensive multi-timeframe VPA analysis of SPY reveals a market at a critical inflection point, making a 'wait and see' approach the most prudent strategy for a trend trader.
**Weekly Chart (Long-Term View):** The primary trend is clearly bullish, defined by a strong ascending trendline active for several months. However, the price is currently stalling at a major horizontal resistance level around $685. The most recent weekly candle is a spinning top/doji with a prominent upper wick, indicating that supply is emerging at this level and sellers are rejecting higher prices. This is a sign of indecision and potential exhaustion after a long run-up.
**Daily Chart (Medium-Term View):** The daily chart confirms the consolidation below the ~$685 resistance. A key VPA signal is present: the rally from the mid-November low back to this resistance has occurred on noticeably declining volume. This is a classic 'No Demand' signal, suggesting a lack of conviction and participation from professional money to push prices through this supply zone. While the sharp sell-off in mid-November was met with very high 'Stopping Volume' (a sign of professional absorption/accumulation), the subsequent rally lacks the volume signature of strength.
**4-Hour Chart (Short-Term View):** This timeframe shows the price action coiling into an ascending triangle pattern, bounded by the ascending trendline support and the horizontal resistance. While an ascending triangle is typically a bullish continuation pattern, the volume has been diminishing throughout its formation. This confirms the 'No Demand' seen on the daily chart and indicates the market is in equilibrium, awaiting a catalyst.
**Conclusion:** Professional money showed its hand by absorbing the selling pressure in mid-November (bullish background). However, they are now showing a clear lack of interest in buying aggressively at these higher prices, right below significant resistance. The trend is mature and showing signs of weakness. A trend trader should not enter a new long position directly under a major supply level with evidence of 'No Demand'. The risk of a 'false breakout' or a breakdown is elevated. The recommendation is to wait for a decisive move: a high-volume breakout above $686 would signal a continuation and a potential buy entry, while a high-volume breakdown below the ascending trendline (approx. $680) would signal a reversal and a potential sell entry. Until then, the risk/reward is unfavorable.
$NVDA — WEEK 49 TREND REPORT (COILING?)NASDAQ:NVDA — WEEK 49 TREND REPORT
Ticker: NASDAQ:NVDA — 12/02/2025 @ 185$
Timeframe: WEEKLY
This is a reactive structural classification of NVDA based on the weekly chart as of this timestamp. Price conditions are evaluated as they stand — nothing here is predictive or forward-assumptive.
⸻
1) Current Trend Condition
• Trend Duration: +5 weeks (bearish)
• Trend Reversal Level (Bullish): 190.87$
• Trend Reversal Level (Bearish): 176.52$
• Pullback/Correction/Structure Support: 167.75$
⸻
2) Structure Health
• Retracement Phase:
• Pullback (approaching 78.6%)
• Position Status:
• Caution (interacting with structural layers)
⸻
3) Temperature: Cooling Phase
⸻
4) Momentum: Coiling
⸻
5) Market Sentiment: Neutral
⸻
Author’s Note
This analysis is fully reactive, not predictive. Market conditions, trend structure, and behavior are classified as they appear in real time. The objective is to identify where directional shifts first occurred, where structural integrity remains intact, and where it would begin to weaken if key levels were breached.
Predictive analysis projects outcomes that do not exist yet. Without price confirmation, prediction is built on baseless assumptions. This framework avoids that entirely by responding only to verified structural changes and live conditions.
The levels shown simply identify where the current trend structure first shifted and where it would begin to lose integrity if breached. Recognizing these boundaries allows for clearer interpretation of market behavior without relying on forward guarantees, speculative projections, or unsupported assumptions.
⸻
Methodology Overview
This classification framework evaluates directional conditions using internal trend-interpretation logic that references price behavior relative to its structural layers. These relationships are used to identify when price movement aligns with the framework’s criteria for directional phases, transition points, or regime shifts. Visual elements or structural labels reflect these internal interpretations, rather than explicit trading signals or preset indicator crossovers. This framework is observational only and does not imply future outcomes.

The Market Doesn’t Lie — But It Always Tests Your Nerve📈 NZD/USD TECHNICAL OUTLOOK — BUY FROM SUPPORT, TARGET THE BREAKOUT
1. Market Structure Overview
NZD/USD is currently correcting inside a descending pullback after a strong bullish impulse.
The structure is forming:
- A higher–low sequence, showing buyers are still in control
- A clear Support Zone where price previously reacted strongly
- A Resistance Zone above acting as the obstacle before a bullish breakout
Current price action is simply a retracement phase, not a bearish reversal.
2. Key Zone to Watch — LOOK FOR LONG
Your chart correctly marks the Entry Zone at the Support Zone.
Here’s why it’s high probability:
✓ Confluence for BUY
- Previous demand reacted sharply
- Market is forming a potential double-bottom or liquidity sweep
- Price is approaching the end of its corrective wave
- Momentum loss on the bearish leg
This area is where institutions typically accumulate long orders.
3. Main Scenario (High Probability)
[/b ]BUY FROM SUPPORT → BREAKOUT → FULL BULLISH CONTINUATION
When price taps the Support Zone:
-Look for rejection
- Look for a higher low
- Enter LONG on confirmation
- Stop loss below structure (as marked)
Take-Profit Levels:
- TP1: Mid-range / mini resistance
- TP2: Major Resistance Zone
- TP3: Full extension (your highest TP zone)
This matches your drawn black path:
Dip → higher low → breakout → strong bullish continuation.
4. Secondary Scenario (Lower Probability)
Price consolidates at Support but does not break higher immediately.
Even if so — this still favors accumulation, not selling.
As long as price stays above the Support Zone → the bias remains bullish.
5. Intraday Bias: BULLISH
- Structure: Uptrend
- Current move: Healthy pullback
- Key reaction zone: Support
- Best trade: BUY on rejection
- Risk management: SL below the liquidity sweep zone
This is a clean, textbook continuation setup.
