XRP SYMMETRICAL TRIANGLE XRP H4 Symmetrical Triangle with Bull and Bear Targets.
RSI printing a Hidden Bullish Divergence.
Trade setup for Long or Short.
Trianglepatterns

SPX500 USD WEEKLY BULLISH DIVERGENCESPX500 Falling Wedge and Descending Triangle on the WTF.
We are still in a range bound environment and have a found a new LOW/LL and showing oversold levels before a lovely bounce.

XAU/USD Minor Triangle!• The gold price is encased in a triangle pattern, as seen on the H1 chart. The XAU/USD pair indicated a greater increase after breaking free of the down-channel pattern.
• The channel formation was regarded as a bullish reversal pattern from a technical perspective. However, it may test and retest the support of the triangle or the downtrend line in the near term.
Good Luck Traders!

jubfoodjubfood made triangle pattern on daily charts & broke out of it with very good volumes & also broke above strong resistance zone of 599-601 & trading comfortably above it.
Could be bought with mentioned stoploss & target.

Ethereum ETH pattern repeating 🟡🟢Ethereum ETH pattern repeating 🟡🟢
Look at 2016, 2017-18 and 2021-22
Ethereum built up a triangle pattern🟡before a huge bull flag occurred🟢
Also worth mentioning... the peak of the triangle pattern🟡was the 2nd peak on the RSI
Follow appreciated dear Crypto Nation
*not financial advice
do your own research before investing

Coca-Cola - Long - Ascending triangleCoca-Cola Company stock (KO) appears to have formed an ascending triangle pattern. Therefore, we recommend a long position on the stock.
Enter the long position once the price breaks above the resistance with the volume surge.
Target shown in the chart.

Tesla Inc.: technical analysisNASDAQ:TSLA
The shares of Tesla Inc., an American electric car maker, are correcting around 921.00.
On the daily chart of the asset, the price is moving within the global downward channel with dynamic boundaries 1050.00–560.00 and is trying to approach the resistance line.
On the four-hour chart, the signal is being processed after overcoming the upper limit of the local Triangle pattern around 755.00. There may be obstacles in the way of further upward movement of quotes, and the first serious of them may be the local resistance level of 955.00, which the trading instrument can reach today.
Technical indicators signal continued growth: fast EMAs on the Alligator indicator are moving above the signal line, and the AO oscillator histogram is forming bars with an uptrend in the buying zone.
Trading tips
Long positions may be opened after the price rises and consolidates above 955.00 with the target at 1145.00. Stop loss – 900.00. Implementation period: 7 days or more.
Short positions may be opened after a reversal, reduction, and consolidation of the price below 867.00 with the target at 754.00. Stop loss – 900.00.
******All indicator readings and price values are historical data. Past price behavior is not a reliable indicator of future performance.

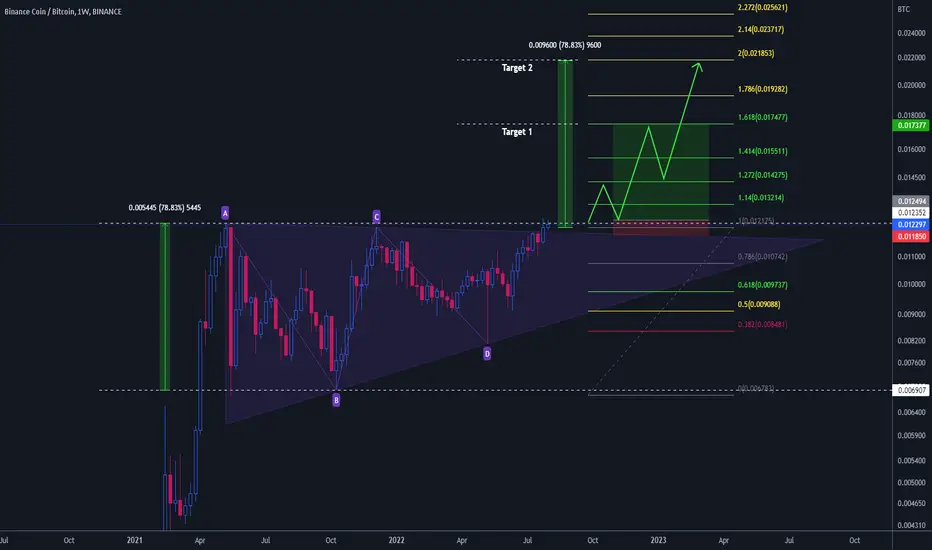
BNB/BTC in ascending triangleBNB is a utility token from Binance exchange.
With it, it is possible to have discounts on trading fees and passive income in DeFi/CeFi.
On the chart we have an ascending triangle about to be broken.
ETHWe have triangle pattern on the Ethereum. If the ETH break up to triangle with volume I'm gonna take a long position.
But ET break down to triangle, I'm gonna take a short position.
Long Position TP - Triangle - Green
Short Position TP1 - Triangle - Red
TP2 - Bearish Flag - Yellow

Manausdt ; Long or what ?Mana has Broken up it's falling channel , Mana also could break up the static resistance on 0.91$ and it's pullback has happened which we can also assume it as rest to 0.5 level of retracement Fibonacci.
I think after a tringle pattern Mana could reach to 1.33$ target. You can use my long Position setup with 2.75 R/R.
Just take care of the stop loss.
what do you think about Mana in 4H timeframe ?
If you have any questions please feel free to text me .

BTC situationHI friends
The current state of bitcoin has become frustrating for many traders
In the long run we are in a process of suffering.
But in the short term we are in a process of reform.The formed patterns mostly confirm the downward trend for us.
But experience has shown that in such a situation, a sharp move occurs unexpectedly.
Descending scenario:
Bitcoin breaks its formed triangle pattern downwards and will fall to the price of 28,100.
A pullback hits Area 29k , which is a strong support area , and continues to fall to 27,400.
Ascending scenario:
Bitcoin raises its price to 30700 with a sharp move and touches its resistance.
Traders are assured of saturation and open sell positions.
After suffering for a few hours in the area of 31k to 30400, it will break its resistance upwards and will have up to 32,000 upward movements.
In this situation, by increasing the purchase volume , it will even be possible to touch area 33k .

REEFUSDT is creating a triangleThe price is creating an ascending channel below the daily resistance of 0.005$.
As you can see the daily area is very strong for the market, and the price got several rejections from that area.
How to approach it?
IF the price is going to have a breakout from that area, According to Plancton's strategy , we can set a nice order
–––––
Keep in mind.
🟣 Purple structure -> Monthly structure.
🔴 Red structure -> Weekly structure.
🔵 Blue structure -> Daily structure.
🟡 Yellow structure -> 4h structure.
–––––
Follow the Shrimp 🦐

BTC planning for more dipHello traders!
BTC is ready to fall more.
Previously, it failed to give big bearish candles, but it is ready for a dip because this pattern is looking strong for sellers.
Chances of moving down have a higher probability than moving upward. We will always go towards better probability.
In this dip, it can touch 28700.
It will form a new pattern at 28700 then we will look for the next move from there.
Don't forget to hit the like button and follow to stay connected.

Will Microsoft let itself be affected by negative events? ⚔️We tend to see triangles everywhere, we realize that this may be redundant for some, but all modes of chartist analysis are good to go.
We also realize that the triangle Microsoft is forming is not the prettiest, but if it is truly a compression triangle, then we could be looking at an upside breakout.
Only time will tell, I must admit that taking positions in these complicated times for everyone is a risky bet, which may or may not be taken for a good performance.
Only two paths are possible, but which one will Microsoft choose?

CanfinHomesCanfinhomes broke out of symmetrical triangle with decent volumes on an hourly charts.
Could be bought with mentioned stoploss & targets.

Triangle Pattern Buy Hello Traders! Here is another oppurtunity for a Buy entry on Gold. This trade is A triangle Pattern off of a. 618 Fibb entry level. Dont Forget to like Follow And Give feedback in the Comments below 👇. Enjoy the Trade.

BMW in triangle pattern !BMW is entering the second suwave of the formation of wave c. is currently forming a correction called the triangle pattern. I will enter when breaking subwave d in the triangle and stop loss right at subwave e with RR 1:3. Another confirmation is that there is a divergence on the RSI.

BTC Short to 41k Wyckoff DistributionWe currently are in a Downtrend ( Wyckoff Distribution Mark down ) , The volume is so low there is currently no accumulation or sign of market maker buying, I am expecting a drop test to 41k very soon.

BTC SHORT Descending TriangleBTC SHORT Descending Triangle Currently in a Bear market, This is a Bear flag to my beautiful eyes.
Risk reward 1:2

Gold t0 2150 targetHi
Gold is in ending diagonal with ABC construction. Macd also confirm this pattern.
We are in fifth wave and raise in his channel to 2150 on the end of August.
Have good trend.

NRG triangleInteresting triangle on NRG, definitely worth to watch, energy sector on a good momentum right now, P/E 4, dividend 3.72%

Triangles, triangles and more trianglesOne of the best trading pattern, that you'll find in every market, are triangles. They are amazing because of a few key benefits:
Very easy to spot.
Clear way to measure them.
They are continuation patterns, so you're not fighting against a trend.
They are easy to indicate brakes or fakeouts.
This is a great article about them: www.investopedia.com
Looking at AVAX/BTC we have a beautiful and clear triangle (it can be seeing as a bullish wedge also) that is breaking up the downtrend and giving us the best confirmation we can see: RETEST.
This can mean many things, the altcoin season may be coming soon, confirmation of AVAX strength over BTC and other coins, demostrating the good development of the AVAX network as fundamentals. But we should always have a target in mind.
So, if the retest is validated and we find support in the MA 50 weekly and the bullmarket band we will be targeting the ATH for AVAX and from there confirming the altseason or just a quick movement against BTC.
Remember that for this to happen BTC has to be bullish as, usually, when BTC moves up some altcoins explode.

Triangle breakoutThe triangle breakout pattern in Bank nifty 15 mins TF chart
What do u think the target is??
Will u trade in this volatile market??
Let me know your views on this
