TRX Global Trend Channel Rising Wedge. January 2026Logarithm. 1-month time frame. Linear chart without market noise. Designed for visual understanding of long-term trend direction.
TRX

$TRX at a key support confluenceAMEX:TRX is pulling back after the strong impulse and is now testing a high-confluence support zone around $0.29–$0.30.
This area lines up with the ascending trendline, 0.5 Fib retracement, and the 100 EMA, making it an important level for bulls.
If this zone holds, we could see a solid bounce, with upside back toward $0.31–$0.32 and potentially higher on continuation.
As long as this support holds, pullbacks remain buyable. A clean breakdown would invalidate the setup.
#TRX

$TRX – Structure Break in ProgressBINANCE:TRXUSDT has broken out of a long descending wedge after weeks of compression and is now holding above the descending trendline.
Key levels from the chart:
Entry zone: 0.300 – 0.306 (retest of breakout area)
Invalidation / SL: Below 0.286
Upside targets:
0.330
0.355 – 0.360 (next major supply zone)
Structure has flipped bullish:
- Selling pressure has been absorbed
- Breakout came from compression, not hype
- Risk is well defined below support
As long as price holds above the breakout zone, bias remains upward.

Tron continuing to climb the measured move lineUsually when you see a measured move line treated like a staircase by price action and by this many consecutive daily candles probability is good that the breakout will be validated. If so, the target for this one is around 43-44 cents. *not financial advice*

TRX/USDT: Controlled Accumulation at the $0.30 GateTRON (TRX) is exhibiting a textbook example of "controlled continuation" on the 4H timeframe following a successful reclaim of the prior resistance zone around $0.298. Instead of rejecting at the psychological $0.30 handle, the market is compressing directly below it, keeping the structure of higher lows intact. This suggests a phase of accumulation rather than distribution.
Why this setup is on our radar:
Structure Integrity: The price action is strictly respecting the rising channel structure. The ability to hold above the recent breakout level ($0.298) confirms that previous resistance has successfully flipped into support (Change of Polarity).
Volatility Compression: We are seeing volatility contract as price hugs the $0.30 resistance. Typically, higher lows grinding into a flat resistance level indicates buying pressure is absorbing the overhead supply.
Volume Profile: Current volume is below average (82M vs 172M Avg), which is characteristic of the "calm before the storm" often seen during consolidation phases before an expansion move.
Technical Levels & Plan:
Buy Zone: The current consolidation range (0.298 - 0.2995) offers an entry aligned with the trend.
Invalidation Level: A 4H close below the yellow demand box and lower trendline support (~0.288) would signal a failure of the rising structure and a return to range-bound trading.
Structural Resistance (Targets): Short Term: 0.305 - 0.312 (Immediate Channel Resistance) Mid Term: 0.340 - 0.370 (52-Week Highs)
Macro / Moonbag: Acceptance above the 52-week high ($0.37) places TRX in macro price discovery territory.
Risological Note: We view the $0.30 level not as a ceiling, but as a "gate." The repeated tests weaken the resistance. We are positioned for the breakout, not the rejection.
Disclaimer: This analysis is for educational purposes only. Crypto assets are highly volatile. This is not financial advice.

TRXUSDT – 4H Chart Update & Analysis. TRXUSDT – 4H Chart Update & Analysis
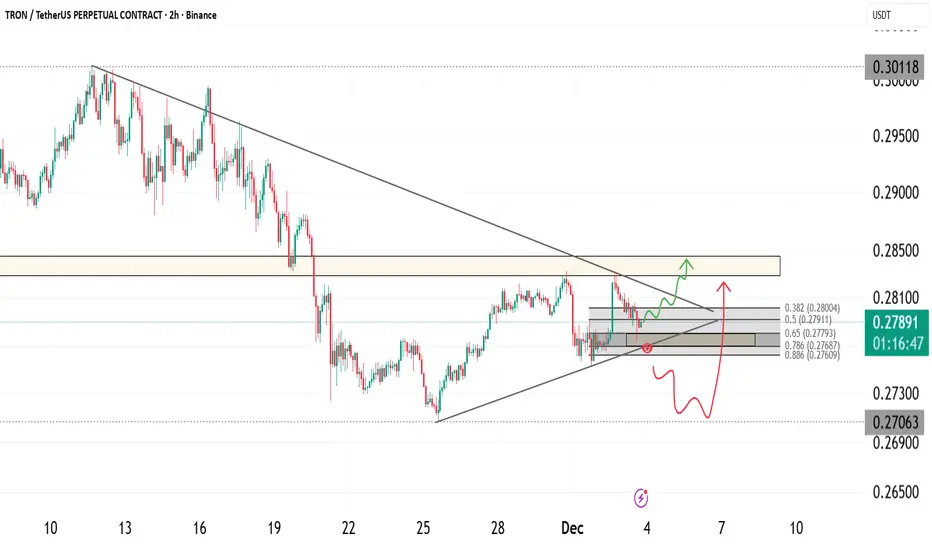
Price is compressing inside a descending broad channel with a short-term ascending triangle forming → volatility squeeze near the apex.
Price is hovering around the 50 MA
Immediate Support: 0.278 – 0.275
Major Support: 0.268 – 0.265
Resistance: 0.285 – 0.288
Breakout Zone: 0.295 – 0.305
Higher lows + flat resistance = pressure building.
A 4H close above 0.288 can trigger a sharp upside expansion (as projected).
Rejection keeps the price ranging inside the structure.
⚠️ Trade only after confirmation.
NFA | Risk management required
TRX TRON Technical Analysis and Trade Idea I’m currently watching TRX / TRON 👀💎.
We can clearly see bullish price action developing on both the Daily and 4H timeframes 📈🔥, which keeps TRX firmly on my radar for a potential buy setup.
That said, I’m not chasing price — I have specific conditions that need to be met ✅📊:
🔹 Scenario 1 – Pullback Entry
If price pulls back into a previous support zone from current levels 🔄📉, I’ll be looking for a bullish break of structure as confirmation before considering an entry 🚀📌.
🔹 Scenario 2 – Continuation Entry
If price continues higher from here 📈, I’ll want to see TRX create a higher high, followed by a healthy retracement back into the current level, which would then act as new support for a possible buy entry 🧠📍.
As always, patience is key — I let price come to me and confirm the bias 🔒📈
⚠️ Not financial advice. Trade responsibly and manage risk at all times.

TRON - Ascending Triangle BreakoutExpecting this large pattern to breakout to the upside as Ascending Triangles do
Reaching near the end of triangle
Weekly chart
Green pattern is just my thoughts on price action in future

TRX 1D LongThe Three Drives Pattern (TDP) reversal formation has formed, and an upward IOF is emerging.
Rebalancing the bullish inefficiency will provide an excellent opportunity to open a long position. 📈

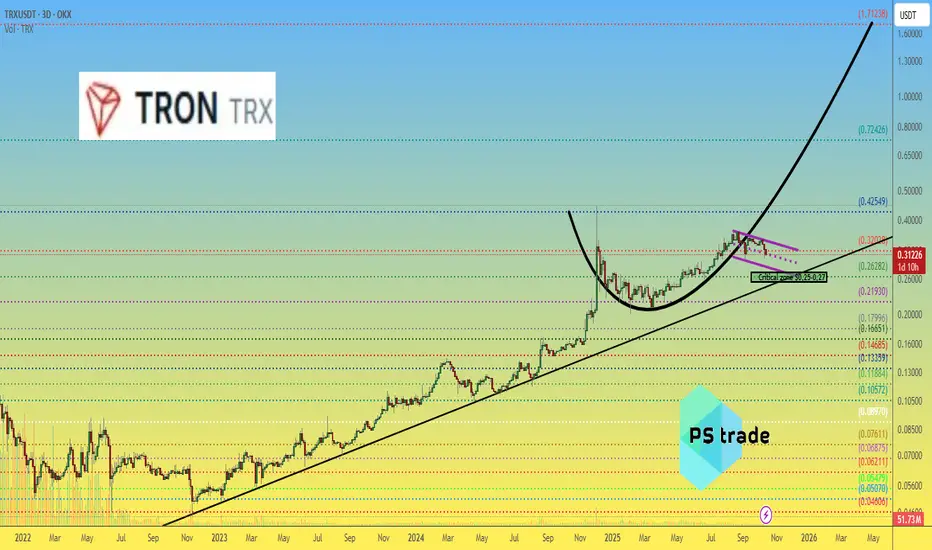
$TRX — The “protected child” of Justin SunOnce again, AMEX:TRX has proven it’s the “favorite child” of its creator, Justin Sun.
Despite the market chaos, OKX:TRXUSDT dropped only ~10%, showing exceptional resilience while many altcoins suffered deep crashes.
The next key support zone is $0.25–0.27, (based on trend line) which previously marked bottoms during the COVID crash (March 2020) and November 2022.
If buyers defend this level, it could act as a strong base for a rebound — possibly up to $1.7.
This structure continues to reflect steady demand and long-term accumulation rather than exit pressure.
💭 Will #Tron repeat its historical bounce from this range, or is the sentiment shifting this time?
______________
◆ Follow us ❤️ for daily crypto insights & updates!
🚀 Don’t miss out on important market moves
🧠 DYOR | This is not financial advice, just thinking out loud
TRON Price Analysis: TRX Returns to a Key Zone – What's Next* TRX has actually maintained a strong uptrend line, which has protected it against various dips over the past year.
* Activity on TRX stays stable despite being close to a critical level of support.
* Should the current level of support hold, a move to the region of $0.30-$0.32 is possible.
When you zoom out on TRON’s recent price action, it’s pretty obvious the market isn’t panicking. the TRX price has been drifting lower in a slow, controlled way rather than collapsing
For a while now, the price has been hovering around the $0.27–$0.28 area, which lines up with a rising trendline that’s already stepped in to catch several pullbacks over the past year. Each time TRX has dropped into this zone, selling pressure has eased and buyers have quietly started to show up again.
What makes this area more interesting is that the on-chain data isn’t falling apart along with price. Even as TRX moved sideways, its market cap stayed fairly stable, which indicates money isn’t rushing out of the ecosystem.
Active addresses and transaction activity have cooled off a bit, but they’re still close to normal levels. That usually points to consolidation, not abandonment.
The real challenge is still overhead. The TRX price has tried multiple times to push above the $0.30 area, only to get turned away near the 100-day moving average. Every time that happens, the price drifts back toward support and the range tightens even more.
That’s why this zone matters so much. If TRX can finally break through $0.30 and hold above it, a move into the $0.30–$0.32 range would feel like a natural next step, not a stretch.
If that breakout doesn’t happen, the downside becomes easier to map out. A clean break below the rising trendline would shift attention toward the $0.25 area pretty quickly. Until then, the TRX price is stuck in between, not weak enough to break down, but not strong enough yet to run.
What’s Next for TRON?
CoinCodex’s one-month TRON price target sits around $0.3011, which lines up almost perfectly with this resistance zone. That makes the current level even more important.
As long as TRX keeps holding the $0.27–$0.28 support area, the setup still leans slightly higher. Lose that support, and the mood changes fast.
For now, TRON isn’t offering an easy trade. It’s in wait-and-see mode. And whatever move comes next out of this range is probably going to say a lot more than the slow grind that brought price here.

The key is whether it can rise above 0.2851
Hello, fellow traders!
Follow us to get the latest information quickly.
Have a great day.
-------------------------------------
(TRXUSDT 1M Chart)
From a long-term perspective, the price needs to remain above 0.18-0.2011 to continue the uptrend.
If it encounters resistance at 0.2851 and declines, we should check for support near the M-Signal indicator on the 1M chart.
If further declines occur, support around 0.18-0.2011 will be crucial.
-
(1W chart)
Looking at the 1W chart, we should examine whether it finds support near 0.2548-0.2851 and can rise.
If it finds support near 0.2548-0.2851 and rises, the key question is whether it can break above the 0.3379-0.3614 range.
-
(1D chart)
Therefore,
1st: 0.2548-0.2851
2nd: 0.18-0.2011
When support is found near the 1st and 2nd levels above, it indicates a period of partial buying.
It is falling below the HA-Low indicator, showing a stepwise downward trend.
Therefore, you should consider either waiting for the stepwise downward trend to stop or increasing the number of coins (tokens) that can be profited through day trading.
-
Thank you for reading to the end.
I wish you successful trading.
--------------------------------------------------

TRX: Bullish with high confidenceHey guys, let's break down what's happening with Tron on the 1-hour timeframe because we're seeing some textbook oversold conditions that could set up a solid mean reversion play.
TRX is currently trading at $0.2772, down 1.29% over the last 24 hours and sitting dangerously close to the daily low at $0.2767. The price action has been grinding lower throughout the session, but what's really catching my eye is the confluence of extreme oversold readings across multiple momentum oscillators. RSI has crashed to 19.2, Stochastic is pinned at 9.7, and Money Flow Index is absolutely wrecked at 11.3 - these are capitulation-level numbers that we don't see every day.
When you get RSI below 20 and Stochastic under 10 simultaneously, you're typically looking at selling exhaustion rather than the start of a fresh breakdown. The ADX reading of 59.1 confirms we're in a strong trending environment, but here's the thing: strong trends paired with extreme oversold conditions often mark the final flush before a bounce. Price is literally kissing the lower Bollinger Band at $0.2766, which has been acting as a technical support floor. The 4.5% lower wick on recent candles tells us buyers are already starting to defend these levels, even if hesitantly.
From a moving average perspective, the picture is clearly bearish. TRX is trading below the EMA20 ($0.2795), EMA50 ($0.2811), and EMA200 ($0.2825), with a confirmed lower high formation that validates the downtrend structure. The HMA55 sits at $0.2795, creating a resistance cluster right around that EMA20 level. This convergence zone between $0.2795 and $0.2801 (Bollinger middle band) is going to be your first major hurdle on any bounce attempt. The MACD remains bearish with the histogram negative (MACD at -0.0011, Signal at -0.0008), so we're definitely fighting against the prevailing momentum here.
But here's where it gets interesting: volume analysis is showing a completely different story. Current volume sits at just $3.26M compared to the 24-hour average of $8.43M - that's only 39% of normal activity. When you see price making new lows on significantly below-average volume, it's a red flag that the move lacks conviction. Sellers aren't piling in with force here; instead, we're seeing passive drifting lower, which often precedes reversals. The 24-hour volume of $64.7M is decent, but the intraday weakness in participation suggests this decline is running on fumes.
Let's talk support and resistance levels because these are critical for framing any trade setup. Immediate support is the 24-hour low at $0.2767, which coincides almost perfectly with the lower Bollinger Band at $0.2766. This is your line in the sand - hold here and we're looking at a bounce; break below with volume and the oversold condition could extend further (though that seems less likely given current momentum exhaustion). On the upside, first resistance is that EMA20/HMA55 cluster at $0.2795, followed quickly by the Bollinger middle band at $0.2801. These levels will likely act as magnets for any mean reversion move.
Beyond that initial resistance zone, the EMA50 at $0.2811 and EMA200 at $0.2825 represent more substantial barriers. The EMA200 in particular is significant because it's been capping rallies and would mark a full retracement of today's decline. The 24-hour high at $0.2834 sits just above that and represents the upper boundary of today's range - breaking above that would flip the short-term structure and potentially signal a trend reversal rather than just a bounce.
For a trading setup, I'm favoring a counter-trend long position here with tight risk management. Entry zone would be in the $0.2770 area, essentially current price levels while we're testing support. Your stop loss needs to be tight given we're fighting the trend - I'd place it below $0.2760 to give about 10 pips of breathing room below the support cluster. That's roughly a $0.001 risk per unit. Take profit targets would be layered: TP1 at $0.2795 (EMA20/HMA55, about 2.5:1 RR), TP2 at $0.2801 (Bollinger middle band, about 3:1 RR), and TP3 at $0.2825 (EMA200, roughly 5.5:1 RR) for those wanting to ride extended bounces.
The risk-reward here is favorable if you're disciplined with your stops. This isn't a high-conviction trend-following setup - it's a tactical mean reversion play based on extreme oversold conditions and weak selling volume. The confidence level sits around 73%, which reflects the fact that we're trading against the prevailing trend but with strong technical justification from momentum indicators. You're essentially betting that the rubber band has stretched too far and needs to snap back toward the mean.
One scenario to watch: if we do get that bounce to the $0.2795-$0.2801 zone and price gets rejected hard with increasing volume, that would actually be a great short setup for continuation lower. But right now, at these oversold levels with price testing support, the path of least resistance for a short-term move appears to be up rather than down. The bearish structure remains intact on higher timeframes, so this would be a scalp rather than a swing trade - get in, take profits at resistance, and don't overstay your welcome.
What are you thinking on this setup? Are you comfortable fading this weakness for a bounce, or would you rather wait for confirmation above $0.2795 before getting involved?

TRX/USDT — Long-Term Trendline Test: Bounce or Breakdown?TRX has maintained a multi-year higher-high, higher-low structure, making it one of the most stable altcoins in a volatile market cycle. But now, price is sitting directly above the primary ascending trendline — the same trendline that has supported TRX’s entire bullish expansion since early 2023.
This weekly zone is a major decision point:
Will TRX extend its long-term bullish structure, or will it break down and enter a deeper correction phase if the trendline and the $0.212 support fail?
---
The long-term uptrend remains intact as long as the trendline holds.
The price is currently retesting the trendline — a zone that historically triggers strong reactions (powerful bounce or sharp breakdown).
The horizontal level at $0.212 acts as the critical structural support.
Current movement looks like a healthy pullback, not a full reversal (unless the trendline breaks).
---
📈 Bullish Scenario — “The Continuation Rally”
If TRX successfully holds the trendline and forms a bullish reaction, the next leg of the uptrend may begin.
Bullish Confirmation Signals:
Strong weekly close above the trendline
Bullish reversal candle (pin bar, hammer, or engulfing)
Increase in buy volume during the trendline retest
Bullish Targets:
1. $0.32 – $0.35 → first resistance zone
2. $0.45 → major 2025 peak
3. Break above $0.45 → potential long-term price discovery
Bullish Narrative:
“As long as the trendline holds, this is not a correction — it’s a refueling phase before the next rally.”
---
📉 Bearish Scenario — “Trendline Breakdown Phase”
If TRX loses the trendline on a weekly close, the long-standing bullish structure may break for the first time since 2023.
Bearish Confirmation Signals:
Weekly close below the trendline
Retest of the trendline turning into resistance
Weekly close below $0.212 → full structure breakdown
Bearish Targets:
Deeper correction into the next major demand zones
Larger volatility due to long positions liquidating below the trendline
Bearish Narrative:
“A trendline breakdown is not a pullback — it signals a structural reversal.”
---
📌 Pattern Summary
Primary Pattern: Long-term rising trendline
Current Phase: Controlled weekly pullback
Possible Outcomes:
Bull Flag continuation (if price bounces)
Trendline Breakdown (if price closes below support)
---
🎯 Final Conclusion
TRX is positioned at a critical structural level where the market will decide between a continuation of the multi-year uptrend or a macro correction phase.
The next few weekly candles will be decisive.
---
#TRX #TRXUSDT #CryptoAnalysis #TechnicalAnalysis #Trendline #WeeklyChart #Altcoins #BullishScenario #BearishScenario

FireHoseReel | TRX Technical Outlook After Resistance Break🔥 Welcome to FireHoseReel!
Let’s jump into the TRX market structure analysis.
👀 TRX – 4H Overview
TRX has successfully broken above the $0.2824 resistance and is now pushing higher.
Over the past 24 hours, TRX trading volume has dropped by 20%.
📊 Volume Analysis
Watch the volume closely on the chart. Every time price previously reached $0.2824, it faced strong sell pressure and sell orders were heavily filled.
On the third and current test, fewer sell orders were present, and with a slight increase in volume, this resistance was finally broken.
✍️ TRX Trading Scenarios
Below are the active scenarios you can use alongside your trading strategy:
🟢 Long Scenario
Since TRX has broken this resistance, you can enter a long position, placing your stop-loss below the current low.
Alternatively, wait for better consolidation above this level and enter on the pullback for a safer setup.
🔴 Short Scenario
A break below the $0.2791 support, accompanied by strong selling pressure, could lead to a deeper drop and offers a valid short setup.
🧠 Protect your capital first. No setup is worth blowing your account. If risk isn’t controlled, profit means nothing. Trade with rules, not emotions.

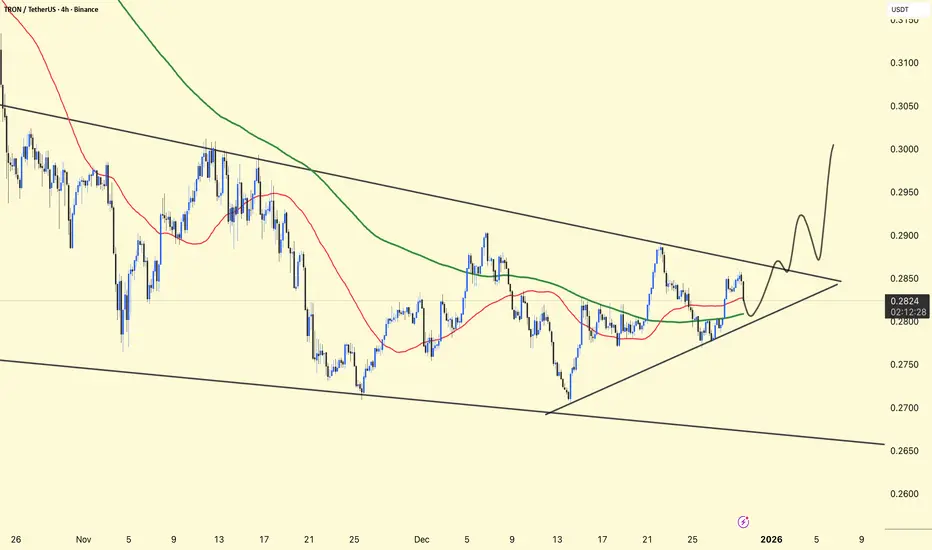
TRX Approaching Key Breakout Zone as Structure TightensTRX is approaching a critical decision point inside a compressing structure where price is being held between diagonal resistance and a rising support line. The market has printed a clean series of higher lows while repeatedly testing the same resistance, suggesting growing pressure beneath the price.
The current reaction inside the grey fib zone shows that buyers are active, and as long as this support holds, TRX can attempt another push into the supply region highlighted above. The behaviour inside this zone will determine whether price continues upward or rejects for a deeper pullback.
The zone around 0.282 to 0.286 is the important breakout region to watch. If price reclaims it, momentum can shift upward rapidly toward the next liquidity pockets.
Key Notes
• Price is compressing into an apex between support and diagonal resistance
• Fib retracement region is holding as intraday support
• Liquidity sits above the 0.282 to 0.286 supply region
• Higher lows suggest accumulation behaviour
Bullish Scenario
If TRX continues to hold the fib support and breaks above 0.282, the structure opens room for a move toward the upper supply zone with potential follow through.
Bearish Scenario
Failure to hold the grey support region can push price back to retest the lower trendline around 0.270.
Invalidation
A clean break and continuation below 0.270 invalidates the bullish setup and delays any potential breakout.
Simple explanation
TRX is squeezing into a decision point. Holding support gives it room to break out. Losing support sends it back to the lower trendline. Watch how price behaves around 0.282 because that level decides everything.
HUMA/USDT – Reversal Incoming or Deeper Breakdown?HUMA has been moving inside a large Descending Channel for months, forming a repeated yet controlled pattern of selling pressure. Every rally has consistently failed to break the upper trendline, maintaining a strong lower-high structure. But now, something important is happening:
👉 Price is sitting directly above the Key Support at 0.025–0.0225, a long-standing “life-or-death” zone for buyers.
This is not just another support — this is the final defense before a major structural breakdown or a powerful market reversal.
---
🔶 Clear Technical Structure
1. Descending Channel (Major Trend)
The trend remains bearish, but the channel is tightening — an early sign of momentum shift.
2. Key Support Box (0.025–0.0225)
This zone has acted as a strong demand area multiple times.
The more it gets tested, the bigger the potential move — either a breakout upward or a sharp breakdown.
3. Midline Reaction
Price frequently reacts around the midline, showing that market participants are respecting this dynamic level.
4. Key Horizontal Targets
0.031 → 0.037 → 0.0445 → 0.055 → 0.067
These levels are not only resistance but also potential rally checkpoints if structure shifts bullish.
---
🟢 Bullish Scenario (Major Reversal Potential)
Bullish bias becomes valid only if:
1. Price breaks the upper trendline with clean momentum.
A breakout without volume is not valid.
2. Daily close above 0.031.
This confirms the long-term downtrend is weakening.
If confirmed, bullish targets:
TP1: 0.037 (nearest resistance, minor rejection zone)
TP2: 0.0445 (major structural resistance)
TP3: 0.055 (bullish structure activation)
TP4: 0.067 (high-value upside target)
Bullish Intent
The channel has extended for a long period — sellers may be exhausted.
Price is stabilizing near strong support.
Large reversals often begin from areas like this.
---
🔴 Bearish Scenario (Trend Continuation)
Bearish momentum continues if:
Daily close falls below 0.0225.
This would indicate the final support has failed.
Bearish downside targets:
T1: 0.018 (mid-to-lower channel zone)
T2: 0.015–0.0135 (lower boundary, potential capitulation sweep)
Bearish Intent
The Descending Channel remains dominant.
Selling pressure is still strong near the upper trendline.
Losing the key support can trigger panic-driven moves.
---
🎯 Market Psychology
The 0.025–0.0225 level currently represents:
A slow accumulation zone for smart money, or
A distribution zone before continuation downward
At this stage, the market is choosing its next direction — and the move that follows this zone is usually significant.
---
#HUMA #HUMAUSDT #CryptoAnalysis #TechnicalAnalysis #DescendingChannel #ReversalZone #BreakoutWatch #CryptoTrading #AltcoinAnalysis #MarketStructure #SupportAndResistance #ChartPatterns

TRON below its 1W MA50 after 2.5 years! Is Bear Cycle confirmed?Tron (TRXUSD) closed last week below its 1W MA50 (blue trend-line) for the first time since March 20 2023. Those +2.5 years it has been riding the new Bull Cycle within a Channel Up that peaked on the December 02 2024 1W candle, around the majority of the altcoin market.
The current 1W MA50 break seems similar to the December 13 2021 one that was also initiated after a 0.236 Fibonacci level rejection and confirmed the subsequent Bear Cycle. With the 1M RSI brutally falling below its MA, we believe the market may have again confirmed the new Bear Cycle and the next target (as then) is the 1W MA100 (green trend-line).
Our long-term projection for a Cycle bottom is the 0.786 Fib, unless the 1W MA200 (orange trend-line) gets hit after August 2026. If not we believe the market may bottom around at least 0.16500, which is still a more optimistic scenario as it falls even above the 0.5 Fibonacci retracement level from the November 14 2022 (previous) bottom.
---
** Please LIKE 👍, FOLLOW ✅, SHARE 🙌 and COMMENT ✍ if you enjoy this idea! Also share your ideas and charts in the comments section below! This is best way to keep it relevant, support us, keep the content here free and allow the idea to reach as many people as possible. **
---
💸💸💸💸💸💸
👇 👇 👇 👇 👇 👇

TRON (CRYPTO: $TRX) Shift After Ending USDJ Strengthens Its CoreTRON (CRYPTO: CRYPTOCAP:TRX ) has entered a new phase after officially retiring USDJ, its algorithmic stablecoin that has existed for over five years. Holders can now redeem at a fixed rate of 1 USDJ = 1.5532 TRX, closing the chapter cleanly and without market disruption. The shutdown signals TRON’s transition toward fully collateral-backed stablecoins like USDD and the massive USDT supply already dominating the chain. Globally, regulatory pressure continues moving the industry away from algorithmic models, making TRON’s timing strategic and aligned with long-term stability.
The shift also clears legacy risks and simplifies the ecosystem, helping new users and institutions navigate TRON more easily. Analysts view this move as a maturity milestone that prepares TRON for its next wave of products and infrastructure upgrades.
TRON’s dominance in the stablecoin sector remains unmatched. The network now hosts over 60% of the entire USDT supply, exceeding $78.5 billion, and continues to lead global settlement volume. In October, TRON processed $775.2 billion in monthly transactions, supported 76.4 million transfers, and maintained near-zero fees with sub-second finality. These metrics highlight why TRC-20 USDT is the preferred digital dollar across emerging markets, remittance corridors, and high-frequency commercial systems.
This dominance directly reinforces TRX utility. Higher settlement flows create more demand for bandwidth and energy, increasing long-term token usage. TRON’s infrastructure remains reliable, with protocols like JustLend, SunSwap, WINkLink, and JustStables anchoring billions in TVL. Tether’s consistent preference for TRON further accelerates liquidity growth.
Technicals
TRX rebounded strongly from the $0.28 demand cluster, forming a narrowing wedge with higher lows. Holding above $0.280–$0.285 keeps bullish momentum intact. Breaking $0.31 opens the path to $0.34, with a stretch target at $0.37. Losing support risks another retest of lower levels.

TRON: an inverse Head and Shoulders Hi!
Trend Overview:
The chart shows a prolonged downtrend, highlighted by the steady descending trendline. Price has been making lower highs and lower lows, consistent with a bearish market structure.
Trendline Break:
Recently, a shorter-term descending trendline was broken to the upside, signaling potential bullish pressure and a shift in momentum.
Pattern Formation:
A classic inverse head and shoulders pattern has formed:
Left Shoulder: 0.2900 level
Head: 0.2765 level
Right Shoulder: ~0.2920 level
This pattern suggests a potential reversal from the prior downtrend to an upward move.
Target Zone:
The target of the head and shoulders pattern is marked around 0.3140–0.3180, representing the measured move from the head to the neckline. This is a key resistance zone where sellers might appear.

TradeCityPro | TRX Pressured at Key Breakdown Level👋 Welcome to TradeCityPro!
In this analysis, I want to review the TRX coin, one of the oldest projects in the crypto space, with a market cap of $27.65 billion, currently ranked 8th on CoinMarketCap.
⏳ 4-Hour Timeframe
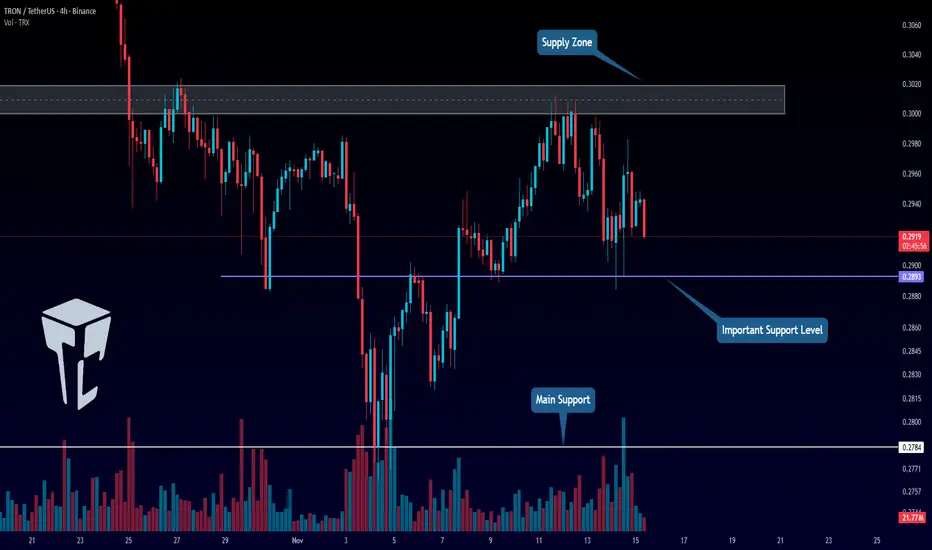
On this timeframe, as you can see, TRX is facing a very strong resistance zone, from which it has recently been rejected and has started a minor correction.
⭐ The support level currently holding this coin is at 0.2893, and during this correction phase, the price has already tested this level several times with long wicks.
✔️ At the moment, the price is hovering close to this support zone.Breaking below 0.2893 could serve as a solid short trigger.
🎲 The next support zone, if 0.2893 breaks, is around 0.2784, which can be used as the target for the short position.
💥 For long positions, the current trigger is the breakout of the resistance zone. A successful breakout above this area could mark the start of a new bullish trend for TRX.
📝 Final Thoughts
Stay calm, trade wisely, and let's capture the market's best opportunities!
This analysis reflects our opinions and is not financial advice.
Share your thoughts in the comments, and don’t forget to share this analysis with your friends! ❤️
Could TRON #TRX 6X v #BITCOIN TRXBTC
has very good market structure
(higher high's , higher lows's)
for the past 3 years.
Overlooked , & under-appreciated it seems like, in my view on it's sentiment on Justin's success of network adoption.
We can see a clear Inverse head and shoulders
with a very key neckline level
that if broken with strength
could a indicate a run at the LOG target.
A disappointing TRX may only reach the linear target and not much beyond.
My TRXUSD chart which I am watching also does point to a stellar Bull market for TRX

TRXUSDT.P - November 4, 2025TRXUSDT.P is currently in a corrective phase after a sustained bearish move, with price consolidating around the $0.2840 level. The structure shows a potential for bullish continuation if the market successfully holds above the $0.2813–$0.2807 support zone. Two buy limit areas are identified at $0.2813 and $0.2865, suggesting layered entries for a potential upside move toward the $0.2922–$0.2940 resistance zone.
A confirmed break above $0.2865 would strengthen the bullish outlook and signal a shift in short-term momentum. Conversely, a decisive breakdown below $0.2759 would invalidate the bullish setup and reopen the path toward deeper downside targets near $0.2740.
Risk Assessment: Moderate-to-high risk — price remains within a fragile consolidation phase after a bearish trend. While early signs of accumulation are visible, failure to defend the $0.2800 area could trigger renewed selling pressure before any sustainable reversal develops.
