#NKNI take a long with a small stop. On a break down, you can similarly take a short with a stop above the line...NLongby VGBlogInvest225
Future direction logscale Trx!I believe we are bottom of the channel.. and the potential for Trx is exceptional for the next few years in reaching $12+ usd. Perfect time to buy and hodl if you haven't done so already, otherwise set yourself up for future success now. Peace!Longby Immortalsouls2211
Tron Is Trying To Turn Bullish (+ 70% Target)Tron (TRXBTC) is printing some weird price action while it tries to break above EMA50. Above EMA50 (0.00000155) it can easily grow. You can see the targets and additional information on the chart. Namaste.Longby MasterAnanda2218
trxusdtp sell analyst by ichi . price action . rsi . technical trxusdtp sell analyst by ichi . price action . rsi . technical classic . and go go go to position sell . i will 50% volume buy in tp1 and 25% tp2 and risk free dont forget ... good luck .Shortby thetrader207610281
TRX - daily outlookI have the impression that the tronix is one of the major corners least affected by the fall of the btc... Lots of support around $0.05/0.06by AmirInsight1
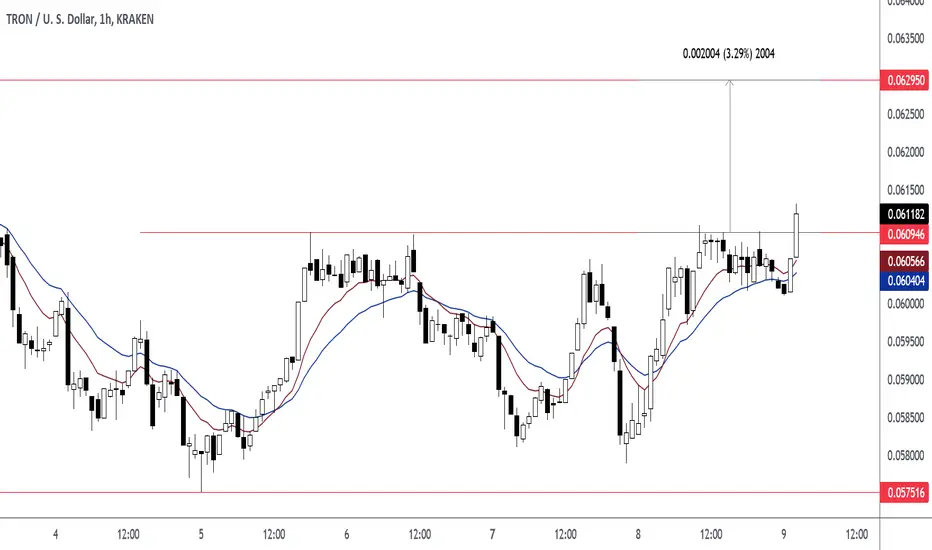
Take Profit: 0.062950 (TRXUSD)Price closed above 0.060946. A close above 0.060946 exposed 0.062950 resistance level as the take profit target level. Entry at 0.061182. Take Profit at 0.062950.Longby TradeLive-1
Trading opportunity in TRXUSDTBased on technical factors there is a short position in : 📊 TRXUSDT Tron 🔴 Short Now 0.06035 🧯 Stop loss 0.06180 🏹 Target 1 0.05940 🏹 Target 2 0.05785 🏹 Target 3 0.05560 💸Capital : 1% We hope it is profitable for you ❤️ Please support our activity with your likes👍 and comments📝 Shortby NamchaTa0
TRON longTRON bounced off the ascending trendline. Asset broke through the descending trendline. Bullish movement to resistance level at 0.669 is possible.Longby Cryptobees_buzz1
TRXBTCHello Crypto Lovers, Mars Signals team wishes you high profits. We are in the daily time frame. The price is fluctuating below the first resistance line which has rejected the price several times. We expect this line to be broken and if so, it will move up to the first resistance zone. After hitting the second resistance, it can form an inverse H&S pattern. If the first resistance is not broken, it will move down to the first support line. Warning: This is just a suggestion and we do not guarantee profits. We advise you to analyze the chart before opening any positions. Wish you luck05:07by MarsSignals223
🔴TRX is retaining the support floor still ▶️ TRON ⏰ Time Frame : 1D ✴️ If the correction is finish, this range can be considered for drawing fibo ( 0.12933 - 0.05101 ) Resistances has shown by Fibonacci numbers. 🔴 and has shown support zone . It is important to maintain this area ❓ What Do you think about Continue of trend? Please tell me ⚠️ (This isn't a signal for buy or sell) #️⃣ 2022 / 04 / March 👸 Analyzed by : Parisa_Alipoorby parisa_alipoor131321
TRON Could Test 5.5 cents before going to $10+ next yearWave-B has formed into a double combination which are normally retraced 80%. Wave-E from beginning to end should also be related to wave-C by 61.8% in price, and C+D in time. This leaves us with a target of 5.5 cents for TRX, which could happen around February or March. Following this correction we should see an explosive rally which will take TRX well above all time highs because this will be the actual end of the 4 year bear market pattern. It could go higher than $10 next year and then even higher in the following year. Positive regulations from the US will be a major driver of crypto prices next year as new institutional money starts entering because of regulatory clarity. High inflation will also be a major driver of higher prices in later 2022.Shortby IntuitUpdated 292949
✴️ SHIB - 4H ✴️✴️ SHIBusdt ⏰ Time Frame : 4h 🟡 The price is still moving in the downtrend channel . And will react to descending lines. 🟢 If the channel breaks upwards, an ascending scenario can occur. ❓ please tell me about your idea 🌼 📛 Please follow the market trend and decide to buy or sell. ⚠️ (This isn't a signal for buy or sell) #️⃣ 03 / 03 / 2022 👸 Analyzed by : Parisa_Alipoorby parisa_alipoor121222
TRON - Medium TermOn a daily timeframe, Tron is in a position that is suitable for medium-term arrivals, with 0.068 and 0.075 targets. Be sure to observe your input volume so that if we are in a critical situation, we can transfer the average purchase to lower prices by increasing the input volume.by MonoCoinSignal171792
Trading opportunity in TRXUSDTBased on technical factors there is a long position in : 📊 TRXUSDT 🔵 Long Now 0.06000 🧯 Stop loss 0.05700 🏹 Target 1 0.06230 🏹 Target 2 0.06660 🏹 Target 3 0.07140 💸Capital : 1% We hope it is profitable for you ❤️ Please support our activity with your likes 👍 and comments 📝 Longby NamchaTa1111
#TRX is going to a good position for #SHORT in15M TRX/USDT is GET the good setup for SHORT POSITION by BREAKING DOWN the trend line in 15M Time F You Can get This Position With 10X LEV GOOD LUCK & Don't Forget to set the SL & TP Shortby mazihowk2
Can TRX use energy for growth?Hello everyone, let's do the 1D TRX / USDT review. As you can see, the price is below the downtrend line. Let's set the two closest supports which are at the levels: $ 0.05564 and $ 0.05132. while looking the other way, we can establish several resistance lines that the TRX will have to overcome on its way. The first resistance is at $ 0.07038 and the next resistance is at $ 0.08188 and $ 0.09087. It is worth noting that on the CHOP indicator we regain energy again and there is quite a lot of it.by cryptodailyuk4
TRX, TRON, local long idea. Trend line break up patternTRX, TRON, local long idea. Trend line break up pattern Coin follow BTC03:01by Yuriy_BishkoUpdated 1127
🌒 LUNA - 4H 🌒🌒 LUNAusdt ⏰ Time Frame : 4h 🌗 I've two senarios that shown in the chart. 🟠 Supports and Resistances are in the chart , and fib retracement is in the Daily Time ( 5.59 - 103.60 ) I showed in my previous idea ⚠️ (This isn't a signal for buy or sell) #️⃣ 02 / 23 / 2022 👸 Analyzed by : Parisa_Alipoor Shortby parisa_alipoor4415
🌒 LUNA - 1D 🌒🌒 LUNAusdt ⏰ Time Frame : 1D 🌗 The price is moving in the downtrend channel . If the price breaks above the channel, then growth to 60.64 - 66.16 I've two senarios that have shown in the chart. ⚪ Please check my next idea in the lower time frame ⚠️ (This isn't a signal for buy or sell) #️⃣ 02 / 23 / 2022 👸 Analyzed by : Parisa_AlipoorShortby parisa_alipoor4414
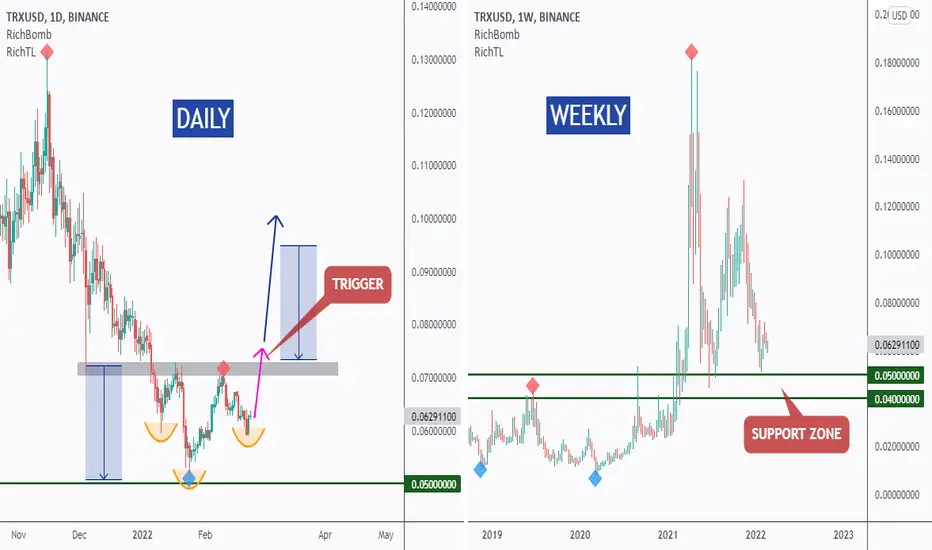
TRX - Top-Down Analysis!Hello everyone, if you like the idea, do not forget to support with a like and follow. WEEKLY: Right Chart TRX is sitting around strong support in green so we will be looking for buy setups on lower timeframes. DAILY: Left Chart TRX is forming an inverse head and shoulders pattern but it is not ready to go yet. Trigger => Waiting for a momentum candle close above the gray neckline to buy. Meanwhile, until the buy is activated, TRX would be overall bearish can still trade lower inside the green support. Good luck! All Strategies Are Good; If Managed Properly! ~RichLongby TheSignalyst232318
TRXUSDT - Falling Wedge PatternTRXUSDT (4h Chart) Technical analysis TRXUSDT (4h Chart) Currently trading at $0.0628 Buy level: Above $0.0626 Stop loss: Below $0.059 Target 1: $0.0644 Target 2: $0.0668 Target 3: $0.070 Target 4: $0.074 Max Leverage 3x Always keep Stop loss Follow Our Tradingview Account for More Technical Analysis Updates, | Like, Share and Comment Your thoughts Longby GreenCryptoTrades12
TRXUSDT TECHNICAL ANALYSISTRON lost over 65% last year April till now and $TRX hasn't reached out last ATH yet. The candles are staying on Support level and whole candles are in triangle. If recent candle open-close completely above to support line, it might be an opportunity for buy. One of the coming candle break out down trend-line and later candle open-close completely above down trend-line, it may another opportunity to buy as well. We haven't got buy signal from @EngineeringRobo daily time frame yet but we have got multiples buy signals in 3H time frame. MA7&25 changed direction on negative way but when we look at the MA20&50, it changed direction on positive way as well. We haven't got any buy signals on MA20 or MA50 yet. Also, if candles stay above to up trend line, it may gain more. But do not do any trade while candles are in triangle. Wait for clear out then move forward. Let's follow our chart together. "NFA"by ABSTOCKER5
TRX/USDT - Potential 183% SetupHello Traders! TRX demonstrates the continuation of the correction phase, completing the previous cycle. It's better to form a medium-term position by buying from support levels of $0.0495, $0.0430, $0.0370. It will be necessary to close the position in case of price fall under the level of $0.0240. The profit taking targets within the medium term by the levels of $0.0830 $0.0930 $0.1050 Good luck and watch out for the market P.S. This is an educational analysis that shall not be considered financial advice Longby UnknownUnicorn100640300