Get ready for Tron LegendOne of the cheapest transfer methods between exchanges is trx. We think it will see the value it deserves very soon.
Tron

Resistance becomes Support!We've waited such a long time for this moment with Tron. Seems to be the narrative with a lot of altcoins right now. Huge falling wedges that are now starting to breakout.. eg. Xrp.. Vechain etc! Utility tokens! Although Trx seems to be a bit further ahead in the charts, so I expect Tron to start moving first! Get ready!

TRON Weekly View - March 2023Hello Guys, Weekly Analysis is on the TRXUSDT Symbol in a 1H Time frame, I Hope it Will be Useful for You, Don't Forget to Like, Follow, Comment

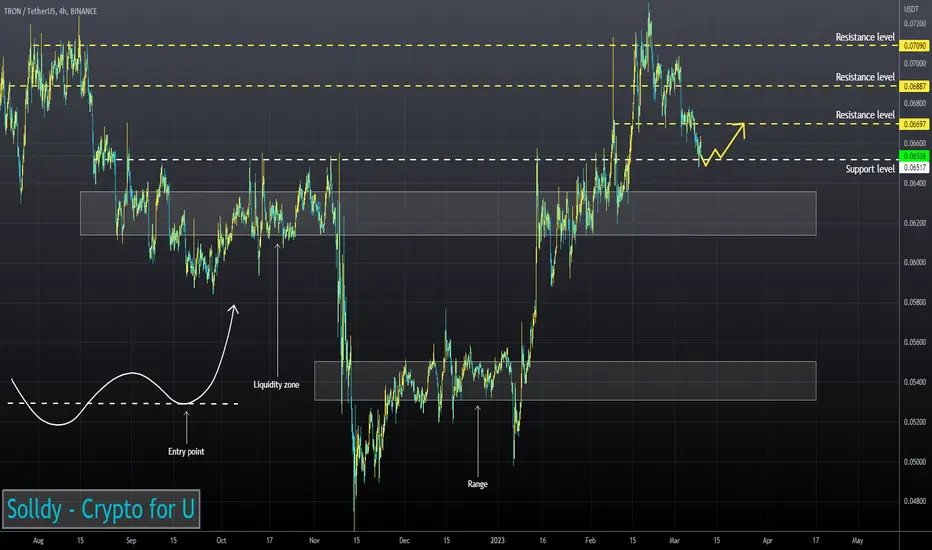
TRXUSD ❕ above the liquidityTRX trades above liquidity.
The asset has successfully held the support level.
Price will bounce after it fixes above the support level.

Quick scalpsWe could see a move to .062 possible .064 in the daily.
However I expect further decline in the market (bearish)
In on another buy for now up to at least $0.062 but then shorting for another entry
TRXUSD: Trendline EntrySimple Trendline Trade Entry on Tron.
I usually look fore more but this feels like more of a simple situation and Tron usually goes for the simpler outcomes.

TRXUSD ❕ descending wedgeTRX is trading above liquidity.
The RSI chart is moving in the buy zone (1H and 30m TFs)
I believe the asset could bounce from the current support level.
✅TS ❕ TRXUSD: downtrend✅✅ TRX continues to move in a downtrend.
The asset will continue to decline. ✅
🚀 SELL scenario: short to 0.0639. 🚀
----------------------------------------------------------------------------
Remember, there is no place for luck in trading - only strategy!
Thanks for the likes and comments

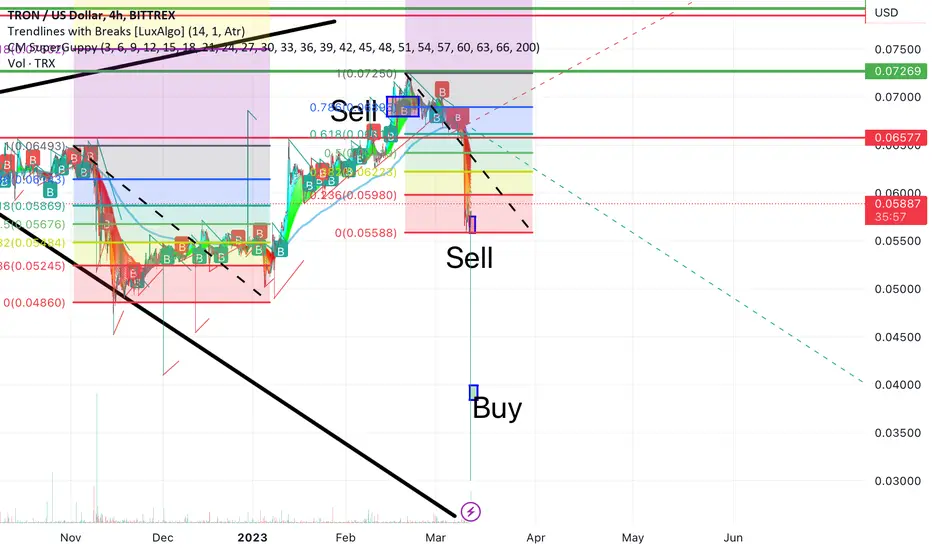
trxit the candle closed under the red line we can open sell position with R/R2 but do not closed all position just 35 %

TRX
In the past, a triangle was formed that achieved a 7X and currently the same model is being formed with the goal of achieving at least a 5X.

✅TS ❕ TRXUSD: support level✅✅ TRX is testing the support level after the previous bounce.
The asset will continue to grow if it holds support. ✅
🚀 BUY scenario: long to 0.0702. 🚀
----------------------------------------------------------------------------
Remember, there is no place for luck in trading - only strategy!
Thanks for the likes and comments

TRXUSD: Cup With Handle Visible on the MonthlyTRX had a similarly Bullish ABCD BAMM Pattern on the FTX chart but that has since played out and gotten shut down. Now we move on to currently active exchanges and we can still see a Potential ABCD BAMM and a Cup With Handle; if we can stay above the moving averages i suspect we will pump to the measured move between the 1.414 and 1.618 Fibonacci Extensions above.

TRON Weekly View - February 2023Hello Guys, Weekly Analysis is on the TRXUSDT Symbol in a 4H Time frame, I Hope it Will be Useful for You, Don't Forget to Like, Follow, Comment

TRX IdeaTRXUSDT | TRXUSD
✅ ✅ Risk warning, disclaimer: the above is a personal market judgment and analysis based on published information and historical chart data on The trading view,
And only some of these analyzes are my actual real trades.
I hope Traders consider I am Not responsible for your trades and investment decision.

TRXUSDT Symmetric Triangle Breakout!TRXUSDT Technical analysis update
Buy zone: Below $0.071
Stop loss : $0.062
Take Profit 1 : $0.078
Take Profit 2 : $0.090
Take Profit 3 : $0.105
Take Profit 4 : $0.128
Swing trade setup
Thanks
Hexa

TRXUSD ❕ support zoneTRX is trading near the support area.
TD Sequential has formed an upside reversal signal (1H TF)
I expect a rebound when it fixes above the lower support boundary.

TRX triangle breakoutPlease 1st of all click the boost 🚀 button if you want me to post more ideas and follow me to support my work! It's absolutely for free.
Tron broke up this triangle📐 and now backtested it's upper edge. I think there is chance for run to 0.06905 and even lower. Buying here makes sense to me.
ENTRY : @ 0.06270
STOPLOSS (SL) : local high @ 0.06093
TARGET (TP) : height of the triangle projected from midpoint of the local range @ 0.06905
REWARD RISK RATIO (RRR) : 3.3
INVALIDATION : when SL level hit
Check my other stuff in related ideas.
Please boost🚀, comment🗣️, follow me✒️, enjoy📺!
⚠️Disclaimer: I'm not financial advisor. This is not a financial advice. Do your own due dilingence.

TRX inverted H&SIn the beginning of this year Tron broke up the major downtrendline☝️. Then after this👇 sucessful call...
... TRX formed Inverted Head and Shoulders 🤷 on the daily timeframe and triggered the pattern by breaking the neckline up (zoom in to see the details). Price then fell back down below the neckline and recently broke up once again. I think there is chance for run to 0.08555 and even higher. The yellow uptrendlines could act as a guide.
INVALIDATION (SL) : Right Shoulder @ 0.05879
TARGET (TP) : Inverted H&S target projection @ 0.08555
Check my other stuff in related ideas.
Please boost🚀, comment🗣️, follow me✒️, enjoy📺!
⚠️Disclaimer: I'm not financial advisor. This is not a financial advice. Do your own due dilingence.

Tron's price volatility range is expected at a level of $0.060For the current week, we can expect the trend to be in the range for the current week, as long as we do not have a strong return below the $0.060 level. But if the selling pressure increases, Tron's price decline can continue to the bottom of the channel, i.e. the support range of $0.056 to $0.058. This week, the TRX price volatility range is expected at a level of $0.060.

TRON Weekly View - February 2023Hello Guys, Weekly Analysis is on the TRXUSDT Symbol in a 4H Time frame, I Hope it Will be Useful for You, Don't Forget to Like, Follow, Comment

Contracting Bollinger Bands on the 1W chartHello?
Traders, welcome.
If you "Follow", you can always get new information quickly.
Please also click "Boost".
Have a good day.
Following yesterday, today we changed the background color of the chart.
Please leave a comment on which chart is more eye-catching, yesterday's background color or today's background color.
For your information, there is a significant difference between viewing a chart in real time and sharing a chart with a picture.
Therefore, I would be grateful if those who share and use my charts leave comments.
-------------------------------------
(TRXBTC 1W Chart)
The key is whether it can rise above 0.0000 0318 in order to release the upward force.
---------------------------------------
------------------------------------------
(TRXUSDT 1W chart)
The key is whether it can be supported at 0.06427.
In particular, as the Bollinger Bands are contracting, volatility is expected in the near future.
(1D chart)
It is important to be able to rise above the 0.06427-0.06532 section and be supported.
If not, you should check for support around 0.06004.
TRX is holding the price near the M-Signal on the 1M chart, so it can be clearly seen that the long-term trend is about to turn into an uptrend.
Therefore, as mentioned in the explanation of the 1W chart, it can be seen that the current position is located in a very important section.
If the mid- to long-term wiggle starts, there is a possibility of touching around 0.05358, so you should think about how to respond now.
-------------------------------------------------- -------------------------------------------
** All descriptions are for reference only and do not guarantee profit or loss in investment.
** If you share this chart, you can use the indicators normally.
** The MRHAB-T indicator includes indicators that indicate points of support and resistance.
** Check the formulas for the MS-Signal, HA-Low, and HA-High indicators at ().
(Short-term Stop Loss can be said to be a point where profit or loss can be preserved or additional entry can be made by split trading. This is a short-term investment perspective.)
---------------------------------

✅TS ❕ TRXUSD: ascending wedge✅✅ TRX has formed an ascending wedge.
The price is testing the support level.
The reversal will begin after consolidation under the support level. ✅
🚀 SELL scenario: short to 0.0602. 🚀
----------------------------------------------------------------------------
Remember, there is no place for luck in trading - only strategy!
Thanks for the likes and comments

TRX/USDT pumping is near?Hi Dears
Do you heard about WOW TRADE strategy?
We have a higher time frame trendline line (weekly). We are near the demand in control zone of higher timeframe. We break the trendline and after that we have a pullback to the trendline, base that cause this breaking or break even zone.
After that the price will be in the moon.
And now we are watching this strategy for trx usdt.
I hope it works properly.
Sincerely
Hosein Poursaei
