TRXUSDT – 4H Chart Update & Analysis. TRXUSDT – 4H Chart Update & Analysis
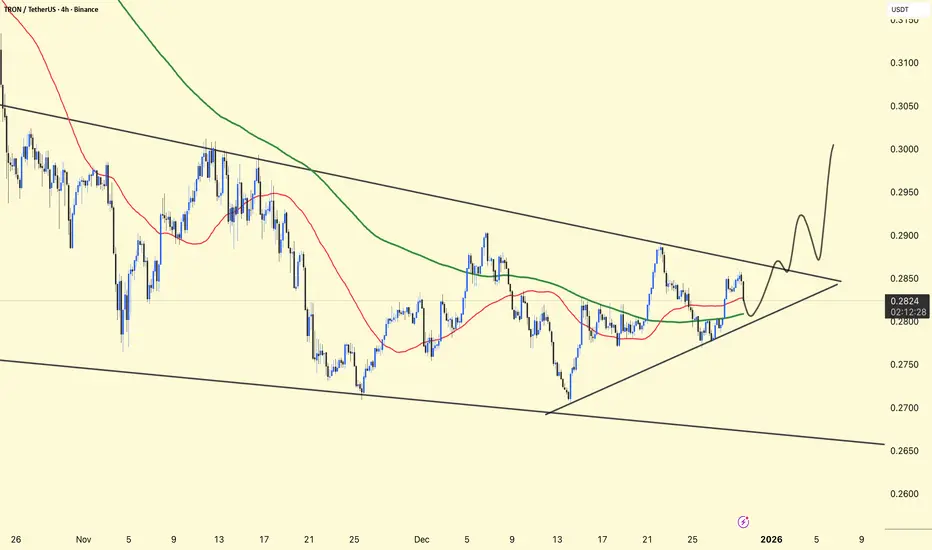
Price is compressing inside a descending broad channel with a short-term ascending triangle forming → volatility squeeze near the apex.
Price is hovering around the 50 MA
Immediate Support: 0.278 – 0.275
Major Support: 0.268 – 0.265
Resistance: 0.285 – 0.288
Breakout Zone: 0.295 – 0.305
Higher lows + flat resistance = pressure building.
A 4H close above 0.288 can trigger a sharp upside expansion (as projected).
Rejection keeps the price ranging inside the structure.
⚠️ Trade only after confirmation.
NFA | Risk management required
Trxusdtechnicalanalysis
TRX/USD Swing Opportunity After Technical Breakout!🚀 TRX/USD - "TRON VS U.S. DOLLAR" | Crypto Swing Trade Blueprint 📈
💎 CURRENT MARKET STATUS (December 30, 2025)
TRX is trading at $0.2818 USD with 24-hour volume of $566.75M and market cap of $26.68B, ranked #8
📊 TRADE SETUP ANALYSIS
Plan: BULLISH momentum confirmed
Simple Moving Average pullback pattern identified
TRX holding higher timeframe supports with accumulation signs on daily chart
Weekly chart shows bullish engulfing pattern suggesting strong buyer momentum
Entry: Market execution at current levels (~$0.2818)
TRX has high correlation with Bitcoin, positioning it for amplified gains during BTC bull runs
Smaller market cap makes percentage expansions more feasible than BTC
Stop Loss: $0.27900
⚠️ Risk Disclosure: Ladies & Gentlemen, this is MY protective stop level. Adjust YOUR stop loss based on YOUR strategy, risk tolerance, and portfolio size. I'm NOT recommending you copy my exact levels - manage your own risk!
Take Profit Target: $0.28900 (Triangular MA resistance zone)
📌 Profit Management Note: This target represents strong resistance + potential oversold bounce correlation. However, YOU decide when to secure profits. This is NOT financial advice - take profits at YOUR comfort level based on YOUR trading plan!
🔗 CORRELATED PAIRS TO WATCH
Direct Pairs:
TRX/BTC - Analyst notes TRX less than 2 days from fresh breakout on monthly vs BTC, with 465 satoshi conservative target
TRX/USDT - Primary trading pair, highest liquidity
TRX/ETH - Cross-correlation play
Market Correlation Analysis:
TRX demonstrates high correlation with Bitcoin measured by Pearson coefficient; tokens with strong BTC correlation tend to amplify gains during bull cycles. Recent market saw $242M liquidations with BTC at $87,000 and TRX at $0.285, showing synchronized movement.
Related Assets to Monitor:
BTC/USD - Lead indicator for TRX direction
ETH/USD - Layer-1 competitor gauge
USDT dominance - TRON surpassed Ethereum in USDT volume, with over $80B USDT on TRON network
📰 FUNDAMENTAL & ECONOMIC FACTORS
Recent Bullish Catalysts:
Network Growth 📊
TRON accounts reached record 355.4M in December 2025, with 240,000 new accounts created daily
Perpetuals volume hit $1.1B on December 23, showing heightened leveraged trading interest
Institutional Integration 🏦
TRON integrated with Base (Coinbase's Layer 2) via LayerZero in December 2025
TRON DAO announced real-world settlement powered by USDT on TRON with RealOpen Crypto on December 26, 2025
Technical Upgrades 🔧
GreatVoyage v4.8.1 mainnet upgrade deployed with improved EVM compatibility
Token-agnostic gas payments launched late 2024, allowing any TRC-20 token for fees
Stablecoin Dominance 💵
TRON leads in USDT/USDD utility with cross-chain liquidity expansion
T3 Financial Crime Unit froze over $300M in criminal assets, strengthening ecosystem trust
Market Sentiment:
Price prediction models suggest 12-18% increase potential, reaching $0.32-$0.34 by December 2025
RSI at 67.87 indicates approaching overbought territory but still accumulation phase
Bearish Risks:
TRX down 16% in Q4 2025, tracking worst quarterly performance despite network growth
Centralization concerns regarding token distribution
Resistance at $0.30 zone with potential liquidity traps
⚡ KEY TAKEAWAYS
✅ Strengths:
Dominant stablecoin infrastructure
Record user growth and network activity
Major institutional integrations (Coinbase/Base)
High Bitcoin correlation for bull-run amplification
⚠️ Watch Out For:
Resistance clusters at $0.30-$0.31
Broader crypto market volatility
BTC price action as lead indicator
💬 Let me know your TRX targets in the comments! Are you bullish or bearish? 🚀📉
🔔 Follow for more crypto swing trade setups and market analysis!

TRX TRON Technical Analysis and Trade Idea I’m currently watching TRX / TRON 👀💎.
We can clearly see bullish price action developing on both the Daily and 4H timeframes 📈🔥, which keeps TRX firmly on my radar for a potential buy setup.
That said, I’m not chasing price — I have specific conditions that need to be met ✅📊:
🔹 Scenario 1 – Pullback Entry
If price pulls back into a previous support zone from current levels 🔄📉, I’ll be looking for a bullish break of structure as confirmation before considering an entry 🚀📌.
🔹 Scenario 2 – Continuation Entry
If price continues higher from here 📈, I’ll want to see TRX create a higher high, followed by a healthy retracement back into the current level, which would then act as new support for a possible buy entry 🧠📍.
As always, patience is key — I let price come to me and confirm the bias 🔒📈
⚠️ Not financial advice. Trade responsibly and manage risk at all times.

TRX 1D LongThe Three Drives Pattern (TDP) reversal formation has formed, and an upward IOF is emerging.
Rebalancing the bullish inefficiency will provide an excellent opportunity to open a long position. 📈

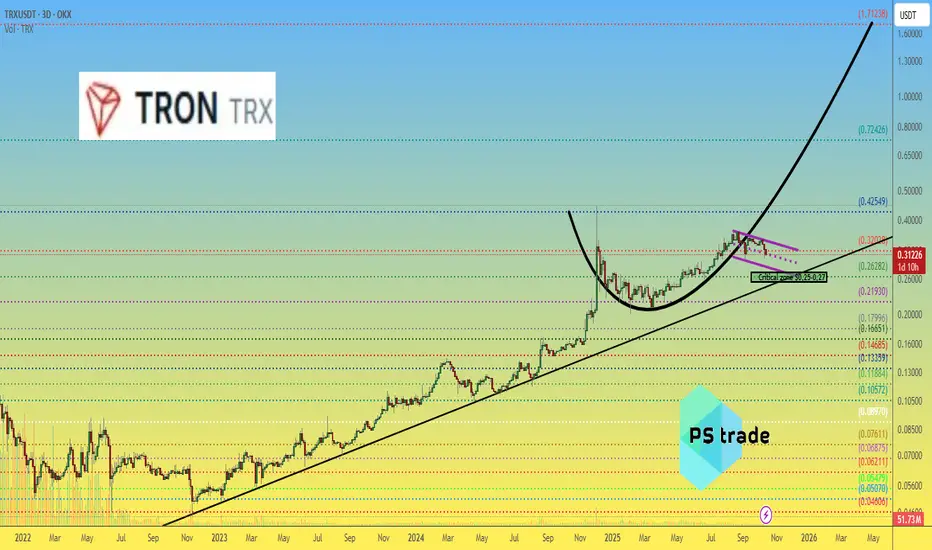
$TRX — The “protected child” of Justin SunOnce again, AMEX:TRX has proven it’s the “favorite child” of its creator, Justin Sun.
Despite the market chaos, OKX:TRXUSDT dropped only ~10%, showing exceptional resilience while many altcoins suffered deep crashes.
The next key support zone is $0.25–0.27, (based on trend line) which previously marked bottoms during the COVID crash (March 2020) and November 2022.
If buyers defend this level, it could act as a strong base for a rebound — possibly up to $1.7.
This structure continues to reflect steady demand and long-term accumulation rather than exit pressure.
💭 Will #Tron repeat its historical bounce from this range, or is the sentiment shifting this time?
______________
◆ Follow us ❤️ for daily crypto insights & updates!
🚀 Don’t miss out on important market moves
🧠 DYOR | This is not financial advice, just thinking out loud
TRX/USD Breakout Watch – Can Bulls Sustain This Move?🔥 TRX/USD — "TRON vs U.S. Dollar" 🚀
Crypto Market Opportunity Blueprint (Swing Trade Edition)
💎 Plan: Bullish
🎯 Entry: Any price level after a confirmed breakout — patience is profit, my friends!
🛑 Stop-Loss: This is the Thief SL @ 0.28500 ⚔️
Dear Ladies & Gentlemen (Thief OG’s), please adjust your SL based on your own strategy & risk tolerance. Trade smart — not just fast!
💰 Target: Aim for 0.31000 — but remember, the police barricade might show up before that! 🏃♂️💨
Escape with profits before they catch you! Not financial advice — your bag, your plan, your escape route.
🧠 Note:
Dear Ladies & Gentlemen (Thief OG’s), these are my personal setups. You’re free to customize entries, exits, and targets to fit your strategy. Always manage your own risk like a pro!
⚡ Trade with discipline. Escape with profits.
#TRXUSD #TRON #CryptoTrading #SwingTrade #ThiefTrader #CryptoBlueprint #BullishSetup #TradePlan

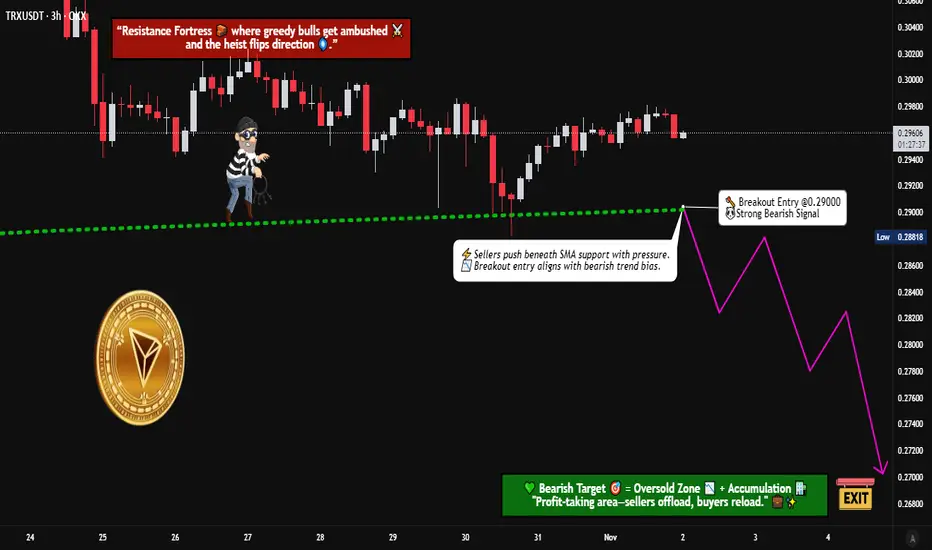
TRON Short Strategy – Breakout Signal or False Alarm?💥 TRX/USDT "TRON vs TETHER" Crypto Market Profit Playbook (Day Trade) 💥
🧭 Idea: Bearish Market Flow Strategy
🔻 Plan Overview
This setup focuses on a bearish momentum play following a moving average breakout confirmation. TRON is showing weakness under key resistance, signaling potential for a short-term downside push.
Entry Zone: After confirmation of a moving average breakout below 0.29000
Stop Loss (SL): Thief’s Protective Stop @ 0.29800
🧠 Note to Dear Ladies & Gentlemen (Thief OGs): I’m not recommending you stick only to my SL — manage your own risk!
Take Profit (TP): Aim for the 0.27000 region — strong support + oversold pressure + potential trap zone.
🧠 Note to Dear Ladies & Gentlemen (Thief OGs): Take your profit your way! Move smart, stay safe, and trade at your own risk.
⚙️ Technical Breakdown
Trend Direction: Bearish bias under moving average structure
Momentum: Bear side gaining control — RSI sliding toward oversold territory
Support/Resistance:
Resistance: 0.29800 – 0.30000 (Breakout failure zone)
Support: 0.27000 (Major liquidity zone)
Confluence Factors:
✅ Price rejection at upper MA band
✅ Lower highs confirmation
✅ Strong correlation with overall crypto market cooldown
📊 Correlated Pairs to Watch
Keep an eye on these to confirm sentiment and volatility sync:
BINANCE:BTCUSDT → Market direction driver; weakness supports TRX bearish momentum
BINANCE:ETHUSDT → Mirror sentiment pattern — if ETH stays weak, TRX likely follows
BINANCE:XRPUSDT → Often moves in tandem with TRX liquidity cycles
BINANCE:BNBUSDT → Tracks overall crypto rotation and investor confidence
These correlations help confirm whether TRX’s move is isolated or market-wide.
🧩 Key Takeaways
Wait for MA breakout confirmation before jumping in 🕵️
Risk management > prediction — protect capital first 💼
Trap zones = opportunity + danger — play it smart ⚡
Don’t chase — let the setup come to you 👑
✨ “If you find value in my analysis, a 👍 and 🚀 boost is much appreciated — it helps me share more setups with the community!”
⚠️ Disclaimer: This is a Thief Style Trading Strategy — crafted for fun and educational sharing. Always do your own research and manage risk responsibly.
#TRX #TRXUSDT #TRON #CryptoTrading #DayTrade #BearishSetup #TechnicalAnalysis #CryptoMarket #TradingView #ThiefTrader #CryptoStrategy #BTC #ETH #XRP #BNB
TRX Breakdown Incoming? This Trendline Retest Could Be the FinalYello Paradisers, could this be the final warning before #TRX breaks down completely? Or is the market setting up for a savage fakeout that will trap late sellers and then rip higher?
💎#TRXUSDT is currently retesting the ascending trendline after pulling back from the supply zone around $0.2820, a level that has consistently acted as strong resistance. Price action remains within a clearly defined ascending channel, with the lower trendline still providing solid technical support; however, momentum is beginning to shift. The MACD is starting to show signs of developing bearish pressure, supporting the likelihood of a potential downside continuation in the short term.
💎If the current retest fails and confirms a rejection from this supply zone, the probability of a move lower increases significantly. In that case, the price could first target the minor support around $0.2720, and if selling pressure continues, we would be eyeing the stronger support zone near $0.2660 as the next key level to watch. On the flip side, a confirmed breakout above $0.2900 would completely invalidate the bearish setup and instead favor a bullish reversal scenario, opening the door for a more aggressive leg up.
💎Right now, the market structure presents a clean and high-probability short setup. The risk is clearly defined above the $0.2820 supply zone, and if the rejection confirms, the setup offers a very favorable risk-to-reward ratio for disciplined traders.
Trade smart, Paradisers. The market is never generous for long, and only those who combine strategy with discipline will reach the winner’s circle.
MyCryptoParadise
iFeel the success🌴

TRX/USDT — Long-Term Trendline Test: Bounce or Breakdown?TRX has maintained a multi-year higher-high, higher-low structure, making it one of the most stable altcoins in a volatile market cycle. But now, price is sitting directly above the primary ascending trendline — the same trendline that has supported TRX’s entire bullish expansion since early 2023.
This weekly zone is a major decision point:
Will TRX extend its long-term bullish structure, or will it break down and enter a deeper correction phase if the trendline and the $0.212 support fail?
---
The long-term uptrend remains intact as long as the trendline holds.
The price is currently retesting the trendline — a zone that historically triggers strong reactions (powerful bounce or sharp breakdown).
The horizontal level at $0.212 acts as the critical structural support.
Current movement looks like a healthy pullback, not a full reversal (unless the trendline breaks).
---
📈 Bullish Scenario — “The Continuation Rally”
If TRX successfully holds the trendline and forms a bullish reaction, the next leg of the uptrend may begin.
Bullish Confirmation Signals:
Strong weekly close above the trendline
Bullish reversal candle (pin bar, hammer, or engulfing)
Increase in buy volume during the trendline retest
Bullish Targets:
1. $0.32 – $0.35 → first resistance zone
2. $0.45 → major 2025 peak
3. Break above $0.45 → potential long-term price discovery
Bullish Narrative:
“As long as the trendline holds, this is not a correction — it’s a refueling phase before the next rally.”
---
📉 Bearish Scenario — “Trendline Breakdown Phase”
If TRX loses the trendline on a weekly close, the long-standing bullish structure may break for the first time since 2023.
Bearish Confirmation Signals:
Weekly close below the trendline
Retest of the trendline turning into resistance
Weekly close below $0.212 → full structure breakdown
Bearish Targets:
Deeper correction into the next major demand zones
Larger volatility due to long positions liquidating below the trendline
Bearish Narrative:
“A trendline breakdown is not a pullback — it signals a structural reversal.”
---
📌 Pattern Summary
Primary Pattern: Long-term rising trendline
Current Phase: Controlled weekly pullback
Possible Outcomes:
Bull Flag continuation (if price bounces)
Trendline Breakdown (if price closes below support)
---
🎯 Final Conclusion
TRX is positioned at a critical structural level where the market will decide between a continuation of the multi-year uptrend or a macro correction phase.
The next few weekly candles will be decisive.
---
#TRX #TRXUSDT #CryptoAnalysis #TechnicalAnalysis #Trendline #WeeklyChart #Altcoins #BullishScenario #BearishScenario

TRON: an inverse Head and Shoulders Hi!
Trend Overview:
The chart shows a prolonged downtrend, highlighted by the steady descending trendline. Price has been making lower highs and lower lows, consistent with a bearish market structure.
Trendline Break:
Recently, a shorter-term descending trendline was broken to the upside, signaling potential bullish pressure and a shift in momentum.
Pattern Formation:
A classic inverse head and shoulders pattern has formed:
Left Shoulder: 0.2900 level
Head: 0.2765 level
Right Shoulder: ~0.2920 level
This pattern suggests a potential reversal from the prior downtrend to an upward move.
Target Zone:
The target of the head and shoulders pattern is marked around 0.3140–0.3180, representing the measured move from the head to the neckline. This is a key resistance zone where sellers might appear.

Tron/TRX on the Verge of a DropThe first expected level is the blue one, where breaking it makes the orange zones and the green trend line important, with a higher likelihood of reaction on the trend line. During the reaction for an upward move, if it hits the purple zone and lacks the strength to break it, there's a chance of continued decline. And when the price crosses the yellow zone, it signals that the uptrend is beginning. BINANCE:TRXUSDT

TRXUSDT The chart BINANCE:TRXUSDT was deep spike but this is exit seller from game and entry again byers. We can buy in supports (0.3330 to 0.3450) but for hold in.
Please control risk management for your trades.

TRX/USDT Breakout Robbery – High Voltage Bullish Target Ahead🔥 TRX/USDT “TRON vs Tether” — Bullish Heist Operation 🔥
💎 Attention Money Makers & Market Robbers 💎
The vault is open and the TRX/USDT crypto bank is loaded! We’re rolling in with the Thief Trader Layering Strategy — stacking multiple buy limit orders like C4 charges on key price floors. This isn’t just trading… this is a high-voltage robbery plan ⚡🏴☠️
📈 Entry Plan (Infiltration):
No fancy timing here — any price level is a potential entry zone. We’ll be scaling in with precision to bait the market makers and ride the bullish tide.
🛑 Stop Loss (Escape Route):
0.3300 — the ultimate safe exit door. Breach that, and we vanish into the shadows before the cops (market reversal) arrive 🚔💨
🎯 Target (The Loot):
0.3610 — High Voltage Electric Resistance ⚡ + Overbought Fence Level 🚧. This is where the market will be too hot for the bears to touch.
💡 Tactical Notes:
We’re hunting in the bullish zone — only go long.
Stack positions smartly to trap weak hands and squeeze shorts.
The closer we get to target, the more the tension rises — exit like a ghost if volatility explodes.
📢 Trader Alert:
The market is charged with momentum ⚡. Keep your alerts active, and be ready to hit the green button before the crowd catches on.
❤️ Support the Crew:
Smash that Boost so the robbery squad gets stronger. Every click fuels more heists, more wins, and more profits 🤑💼💣
TRX/USDT Bullish Robbery Plan — We enter quiet, exit loud, and leave the market in smoke 💨🚀

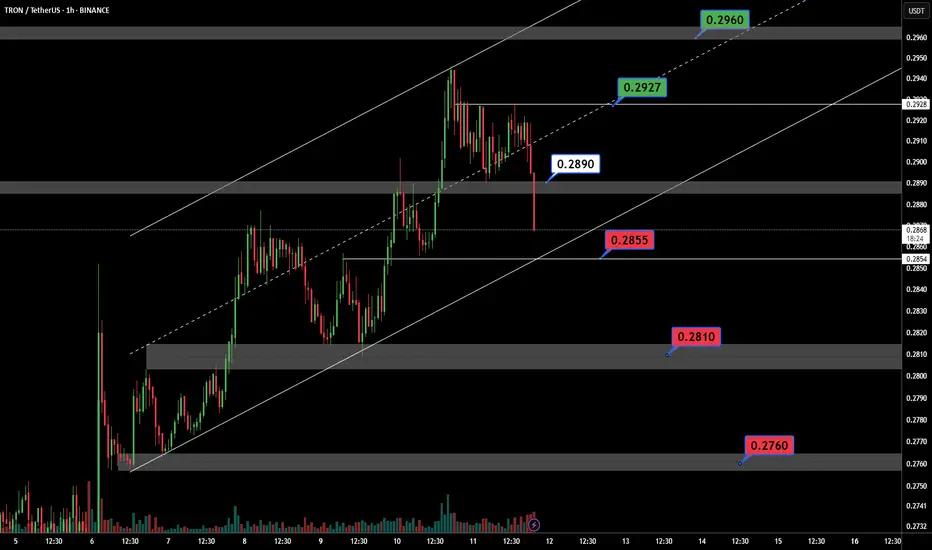
TRXUSDT In the 1-hour timeframe BINANCE:TRXUSDT , it shows an overall upward trend that has recently experienced a price drop near the 0.2855 level but remains within the main upward channel. If the price stays above 0.2890, there is a likelihood of the upward trend continuing toward 0.2960.
Key Support and Resistance Levels:
Support: 0.2760, 0.2810, 0.2855
Resistance: 0.2890, 0.2927, 0.2960
⚠️Contorl Risk management for trades.
The Hidden TRX Buying Pressure Most Traders Are MissingI didn't draw the blue box below now, it's from my previous analysis,
I told you to wait and those who waited should be pretty happy right now TRX is still generally bullish and this is our current blue box and our assessment is as follows:
Contrary to the general market sentiment you might be seeing, my analysis of TRX is leaning positive.
What's caught my eye is the clear presence of buyers stepping in. This isn't just a fleeting moment of interest; the strength I'm observing suggests these buyers have the conviction and capital to genuinely drive the price upwards.
As always, I'm not just making a blind call. I'm seeing this strength reflected in the volume footprint, indicating genuine accumulation. The CDV (Cumulative Delta Volume) is also showing a positive divergence, supporting the idea of increasing buying pressure.
Now, while the overall market might be showing different signals, the concentrated buying activity in TRX is compelling. I'll be watching for low timeframe (LTF) confirmations of this strength continuing. If we see sustained buying volume and positive price action on the lower timeframes, this bullish outlook will be further validated.
It's important to remember that I focus on coins showing sudden and significant increases in volume, and TRX is currently exhibiting this. This concentrated interest from buyers suggests a potential for significant price movement, regardless of broader market headwinds.
Keep TRX on your radar. Sometimes, the real opportunities lie where the focused strength of buyers can overcome general market noise. You know I only bring you what I see as high-potential setups. Let's see if TRX can prove the broader market wrong.
📌I keep my charts clean and simple because I believe clarity leads to better decisions.
📌My approach is built on years of experience and a solid track record. I don’t claim to know it all but I’m confident in my ability to spot high-probability setups.
📌If you would like to learn how to use the heatmap, cumulative volume delta and volume footprint techniques that I use below to determine very accurate demand regions, you can send me a private message. I help anyone who wants it completely free of charge.
🔑I have a long list of my proven technique below:
🎯 ZENUSDT.P: Patience & Profitability | %230 Reaction from the Sniper Entry
🐶 DOGEUSDT.P: Next Move
🎨 RENDERUSDT.P: Opportunity of the Month
💎 ETHUSDT.P: Where to Retrace
🟢 BNBUSDT.P: Potential Surge
📊 BTC Dominance: Reaction Zone
🌊 WAVESUSDT.P: Demand Zone Potential
🟣 UNIUSDT.P: Long-Term Trade
🔵 XRPUSDT.P: Entry Zones
🔗 LINKUSDT.P: Follow The River
📈 BTCUSDT.P: Two Key Demand Zones
🟩 POLUSDT: Bullish Momentum
🌟 PENDLEUSDT.P: Where Opportunity Meets Precision
🔥 BTCUSDT.P: Liquidation of Highly Leveraged Longs
🌊 SOLUSDT.P: SOL's Dip - Your Opportunity
🐸 1000PEPEUSDT.P: Prime Bounce Zone Unlocked
🚀 ETHUSDT.P: Set to Explode - Don't Miss This Game Changer
🤖 IQUSDT: Smart Plan
⚡️ PONDUSDT: A Trade Not Taken Is Better Than a Losing One
💼 STMXUSDT: 2 Buying Areas
🐢 TURBOUSDT: Buy Zones and Buyer Presence
🌍 ICPUSDT.P: Massive Upside Potential | Check the Trade Update For Seeing Results
🟠 IDEXUSDT: Spot Buy Area | %26 Profit if You Trade with MSB
📌 USUALUSDT: Buyers Are Active + %70 Profit in Total
🌟 FORTHUSDT: Sniper Entry +%26 Reaction
🐳 QKCUSDT: Sniper Entry +%57 Reaction
📊 BTC.D: Retest of Key Area Highly Likely
📊 XNOUSDT %80 Reaction with a Simple Blue Box!
📊 BELUSDT Amazing %120 Reaction!
📊 Simple Red Box, Extraordinary Results
📊 TIAUSDT | Still No Buyers—Maintaining a Bearish Outlook
📊 OGNUSDT | One of Today’s Highest Volume Gainers – +32.44%
I stopped adding to the list because it's kinda tiring to add 5-10 charts in every move but you can check my profile and see that it goes on..

TRX/USDT Trade Setup & Why This Fibonacci Level Matters🚨 TRX/USDT Trade Breakdown 🔍💹
Taking a close look at TRX/USDT (Tron) — the chart is showing a strong, sustained bullish trend on the 4H timeframe 📈🔥.
At the moment, I’m waiting for a pullback into equilibrium ⚖️. If we apply a Fibonacci retracement from the current swing low to the recent high, the 50% level stands out as a key area of interest for a potential entry 🎯.
🧠 This zone offers a high-probability area to look for trend continuation, provided price respects it and holds structure. My Fibonacci tool also outlines projected targets, and I walk you through everything in the video 📽️🗺️.
📌 This is NOT financial advice — just my personal analysis and approach. Always do your own research and manage your risk accordingly. ⚠️
👇 Let me know your thoughts in the comments and don’t forget to like & subscribe for more setups!
TRX/USDT Trade Setup & Why This Fibonacci Level Matters

TRXUSDTTRX Price Analysis – Key Levels to Watch
🔍 Current Price Action:
TRX is currently trading within a tight range, with key resistance at 0.2431 and support at 0.2275. The recent close near 0.2418 indicates a strong battle near the upper resistance zone. A confirmed breakout above 0.2431 could pave the way for bullish continuation. However, failure to break through may trigger a pullback toward 0.2340 or even retest the 0.2275 support level.
📉 Trend Outlook & Next Moves:
A breakout above resistance may drive TRX toward higher price targets with strong bullish momentum.
Conversely, a breakdown below support could indicate a deeper correction ahead.
👉 Keep an eye on price reactions at these critical levels for confirmation of the next trend direction.

TRXUSDT TRXUSDT Price Action Analysis (1H Timeframe)
🔹 Overall Trend: After a strong rally, the price is in a correction phase, currently trading at 0.2291. The key resistance at 0.2300 must be broken for a bullish continuation.
🔹 Bullish Scenario:
A breakout above 0.2300 with confirmation could push the price towards 0.2345 and 0.2435.
If this happens, the bearish structure will be invalidated, increasing bullish momentum.
🔹 Bearish Scenario:
Failure to break 0.2300 may lead to a pullback towards 0.2250 and 0.2205.
Losing 0.2205 could open the way for a deeper drop to 0.2160, a critical support zone.
🎯 Conclusion: Watch key levels closely; a confirmed breakout above 0.2300 signals a buy opportunity, while losing 0.2250 strengthens the bearish outlook.

Liquidity Grab Ahead? Why TRX (Tron) May Retrace Soon TRX (Tron) is currently trading near a significant resistance zone, aligning with the upper boundary of a descending channel on the 4-hour timeframe 📉. This area is likely to hold liquidity in the form of buy stops resting above the previous range highs. Given the broader downtrend and the strong resistance overhead, the price may retrace as it taps into this liquidity pool.
This setup presents a compelling short opportunity, with the expectation that TRX will reject this level and move lower, targeting support zones below. Traders should remain cautious and monitor price action closely for confirmation before entering a position ⚠️.
Disclaimer: This analysis is for informational purposes only and does not constitute financial advice. Cryptocurrency trading involves significant risk, and you should consult with a financial advisor before making any investment decisions. Always trade responsibly! 🚨

TRXUSDT 1D LONG [UPdate]In line with the expectations I outlined in my main TRXUSDT 1D LONG review the price interacted perfectly with the key liquidity block and turned around confidently.
To feel safe in this position, I move the stop order to breakeven and continue to wait for my targets to be reached!
Targets:
$0.2509
$0.2580
$0.2679
$0.2815

TRX/USD "Tron vs US Dollar" Crypto Market Heist Plan🌟Hi! Hola! Ola! Bonjour! Hallo!🌟
Dear Money Makers & Thieves, 🤑 💰🐱👤🐱🏍
Based on 🔥Thief Trading style technical and fundamental analysis🔥, here is our master plan to heist the TRX/USD "Tron vs US Dollar" Crypto Market. Please adhere to the strategy I've outlined in the chart, which emphasizes long entry. Our aim is the high-risk Red Zone. Risky level, overbought market, consolidation, trend reversal, trap at the level where traders and bearish robbers are stronger. 🏆💸Book Profits, Be wealthy and safe trade.💪🏆🎉
Entry 📈 : "The heist is on! Wait for the MA breakout (0.25000) then make your move - Bullish profits await!"
however I advise to placing the Buy Stop Orders above the breakout MA or placing the Buy limit orders within a 15 or 30 minute timeframe. Entry from the most recent or closest low or high level should be in retest.
Stop Loss 🛑: Thief SL placed at 0.22800 (swing Trade Basis) Using the 4H period, the recent / Swing Low or High level.
SL is based on your risk of the trade, lot size and how many multiple orders you have to take.
Target 🎯: 0.30000 (or) Escape Before the Target
🧲Scalpers, take note 👀 : only scalp on the Long side. If you have a lot of money, you can go straight away; if not, you can join swing traders and carry out the robbery plan. Use trailing SL to safeguard your money 💰.
📰🗞️Fundamental, Macro, COT, Sentimental Outlook:
TRX/USD "Tron vs US Dollar" Crypto Market is currently experiencing a bullish trend,., driven by several key factors.
⭐Market Overview
Current Price: 0.24000
Daily Change: 3.5%
Weekly Change: 12.1%
⭐Fundamental Analysis
Tron Adoption: Growing adoption of Tron's blockchain technology, with increasing partnerships with major companies and organizations
DApp Ecosystem: Tron's DApp ecosystem is growing rapidly, with new DApps being launched regularly
Regulatory Environment: The regulatory environment for TRX is still uncertain, which could impact its price
⭐Macro Economics
Global Economic Trends: The ongoing global economic recovery is expected to drive up demand for cryptocurrencies, including TRX
Inflation Rate: Global inflation is expected to rise to 3.8% in 2025, potentially increasing demand for cryptocurrencies as a hedge against inflation
Interest Rates: Central banks are expected to maintain low interest rates in 2025, supporting cryptocurrency markets
⭐COT Data
Net Long Positions: Institutional traders have increased their net long positions in TRX to 58%
COT Ratio: The COT ratio has risen to 2.3, indicating a bullish trend
Open Interest: Open interest in TRX futures has increased by 18% over the past month, indicating growing investor interest
⭐Sentimental Outlook
Institutional Sentiment: 62% bullish, 38% bearish
Retail Sentiment: 58% bullish, 42% bearish
Market Mood: The overall market mood is bullish, with a sentiment score of +35
⭐Technical Analysis
Moving Averages: 50-period SMA: 0.22000, 200-period SMA: 0.20000.
Relative Strength Index (RSI): 4-hour chart: 64.21, daily chart: 60.14.
Bollinger Bands: 4-hour chart: 0.24000 (upper band), 0.22000 (lower band).
⭐Next Move Prediction
Bullish Move: Potential upside to 0.28000-0.30000.
Target: 0.28000 (primary target), 0.30000 (secondary target)
Stop Loss: 0.20000 (below the swing low)
Risk-Reward Ratio: 1:2 (potential profit of 0.06000 vs potential loss of 0.03000)
⭐Overall Outlook
The overall outlook for TRX/USD is bullish, driven by a combination of fundamental, technical, and sentimental factors. The expected increase in Tron adoption, growing DApp ecosystem, and bullish market sentiment are all supporting the bullish trend. However, investors should remain cautious of potential downside risks, including changes in global economic trends and unexpected regulatory developments.
⚠️Trading Alert : News Releases and Position Management 📰 🗞️ 🚫🚏
As a reminder, news releases can have a significant impact on market prices and volatility. To minimize potential losses and protect your running positions,
we recommend the following:
Avoid taking new trades during news releases
Use trailing stop-loss orders to protect your running positions and lock in profits
📌Please note that this is a general analysis and not personalized investment advice. It's essential to consider your own risk tolerance and market analysis before making any investment decisions.
📌Keep in mind that these factors can change rapidly, and it's essential to stay up-to-date with market developments and adjust your analysis accordingly.
💖Supporting our robbery plan will enable us to effortlessly make and steal money 💰💵 Tell your friends, Colleagues and family to follow, like, and share. Boost the strength of our robbery team. Every day in this market make money with ease by using the Thief Trading Style.🏆💪🤝❤️🎉🚀
I'll see you soon with another heist plan, so stay tuned 🤑🐱👤🤗🤩

Fresh Demand Zones Hold the Key - Don't Get Caught in the Hype! TRXUSDT: Fresh Demand Zones Hold the Key - Don't Get Caught in the Hype! 🔑📉
Key Insights:
Ignore the Big Rally: Using the recent major upswing for analysis may not yield actionable insights.
Fresh Demand Matters: Focusing on the first untested fresh demand zone gives a stronger foundation for entries.
Low Time Frame Strategy: When price reaches these zones, shift to lower time frames and look for upward market structure breaks. This approach leads to better risk-to-reward ratios and higher success rates.
Why This Works?
Fresh zones often attract institutional interest, making them ideal for precision entries. By combining these zones with lower time frame analysis, you minimize risk and maximize reward.
Pro Tip: Don’t let emotions take over during large price moves—stick to the plan, and let the chart guide you.
Enjoyed this insight? Boost, comment, and follow for more strategies to dominate the charts! 🚀
Let me tell you, folks, this is amazing. Nobody does analysis like I do. Believe me. If this helps you, don't forget to boost and comment! It’s a big deal, motivates me to share even more winning insights with you. Tremendous insights.
I keep my charts the best, clean, simple, and clear. You know it, I know it, clarity leads to better decisions. No question about it. My approach? Built on years of tremendous experience. Incredible track record. I don’t claim to know it all, but I spot high-probability setups like nobody else. Trust me.
Want to learn how to use the heatmap, cumulative volume delta, and volume footprint techniques I use to determine demand regions with stunning accuracy? Send me a private message—totally free, folks. That’s right. I help anyone who wants it, absolutely no charge. Unbelievable value.
Here’s the list, long list, great list, of some of my previous incredible analyses. Each one, a winner:
🎯 ZENUSDT.P: Patience & Profitability | %230 Reaction from the Sniper Entry
🐶 DOGEUSDT.P: Next Move
🎨 RENDERUSDT.P: Opportunity of the Month
💎 ETHUSDT.P: Where to Retrace
🟢 BNBUSDT.P: Potential Surge
📊 BTC Dominance: Reaction Zone
🌊 WAVESUSDT.P: Demand Zone Potential
🟣 UNIUSDT.P: Long-Term Trade
🔵 XRPUSDT.P: Entry Zones
🔗 LINKUSDT.P: Follow The River
📈 BTCUSDT.P: Two Key Demand Zones
🟩 POLUSDT: Bullish Momentum
🌟 PENDLEUSDT.P: Where Opportunity Meets Precision
🔥 BTCUSDT.P: Liquidation of Highly Leveraged Longs
🌊 SOLUSDT.P: SOL's Dip - Your Opportunity
🐸 1000PEPEUSDT.P: Prime Bounce Zone Unlocked
🚀 ETHUSDT.P: Set to Explode - Don't Miss This Game Changer
🤖 IQUSDT: Smart Plan
⚡️ PONDUSDT: A Trade Not Taken Is Better Than a Losing One
💼 STMXUSDT: 2 Buying Areas
🐢 TURBOUSDT: Buy Zones and Buyer Presence
🌍 ICPUSDT.P: Massive Upside Potential | Check the Trade Update For Seeing Results
🟠 IDEXUSDT: Spot Buy Area | %26 Profit if You Trade with MSB
📌 USUALUSDT: Buyers Are Active + %70 Profit in Total
🌟 FORTHUSDT: Sniper Entry +%26 Reaction
🐳 QKCUSDT: Sniper Entry +%57 Reaction
📊 BTC.D: Retest of Key Area Highly Likely
And that’s just the start. The list goes on and on, folks. It’s a tremendous list, the best. I stopped adding because, frankly, it’s tiring. So many wins. People are amazed. You can check my profile and see for yourself, winning moves, all the time. Believe me, nobody does it better.

Market Outlook: Positive Trends in TRX/USDT Suggest Bullish!Hello Traders,
Just Breaked The Resistance Zone And Taking Support And There is A Potiential Chance To Go Upside!
We have one Resistance Zone, and 2 Supply Zones. The Price Breaked The Resistance Zone, And Becames The Support Zone, Take Entry While Retesting OR Pullback of The Move.
Please Note That The Only Purpose of The Information On This Page is Purely Educational.
I Would Welcome Your Participation And Support in the Form of Likes, Comments, And Follow us to Offer Some Encouragement.
Thank You.
