TSLA $375 Call –Momentum + Options Flow Edge!
⚡ **TSLA 1‑Day Earnings/Weekly Scalp!**
📅 **Expiry:** 2025-09-12
🎯 **Strike:** \$375 CALL
💵 **Entry:** \$1.38 (Ask)
🛑 **Stop Loss:** \$0.69 → strict 50%
📈 **Profit Target:** \$2.07 (\~+50%)
📊 **Confidence:** 70% (Moderate Bullish)
⏰ **Entry Timing:** Market Open
💎 **Why This Trade:**
* Multi-timeframe momentum bullish (daily RSI 70.4, weekly RSI 67.8)
* Institutional call flow C/P = 1.57 → strong directional skew
* Low VIX (14.9) supports call buying
* Balanced strike with high liquidity (OI 16,237)
* Quick scalp: exit by Thursday close — avoid Friday gamma crush
⚠️ **Key Risks:**
* 1 DTE → extreme gamma & theta decay
* Underlying volume moderate → pullbacks possible
* News can reverse the move rapidly
* Use **small position sizing** (1–3% max risk)
💡 **Execution Tips:**
* Use limit at ask (\$1.38) or slightly better for control
* Hard stop at \$0.69
* Scale out at \$2.07 or partial at \$1.80
* Monitor intraday VWAP & price action; abort if momentum stalls
🎯 **Quick Take:** Cheap, high-conviction 1-day scalp with defined risk & asymmetric upside. Fast in, fast out, gamma-aware trade.
Tslachart

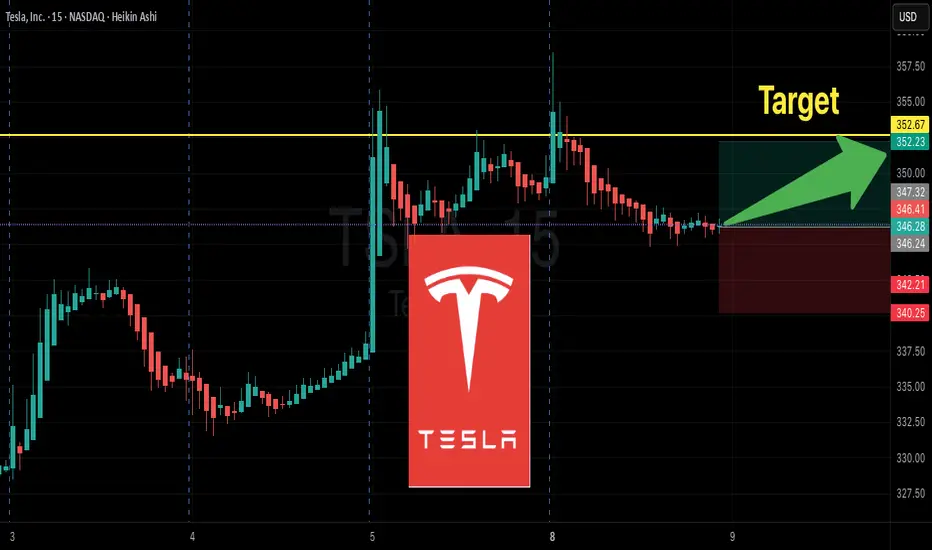
TSLA $352.50 Call—Capture Momentum Before Thursday!Here’s a **TradingView-friendly, viral-ready summary** for your TSLA weekly trade with punchy readability and attractive titles:
---
⚡ **TSLA Weekly Options Alert — Tactical Short-Duration Play**
**Directional View:** **Moderate Bullish** 💹
**Confidence:** 65%
**Trade Setup:**
* **Instrument:** TSLA
* **Strategy:** BUY CALL (single-leg)
* **Strike:** \$352.50
* **Expiry:** 2025-09-12 (4 DTE)
* **Entry Price:** \$5.00
* **Entry Timing:** Market Open
* **Size:** 1 contract
**Targets & Risk:**
* **Profit Target:** \$8.00 (\~60%+ gain)
* **Stop Loss:** \$2.50 (\~50% loss)
* **Max Hold:** No later than Thursday close (avoid Friday gamma/theta)
**Why This Trade?**
✅ Options Flow: Call/Put skew 1.35 → institutional call concentration \$350–\$355
✅ Daily Momentum: RSI 58.5 rising → near-term bullish signal
✅ Volatility: Low VIX (\~15–16) → cheaper premium, supportive environment
✅ Strike & Liquidity: \$352.50 slightly OTM with strong OI (5,781)
**Key Risks:**
⚠️ Weak weekly volume (0.9x) → institutional confirmation limited
⚠️ Short DTE → high theta/gamma; strict stop mandatory
⚠️ Negative news/catalyst risk → potential gap or intraday pullback
⚠️ Bid/ask spreads → manage fills carefully
**Quick Takeaway:**
* Tactical, short-duration directional trade leveraging **options flow + daily momentum**
* Strict risk management: **50% stop + exit by Thursday**
* Not high-conviction (>75%) — suitable for **speculative, nimble traders**
**Alternate Strikes / Ideas:**
* None provided — \$352.50 balances premium and upside potential for this 4-DTE window
---
📊 **TRADE DETAILS (JSON for precision)**
```json
{
"instrument": "TSLA",
"direction": "call",
"strike": 352.5,
"expiry": "2025-09-12",
"confidence": 0.65,
"profit_target": 8.00,
"stop_loss": 2.50,
"size": 1,
"entry_price": 5.00,
"entry_timing": "open",
"signal_publish_time": "2025-09-08 11:49:21 UTC-04:00"
}
```
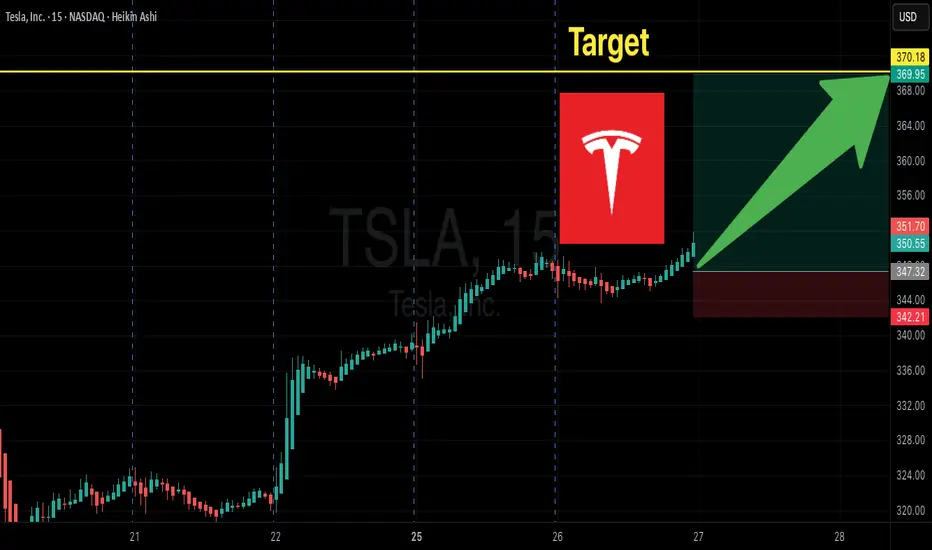
Tesla Options Flow Signals BIG Upside! $370C Momentum Trade
# 🚀 TSLA Weekly Options Setup | 370C Targeting 100%+ 📈
### 🔑 Key Highlights
* **Momentum:** RSI rising on both Daily (63.5) & Weekly (68.4) ✅
* **Options Flow:** Strong bullish skew (C/P = 1.79) 🟢
* **Volume:** Weak overall (0.9x), but institutional spike into close ⚡
* **Volatility:** VIX low → favorable for directional calls 😎
---
### 📊 Trade Setup (Consensus Pick)
* 🎯 **Instrument:** TSLA Weekly Call
* 💵 **Strike:** \$370C
* 📅 **Expiry:** 2025-08-29
* 💰 **Entry:** \$0.98 (ask) — open
* 🛑 **Stop:** \$0.49 (-50%)
* 🎯 **Target:** \$1.96 (+100%)
* ⏳ **Max Hold:** Close by **Thursday EOD** to avoid Friday theta/gamma crush
---
### 📌 Why \$370C?
* Best **liquidity** (OI \~18,450, vol 20k) → tightest fills ✅
* Balanced **delta & leverage** for short-term momentum 🎯
* Aligns with most model recommendations 📊
---
### ⚠️ Risks to Watch
* 🔻 **Theta decay** accelerates mid-week → avoid holding to Friday
* 🔻 **Gap risk** at open — manage entries with limit orders
* 🔻 **Market reversal** can kill momentum fast
---
## ✅ Final Verdict: **Strong Weekly Bullish Bias**
TSLA looks primed for an upside push — \$370C is the sweet spot for this week’s expiry.
---
### 🔥 Hashtags
\#TSLA #OptionsTrading #WeeklyOptions #StocksToWatch #MomentumTrading #TradingSignals #CallOptions #BullishSetup #TeslaStock
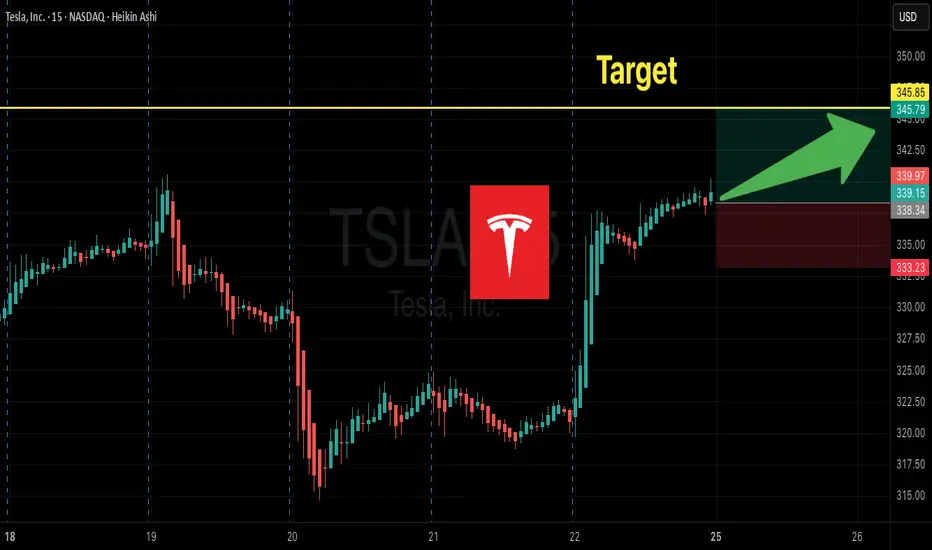
TSLA Weekly Options Setup:345C--Don’t Miss Out
# 🚀 TSLA Weekly Options Setup: Bullish Momentum Play w/ \$345C 🎯 (Aug 29 Expiry)
### 🔑 Multi-Model Summary
✅ RSI (Daily 60.1 → Weekly 65) = Bullish momentum
✅ VIX \~14.2 = Favorable volatility regime
⚠️ Weak weekly volume (0.9x) + neutral options flow (C/P \~1.10)
⚖️ Mixed models → Some lean bullish (\$345–355C), others prefer **no trade** due to weak institutional flow
---
### 📊 Recommended Trade (If You Take It)
* 🎯 **Instrument**: \ NASDAQ:TSLA
* 📈 **Direction**: Call (Long)
* 🎯 **Strike**: \$345C
* 💵 **Entry**: \~\$6.00 (limit at open)
* 🛑 **Stop**: \$3.60 (40% risk control)
* 🎯 **Target**: \$9.00 (+50%)
* 📅 **Expiry**: 2025-08-29
* 📏 **Size**: 1 contract (scalable)
* ⚡ **Exit**: By **Thursday close** (avoid Friday gamma decay)
* 🔒 **Confidence**: 65% (moderate conviction)
---
### ⚠️ Key Risks
* Weak volume = no big-money confirmation
* Event risk (SpaceX headlines)
* 5 DTE = aggressive theta decay
* Gamma swings → fast intraday moves
---
### 📌 Conclusion
Momentum favors upside, but lack of strong institutional confirmation = **medium conviction**.
👉 Conservative traders: wait.
👉 Active traders: \$345C is the best balance of **delta, liquidity, and leverage** this week.
---
### 🔥 Hashtags
\#TSLA #OptionsTrading #WeeklyOptions #CallOptions #SwingTrade #DayTrading #MomentumTrading #OptionsFlow #BreakoutTrading #StockMarket 🚀📈💎🔥
TSLA $365 Calls Heating Up – Big Move Ahead, Don’t Miss Out! 🚀 TSLA Weekly Options Analysis (2025-08-17) – Don’t Miss Out!
### 🔎 Model Insights Recap
**Grok/xAI Report**
* 📊 Signals: Bullish RSI + Options Flow + Volatility
* 🔊 Volume: Weak → ⚠️ caution
* 🛑 Decision: **No trade** (mixed confirmations)
**Gemini/Google Report**
* 📊 RSI: Rising (Weekly 63.7 = bullish momentum)
* 📈 Call/Put Ratio: **1.58** → institutional bullish bias
* ✅ Decision: **Buy \$365 Call** (Moderate Bullish)
**Claude/Anthropic Report**
* 📊 Weekly trend & call flow strong
* 🔊 Volume weak = confidence tempered
* ✅ Decision: **Buy \$340 Call** w/ strict risk mgmt
**Llama/Meta Report**
* 📊 Weekly momentum bullish, daily RSI neutral
* 📈 Options Flow: Positive
* 🔊 Volume: Weak
* ✅ Decision: **Buy \$352.50 Call**, targeting moderate gains
---
### 📌 Agreement
✔️ All models = **Moderate Bullish** bias (weekly RSI strength + options flow)
✔️ Key driver = **institutional positioning** & favorable volatility
### 📌 Disagreement
⚖️ Grok → **No trade** (volume too weak)
⚖️ Gemini/Claude/Llama → **Bullish calls** w/ different strikes & risk levels
---
## 📊 Recommended Trade Setup
* **Direction:** CALL (Long)
* **Strike:** \$365
* **Expiry:** 2025-08-22
* **Entry Price:** \$0.65 (limit order)
* **Stop Loss:** \$0.32 (50% premium)
* **Profit Target:** \$1.30 (100% return)
* **Strategy:** Single-leg naked calls
* **Entry Timing:** Market Open
* **Confidence:** 65%
---
### ⚠️ Key Risks
* Weak **volume** = 🚫 risk of failed breakout
* Must monitor **follow-through** carefully → momentum may stall without institutional push
---
## 📌 Final Outlook
**TSLA = Moderate Bullish Bias** ✅
Institutional call flow supports upside, but weak volume = proceed with **tight risk management**.
---
📊 **TRADE DETAILS JSON**
```json
{
"instrument": "TSLA",
"direction": "call",
"strike": 365.0,
"expiry": "2025-08-22",
"confidence": 0.65,
"profit_target": 1.30,
"stop_loss": 0.32,
"size": 1,
"entry_price": 0.65,
"entry_timing": "open",
"signal_publish_time": "2025-08-17 09:22:38 EDT"
}
```

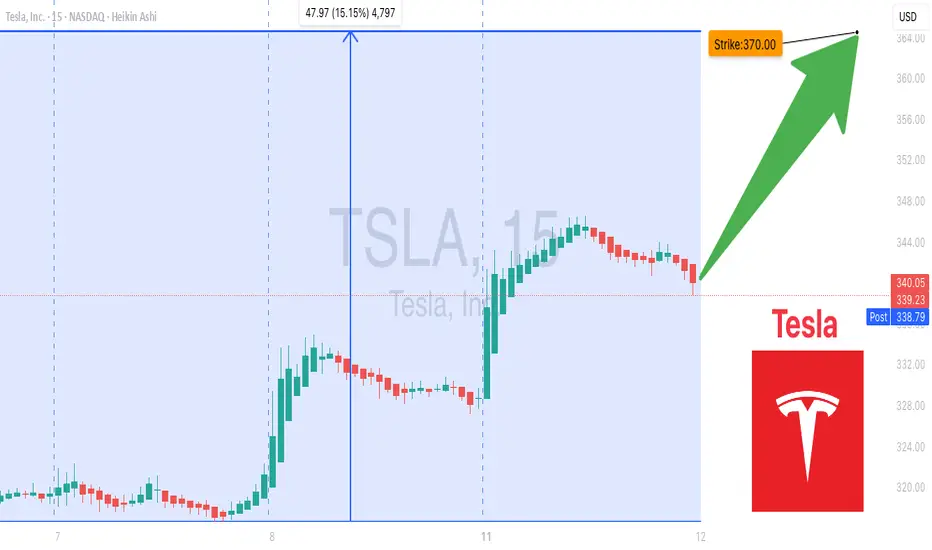
TSLA Momentum Unstoppable To $370— Don’t Miss Out! 🚀 TSLA Weekly Options Analysis — Bullish Momentum Confirmed! (2025-08-11) 🚀
### 🔥 Key Highlights:
* **RSI Signals Bullish:** Daily RSI at **59.5**, Weekly RSI at **54.9** — momentum is building strong!
* **Massive Weekly Gain:** +13.62% this week, breaking past key moving averages & resistance levels.
* **Options Flow:** Call/Put ratio at **1.77** — traders and institutions betting big on upside!
* **Volatility:** VIX low at **15.8** — ideal environment for bullish directional trades.
* **⚠️ Volume Caution:** Weekly volume at **0.8x** last week — watch closely for institutional commitment shifts.
---
### 📈 Consensus:
Most models say: **BULLISH** ✅
* Momentum + Options Flow + Low Volatility = Perfect setup
* Volume dip is a caution flag but not a dealbreaker (yet).
---
### 🎯 Trade Setup: Buy Calls on TSLA
| Parameter | Details |
| ----------------- | ------------------------------------ |
| **Strike** | \$370 |
| **Expiry** | Aug 15, 2025 |
| **Entry Price** | \$0.53 (market open) |
| **Stop Loss** | \$0.26 (50% loss) |
| **Profit Target** | \$1.06 (100% gain) |
| **Position Size** | Risk 2-4% of account (1-2 contracts) |
---
### ⚠️ Risk Management & Notes
* Moderate gamma risk — manage actively as expiry nears
* Watch volume trends for sudden shifts
* Confidence level: **75%** — strong bullish signals but stay nimble!
---
### 📊 JSON Trade Snapshot for Algo Fans
```json
{
"instrument": "TSLA",
"direction": "call",
"strike": 370.00,
"expiry": "2025-08-15",
"confidence": 0.75,
"profit_target": 1.06,
"stop_loss": 0.26,
"size": 2,
"entry_price": 0.53,
"entry_timing": "open",
"signal_publish_time": "2025-08-11 14:59:39 UTC-04:00"
}
```
---
💡 **TL;DR:** TSLA’s weekly surge + bullish options flow make \$370 calls a compelling play this week. Manage risk, watch volume, and aim for that 2x profit target!
TSLA Don't Miss Out
### 🔥 TradingView Viral Post Format 🔥
---
### 📢 **Title:**
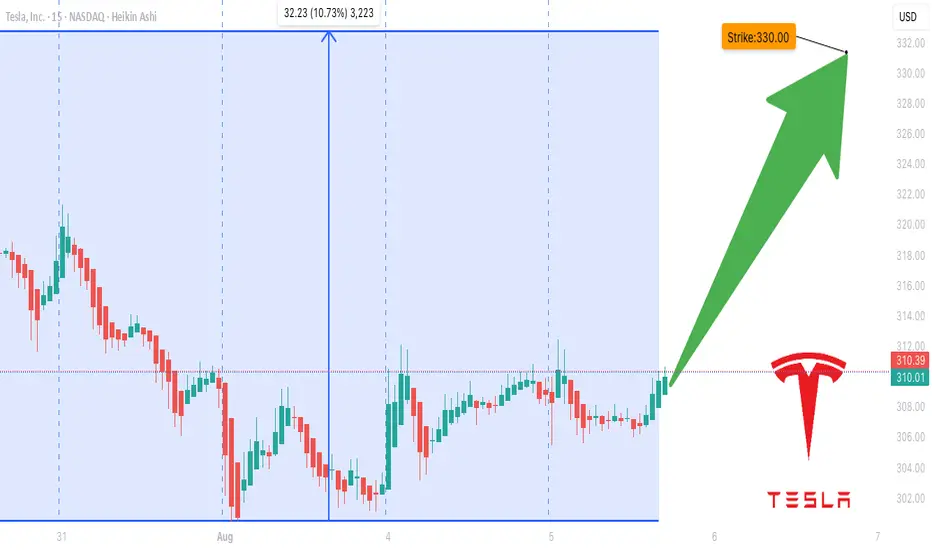
**TSLA Options Surge? \$330 Call Could Double in 3 Days — Here's the Setup** 🚀📈
---
### 📝 **Description:**
Tesla’s options market is flashing **moderate bullish signals** this week! 📊
✔️ Call/Put Ratio: **1.39** (Bullish)
✔️ RSI (Daily & Weekly): **Rising**
⚠️ Volume is light, but sentiment leans bullish.
🎯 **Trade Idea:**
Buy TSLA \$330 Call (Exp: Aug 8)
💰 Entry: \$0.85
🎯 Target: \$1.70
🛑 Stop: \$0.43
⏱️ Confidence: 65%
⚡ Gamma risk rising with time decay — tight execution is key.
Is this the breakout or a bull trap? Let’s watch it play out 👀
👇 Drop your thoughts or setups in the comments!
---
### 🏷️ **Tags (for TradingView):**
```
#TSLA #Tesla #OptionsTrading #CallOptions #BullishSetup #TSLAOptions #StockMarket #WeeklySetup #TradingStrategy #TechnicalAnalysis #TradeIdea #MomentumTrade #UnusualOptionsActivity #TradingView
TSLA Weekly Bearish Play — August 2, 2025
🔻 **TSLA Weekly Bearish Play — August 2, 2025** 🔻
🚨 **Multi-Model Consensus Signals a Tactical Put Opportunity**
### 🔍 Market Snapshot:
* **Daily RSI:** 39.9 (Bearish)
* **Weekly RSI:** 53.2 → Falling
* **Volume:** Weak (0.8x last week)
* **Options Flow:** Neutral (C/P Ratio \~1.04)
* **VIX:** 20.38 → Favorable for Options Plays
* **Institutional Support:** Weak
---
### 🔮 Model Consensus:
📉 **All major models (xAI, Google, Claude, Meta, DeepSeek)** confirm:
* Bearish momentum on both daily + weekly RSI
* Weak volume = cautious institutional behavior
* Volatility setup perfect for short-dated puts
---
### 🎯 Viral Trade Setup:
**💥 Trade Type:** PUT (Short TSLA)
**🔻 Strike:** \$300
**📆 Expiry:** 2025-08-08
**💰 Entry Price:** \$6.65
**🎯 Target Exit:** \$10.64 – \$13.30 (60%-100% gain)
**🛑 Stop Loss:** \$3.99
**📊 Confidence:** 65%
**📍 Entry Timing:** Monday open
**🕒 Signal Timestamp:** 2025-08-03 01:33:56 EDT
---
### ⚠️ Key Levels:
* Support to watch: **\$297.82**
* News/event risks: Stay alert ⚡
* Use tight risk controls for weekly plays!
---
🔥 **If you trade TSLA — don’t sleep on this one.**
Bearish consensus + clean setup = **high-probability weekly play.**

SLA Moderate Bullish Setup – Weekly Play for 08/01 Expiry
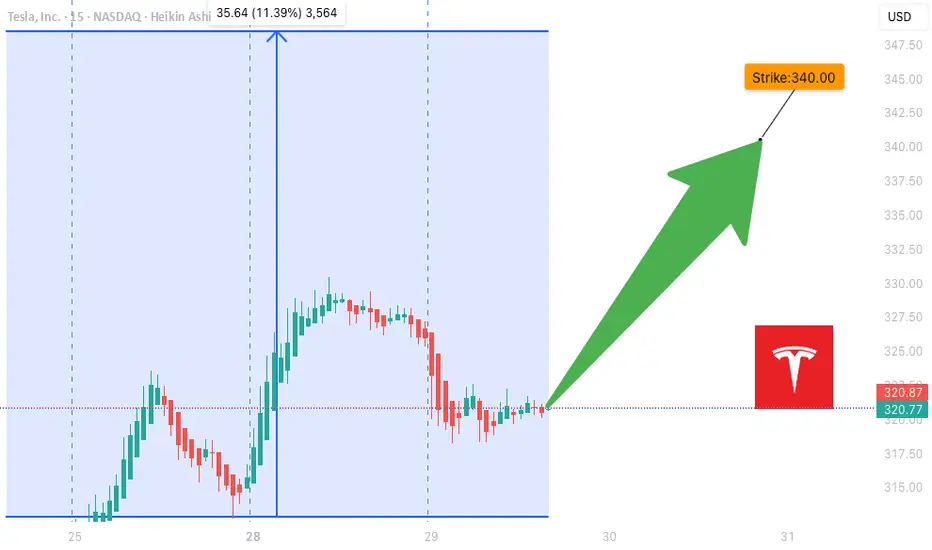
## ⚡ TSLA Moderate Bullish Setup – Weekly Play for 08/01 Expiry
🎯 *"Volume confirms it. RSI supports it. Time to strike—or stand by."*
---
### 🔍 Market Intelligence Snapshot:
📊 **Consensus**: Moderately Bullish
📈 **Weekly RSI**: Rising
📉 **Daily RSI**: Still Neutral (momentum building)
📉 **VIX**: Low → Great environment for call buying
📦 **Volume**: Strong institutional activity across models
---
### ✅ Recommended Trade Setup:
**TSLA \$340 CALL (Exp: Aug 1)**
💰 *Entry*: \~\$0.88
📈 *Target*: \$1.38
🛑 *Stop*: \$0.35
📆 *DTE*: 3 Days
🎯 *Entry*: Market Open
⚖️ *Confidence*: 65%
---
### 🔧 Model Blended Strategy Notes:
* Meta & Anthropic: Suggest ATM/ITM (\$327.50–\$330) → safer, higher cost
* Google & xAI: Prefer \$340–\$342.50 for a better risk/reward
* DeepSeek: Targets \$320 but with heavier premium
🧠 *Takeaway*: \$340 offers a balanced shot — affordable, but still responsive to upside flow.
---
### ⚠️ Risk Notes:
* ⏳ Time Decay → Quick exits = better outcomes
* 📰 External news or earnings reactions = watch for sudden volatility
* 🎯 Position size = keep light due to only 3 DTE
---
### 📊 TRADE SNAPSHOT (JSON):
```json
{
"instrument": "TSLA",
"direction": "call",
"strike": 340.0,
"expiry": "2025-08-01",
"confidence": 0.65,
"profit_target": 1.38,
"stop_loss": 0.35,
"size": 1,
"entry_price": 0.88,
"entry_timing": "open",
"signal_publish_time": "2025-07-29 10:16:14 UTC-04:00"
}
```
---
### 🧠 Quick Captions for Social:
* “TSLA bulls waking up? \$340C looks lit for the week 📈🔥”
* “Call volume surging. RSI rising. Low VIX. This \ NASDAQ:TSLA 340C might run 💥”
* “Risk-managed breakout shot — in and out fast 🎯”
TSLA WEEKLY OPTIONS SETUP
### 🚗 TSLA WEEKLY OPTIONS SETUP (2025-07-28)
**Big Call Flow. Low VIX. Can Bulls Hold \$325?**
---
📊 **Momentum Overview:**
* **Daily RSI:** 48.2 🔻 → *Neutral-to-Weak*
* **Weekly RSI:** 57.1 🔻 → *Still bullish zone, but falling*
⚠️ **Interpretation:** Momentum is softening, trend in question.
📉 **Volume Context:**
* **Volume Ratio:** 1.3x ⬆️ (vs. last week)
* **Price Change:** -0.77% despite that volume
🔍 *Distribution Alert:* Institutions may be selling into strength.
📈 **Options Flow:**
* **Call/Put Ratio:** **1.70** = 🚨 *Bullish flow confirmed*
* **Volatility (VIX):** 15.16 🟢 Favorable for directional plays
✅ Strong setup for options traders riding short-term momentum
---
### 🧠 **Weekly Sentiment Scorecard:**
* ✅ **Bullish Signals (2):** Options Flow, Volatility
* ⚠️ **Neutral Signals (2):** Daily & Weekly RSI
* ❌ **Bearish Signal (1):** Volume pattern = distribution risk
**Overall Bias:** 🟢 *Moderate Bullish*
---
### 🔥 **TRADE SETUP IDEA:**
🎯 **Strategy:** Long Call Option
* 📌 **Instrument:** TSLA
* 💵 **Strike:** \$355C
* 📅 **Expiry:** Aug 1, 2025
* 💸 **Entry:** \~\$0.75
* 🎯 **Profit Target:** \$1.50
* 🛑 **Stop Loss:** \$0.45
* 🔒 **Key Support to Watch:** \$327.50 — lose that = exit fast
📈 **Confidence Level:** 65%
⚠️ **Gamma Risk:** High → trade small, manage tight.
---
### 📦 TRADE\_DETAILS (JSON Format for Algo/Backtest):
```json
{
"instrument": "TSLA",
"direction": "call",
"strike": 355.0,
"expiry": "2025-08-01",
"confidence": 0.65,
"profit_target": 1.50,
"stop_loss": 0.45,
"size": 1,
"entry_price": 0.75,
"entry_timing": "open",
"signal_publish_time": "2025-08-01 09:30:00 UTC-04:00"
}
```
---
### 🧭 **Quick Notes for Traders:**
* ✅ Bulls have short-term edge — but **momentum is fading**
* ⚠️ If TSLA breaks below **\$325**, exit fast.
* 🔍 Watch for fakeouts: options flow is bullish, but volume says “not so fast.”
---
📊 TSLA \$355C → Risk \$0.75 to potentially double 📈
💬 Will this hold, or is it a bull trap before a dump? 👀
Comment below ⬇️ and follow for Monday updates!
---
**#TSLA #OptionsFlow #WeeklyTrade #TradingSetup #GammaRisk #AITrading #TeslaStock #UnusualOptionsActivity #SmartMoneyMoves**

Tesla Shares (TSLA) Drop Following Earnings ReportTesla Shares (TSLA) Drop Following Earnings Report
Yesterday, after the close of the main trading session on the stock market, Tesla released its quarterly earnings report. While both earnings per share (EPS) and gross profit slightly exceeded analysts’ expectations, the results reflected a negative trend driven by declining sales. This decline is being influenced by intensifying competition from Chinese EV manufacturers as well as Elon Musk’s political activity.
According to Elon Musk:
→ The company is facing “a few tough quarters” due to the withdrawal of electric vehicle incentives in the US;
→ The more affordable Tesla model (mass production expected in the second half of 2025) will resemble the Model Y;
→ By the end of next year, Tesla's financials should become "highly compelling".
Tesla’s share price (TSLA) fell by approximately 4.5% in after-hours trading, clearly reflecting the market’s reaction to the report. Today, the stock is likely to open around the $317 level, down from over $330 just the day before.
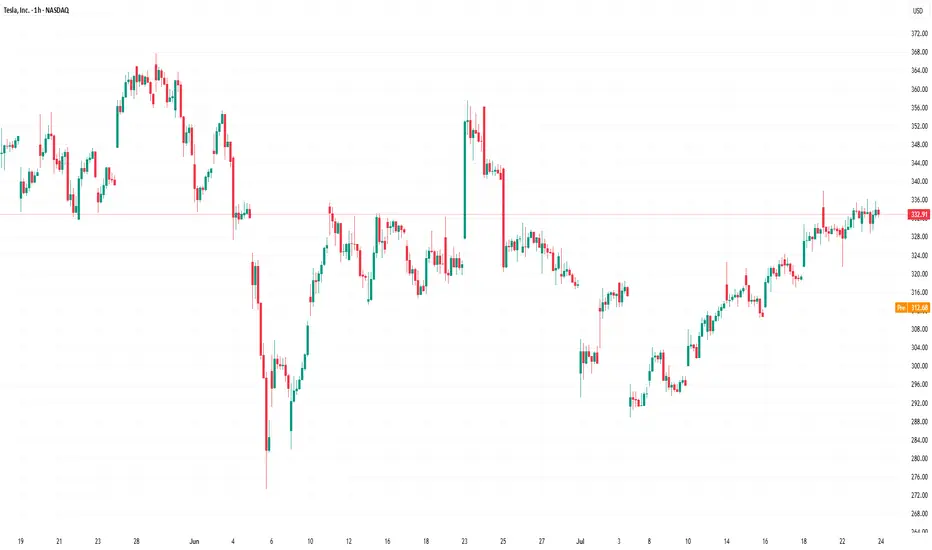
Technical Analysis of TSLA Stock Chart
In our analysis of TSLA charts dated 2 July and 8 July, we outlined a scenario in which the stock price could form a broad contracting triangle, with its axis around the $317 level.
The new candlesticks that have appeared on the chart since then have reinforced the relevance of this triangle, as the price rebounded from the lower boundary (as indicated by the arrow) and headed towards the upper boundary. However, yesterday’s earnings report disrupted this upward move.
Thus, while the broader stock market is trending higher (with the S&P 500 reaching a historic high yesterday), TSLA may remain "stuck" in a consolidation phase, fluctuating around the $317 level—at least until new fundamental drivers shift market sentiment.
This article represents the opinion of the Companies operating under the FXOpen brand only. It is not to be construed as an offer, solicitation, or recommendation with respect to products and services provided by the Companies operating under the FXOpen brand, nor is it to be considered financial advice.
TSLA WEEKLY CALL SETUP — 07/23/2025
🚀 TSLA WEEKLY CALL SETUP — 07/23/2025
📈 AI Consensus Signals 🔥 Bullish Move Incoming
⸻
🔍 SENTIMENT SNAPSHOT
5 AI Models (Grok, Gemini, Claude, Meta, DeepSeek) =
✅ MODERATE BULLISH BIAS
➡️ Why?
• ✅ RSI Momentum (Daily + Weekly = UP)
• ✅ Bullish VIX sentiment
• ⚠️ Weak volume + neutral options flow
• 🧠 No model signals bearish direction
⸻
🎯 TRADE IDEA — CALL OPTION PLAY
{
"instrument": "TSLA",
"direction": "CALL",
"strike": 380,
"entry_price": 0.88,
"profit_target": 1.76,
"stop_loss": 0.44,
"expiry": "2025-07-25",
"confidence": 65%,
"entry_timing": "Open",
"size": 1 contract
}
⸻
📊 TRADE PLAN
🔹 🔸
🎯 Strike 380 CALL
💵 Entry Price 0.88
🎯 Target 1.76 (2× gain)
🛑 Stop Loss 0.44
📅 Expiry July 25, 2025
📈 Confidence 65%
⏰ Entry Market Open
⚠️ Risk High gamma / low time (2DTE)
⸻
📉 MODEL CONSENSUS
🧠 Grok – Bullish RSI, cautious due to volume
🧠 Gemini – Momentum confirmed, weekly strength
🧠 Claude – RSI + VIX = green light
🧠 Meta – 3 bullish signals, minor risk caution
🧠 DeepSeek – RSI + volatility favorable, careful on size
⸻
💬 Drop a 🟢 if you’re in
📈 Drop a ⚡ if you’re watching this flip
🚀 TSLA 380C looks primed if we break resistance near $376
#TSLA #OptionsTrading #CallOptions #WeeklySetup #AIPowered #MomentumTrade #TeslaTrade #GammaRisk #ZeroDTEReady

$TSLA Weekly Call Play – 07/22/25
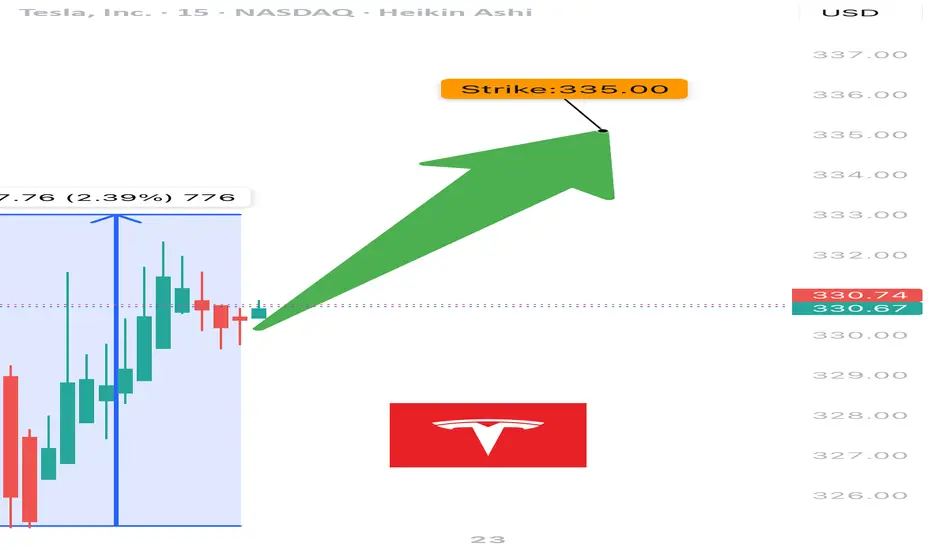
🚀 NASDAQ:TSLA Weekly Call Play – 07/22/25
RSI Bullish 📈 | Options Flow Strong 🔁 | Volume Weak 💤 | 3DTE Tactical Entry
⸻
📊 Market Snapshot
• Price: ~$332–335 (spot near strike)
• Call/Put Ratio: 🔁 1.24 – Bullish Flow
• Daily RSI: ✅ 57.6 – Rising momentum
• Weekly RSI: ⚠️ 54.8 – Neutral / flattening
• Volume: ❌ Weak – Institutional absence
• Gamma Risk: ⚠️ Moderate (DTE = 3)
• VIX: ✅ Favorable
⸻
🧠 Trade Setup
{
"Instrument": "TSLA",
"Direction": "CALL",
"Strike": 335.00,
"Entry": 9.90,
"Profit Target": 15.00,
"Stop Loss": 6.00,
"Expiry": "2025-07-25",
"Confidence": 0.65,
"Size": 1,
"Entry Timing": "Open"
}
⸻
🔬 Sentiment Breakdown
Indicator Signal
📈 Daily RSI ✅ Bullish – confirms entry
📉 Weekly RSI ⚠️ Flat – no long-term edge
🔊 Volume ❌ Weak – no institutional bid
🔁 Options Flow ✅ Bullish (C/P = 1.24)
💨 VIX ✅ Favorable for upside trades
⏳ Gamma Decay ⚠️ High risk (3DTE)
⸻
📍 Chart Focus
• Support Zone: $328–$330
• Breakout Watch: $335+
• Target Zone: $340–$345
• ⚠️ Risk Watch: Volume divergence + gamma decay on low move
⸻
📢 Viral Caption / Hook (for TradingView, X, Discord):
“ NASDAQ:TSLA bulls flash 335C with confidence, but volume’s asleep. RSI’s in, gamma’s ticking. 3DTE lotto with caution tape.” 💥📉
💵 Entry: $9.90 | 🎯 Target: $15.00+ | 📉 Stop: $6.00 | ⚖️ Confidence: 65%
⸻
⚠️ Who This Trade Is For:
• 🔁 Options traders chasing short-term call flows
• 📈 Momentum scalpers riding RSI pop
• 🧠 Disciplined risk managers eyeing 3DTE setups
⸻
💬 Want a safer bull call spread (e.g., 330/340) or risk-defined iron fly for theta control?
Just ask — I’ll build and optimize it for you.
TSLA racing to break thru resistancearea 1: 340
area 2: 360
will be tuned into earnings to see if the jig is jiggin July 23rd.
Elon is busy. so let's see what's the dealio.
****280 is a key level
**300 needs to hold for these attempts

Tisk Tisk TSLAShort thoughts on a neutral area. TSLA broke out of what appears to be bear flag to me. I also see an inverse cup & handle. We may attempt to retest and/or regain the channel. If we fail, 225-220 is my target. Demand zone marked. More journal notes this week to stay focused on the trade(s).
Bear Flag:
www.bapital.com
Cup & Handle:
www.investopedia.com
Inverse Cup & Handle ( from our very own Trading View):
youtu.be

Tesla (TSLA) Shares Among the Biggest Losers AgainTesla (TSLA) Shares Among the Biggest Losers Again
As the chart shows, Tesla (TSLA) shares opened yesterday’s trading session with a bearish gap and closed more than 5% lower than the previous day’s close. Meanwhile, the S&P 500 index (US SPX 500 mini on FXOpen) also declined, but by only around 1%.
Why Tesla (TSLA) Shares Fell
The recent two-day decline may be part of a broader downtrend. As we noted earlier in March, one of the key bearish factors could be Elon Musk’s political involvement in the Trump administration. For investors, this may imply that:
→ A significant number of potential Tesla customers may be put off by Musk’s political stance, slowing sales.
→ The CEO may not be paying enough attention to the company at a time of intense competition. Notably, Chinese EV manufacturer BYD Co. (CN:002594) has announced the launch of its Super e-Platform, which can charge a vehicle with a 400-kilometre range in just five minutes.
This sentiment is reflected in analysts’ decisions, as they continue to lower their target prices for TSLA shares, further fuelling negative sentiment.
TSLA Price Forecast
According to MarketWatch, RBC Capital Markets has cut Tesla’s target price from $440 to $320 due to a worsening outlook for the company’s robotaxi programme and autonomous driving software.
However, RBC analyst Tom Narayan maintained a “Buy” rating on Tesla (TSLA) shares, stating that concerns over a sharp sales drop in Europe and China are “overblown.”
Technical Analysis of Tesla (TSLA) Chart
The previously identified downward channel (marked in red) remains relevant. However, price action suggests that selling pressure may be easing:
→ The decline on 10 March (marked by arrow One) was much more aggressive, but the downward momentum has since slowed (also marked by arrow One).
→ During yesterday’s session, the price closed only slightly below the opening level, suggesting that bears are hesitating near the yearly low.
This could potentially lead to a bullish Double Bottom pattern, increasing the likelihood of an attempt to break above the current resistance around the psychological level of $250.
This article represents the opinion of the Companies operating under the FXOpen brand only. It is not to be construed as an offer, solicitation, or recommendation with respect to products and services provided by the Companies operating under the FXOpen brand, nor is it to be considered financial advice.

TESLA: 4 Hour DOWN TO THE 5 MINUTE MUST WATCH FOR WHATS NEXTMORNING TRADERS
currently this video is an extension of my last Tesla video I did we are are still trying to go to: will be break up and hit our 272 target or will need a bit more correcting to do before we can try our hands at the long trades.
I break this video down for you to give you the best insight into the best levels to look for if you trying to trade Tesla and why
Enjoy
MB Trader
Happy Trading

TSLA (Tesla) Technical Analysis and Trade Idea Upon analyzing TSLA (Tesla), we can see that it has been in a sustained downward trend. Notably, price has entered a critical support zone, exhibiting a double bottom pattern on the chart. Additionally, there has been a downward move beneath this double bottom, tapping into liquidity.
Given the significance of this support zone, I anticipate a reaction, potentially leading to a substantial retracement. Another noteworthy aspect is the imbalance above the current price range, which could serve as a target. Furthermore, I acknowledge the influence of seasonality in stock markets, a topic I delve into within the accompanying video. In the video, we explore trends, price action, market structure, and other essential elements of technical analysis.

The Best Solution To Position TeslaThis chart is not good right now
I shouldn't break the red trend line down, but it's going down...
If Tesla Shares Eventually Break Down The Red Trend Line
The green rising trend line becomes the target

TSLA Rebounds from $164.76 Support LevelMy TSLA forecast has been one of my most accurate predictions so far, and TSLA has reached the $164.76 price target discussed in my previous updates. NASDAQ:TSLA initially dipped below the $164.76 support level, but had a bullish rebound at the support line. TSLA is red today, but could be forming a bullish retest of the $164.76 support line. I would keep an eye on the $164.76 support level on the way down to see if it holds or whether TSLA loses support here.

TSLA Technical Analysis and Trade IdeaMarket Observations: #TSLA has experienced downward pressure as evidenced by the distinct pattern of lower highs/lows on the daily chart, signaling a clear downtrend. A significant price gap exists above the current trading range. This setup suggests a potential stop run above the range to clear liquidity, providing an opportunity for larger institutions to fill short orders.
Trade Strategy: Target a short entry on a potential stop run above the range. Aim for an initial profit target at the previous daily low, with a secondary target at the 165 level, which aligns with a prior daily low. Manage risk with a strategically placed stop-loss order.
Disclaimer: This analysis reflects my personal opinion and does not constitute financial advice. Always conduct your own comprehensive research and risk assessment before executing any trades.

TSLA after the earningsTSLA is in its downtrend channel but below the main support rising channel, which was tested several times from below - bearish action.
We were looking for an expected volatility move after the earnings of +/-7%. So far the price is down over 7% and still sliding.
Looking for a gap fill next at minimum, which sits at 193.17

$TSLA Trending Towards $180 Support LevelTSLA had a strong rejection at the yellow resistance line, and has been dropping straight down several support levels over the past few weeks. The $240 orange support line was immediately lost, and TSLA just lost support at the $207.50 green support line. There is a lot of pessimistic news surrounding the sustainability of EVs, and TSLA had a poor earnings report that further hurt investor's future outlook. The $180 light blue support level is the next key price to monitor for a potential bounce. There has been strong support here in the past.
