TESLA An opportunity to buyHi, according to my analysis of Tesla stock, there is a great long-term investment opportunity. Especially with a downward channel break. With a very green positive candle on the daily timeframe. outside the parallel channel. good luck for everbody .Note: If you like this analysis, please give your opinion on it. in the comments. I will be happy to share ideas. Like and click to get free content. Thank you
Tslachart

TSLA $200's ResistanceTSLA opening above $198.5 should go up towards $204 gap fill possibly $206 retracement ...
resistance @ $$199.5-200.5 then $204 (2 sigma weekly Move)
If Fed is Dovish today with a 25bp hike this will help to push bullish narrative
Fed with 25bps and Hawkish rhetoric can stop the bull run.
Below $194, we could see Tesla go for Gap fill below and settle around $190 to finish the week
This Feels like a Bull Trap set-up- just my opinion
I bought back in @ 175
Since I plan on taking Profits for this week I will look into selling $200-$205 calls against my $175 price positions *** this is a profit taking options position,
I would not sell calls if I did not own shares at that lower price.

$TSLA bulls keeping the TSLA alive!$TSLA holding it own this morning, keeping the momentum up just above $200 level. tesla must stay above the $190 to $200
to continue its momentum to upside. no new catalyst for tesla except the anticipation of the new tesla model 3 which still no
further announcement. also Elon Musk face class action lawsuit from shareholders, overstating the effectiveness and safety of
the company's autopilot and full self driving technologies.
below is the price level I'm looking for $TSLA:
TGT average price move per day is $7-12 per day depending on market volatility and catalyst.
Below is the price level I'm looking for entry and exit for TSLA:
Buy call above 209.26 and sell at 211.73+ or above
Buy puts below 204.17 and sell at 201.52 or below
make sure that you set up alerts on those key level so you wont miss the move.
and always to take your profits as you see one.

TSLA setting up for a pull back?$TSLA slightly pulls back after soaring for couple of weeks. this pulls back is expected and it might setting up for another pulls back or consolidate
if needs to cools off. TSLA bulls needs to hold the 190 level or bears might gain some momentum here to break below 190.
no majors news to push the TSLA except the analyst upgrade to buy rating.
TSLA average price move per day is $7-$13 per day depending on market volatility and catalyst.
Below is the price level I'm looking for entries and exit for TSLA:
Buy call above 203.31 and sell at 205.90+ or above
Buy puts below 196.61 and sell at 194.50 or below
make sure that you set up alerts on those key level so you wont miss the move.
and always to take your profits as you see one.

TSLA REBOUNDS OF 105!!!!TSLA having a massive buy presence in the premarket this morning. Could this be a sign good things are coming? I think not, over the last 5 trading sessions TSLA dropped a eye watering 21% !!!
Here are some factors of why TSLA has declined a MASSIVE 72% this year :
Inflation -> Fed tightening -> Risk-off assets looking more attractive
Elon has sold $23bn worth this year alone to finance the twitter acquisition. If advertisers continue to flee, he will need to sell more to finance debt payments from LBO.
He has pledged not to sell anymore till 2024
There have been large concerns from major investors around Elon's time commitments as CEO given Twitter acquisition.
Fears of a global recession next year are causing concerns around luxury car demand. Consumers will be reluctant to spend $80,000 on a new car with used car prices tanking.
No $30,000 Tesla car yet.
Concerns about Chinese demand given COVID cases and lockdowns hurting demand for luxury vehicles.
No wide FSD rollout, No Cybertruck
Ouch......

$TSLA possible footing is near ?Marking support zones and trying to find possible next Demand zone below.

TSLA turning point in growthTSLA turning point in growth
new time to look for a buy entry point
buying from the lower border of the descending conal Time to buy a new model)))

TSLA at Critical Level - Could Go Either WayTSLA is at a critical point with the volume shelf and other factors that could mean either direction.
Bull Case:
Retesting Breakout Level
Falling Wedge on Daily/65m
Bullish Divergence on 65m
Some Bollinger Band squeezing on 65m
Bear Case:
Net Premium flow favors puts heavily
Bearish Engulfing Candle on Weekly
MACD crossing down on Daily
Hidden Bearish Divergence on Daily that may not have completely played out
May be slightly below volume shelf - next shelf at $912
Diminishing Volume on Daily
So:
If Bulls Win... (price breaks $1,037)
PT1 - $1,045
PT2 - $1,065
PT3 - $1,087
If Bears Win... (price breaks $1,021)
PT1 - $1,011
PT2 - $1,000
PT3 - $1,090

Is Tesla still plugged into Bitcoin?The prices of cryptocurrencies including Bitcoin, the most popular of the lot, have been highly volatile in recent months due to conflicting regulatory signs and rising interest rates.
Despite the massive sell-off of digital tokens, Tesla (NASDAQ:TSLA) CEO Elon Musk is among those who are still bullish on digital currencies. As such, the recently reminted $1 trillion dollar company is caught in the crosshairs of movements in the cryptocurrency market.
Bitcoin price crash
After reaching an all-time high of $67.5K in November, the price of Bitcoin is now hovering around $40K since the start of the year. The crash is partly due to remarks from the US Federal Reserve about launching its own digital currency similar to China’s e-renminbi and US President Joe Biden’s recent order directing government agencies to coordinate on a regulatory framework for digital currencies.
While the regulatory forces mentioned above have helped to suppress any upside in digital assets, the largest contributor in the price crash of Bitcoin is the about-face that Musk, and by association Tesla, pulled for its support of Bitcoin. In a way, those cryptocurrency crosshairs are attached to the rifle wielded at times by Musk and Tesla.
Tesla’s $1.5 billion Bitcoin stash
Last year, Tesla revealed that it invested a total of $1.5 billion in Bitcoin and hinted that it may acquire and hold digital assets “from time to time or long-term.” Since that announcement in February 2021, the company has had no additional Bitcoin purchases.
Tesla disclosed in its 2021 annual report that it still held around $1.26 billion worth of digital assets and incurred $101 million of impairment losses on its digital assets.
At the same time, the EV leader also reiterated its confidence in the long-term potential of digital assets both as an investment and as a liquid alternative to cash. However, the carmaker warned, in an ambiguous statement, that it may boost or reduce its digital asset holdings based on its business needs and on its view of market conditions. However, knowing Tesla dependency on Musk as its “product architect and social media manager”, as quoted by Bloomberg, the company’s position on digital currency’s may be far closer aligned with his own personal view than the above statement suggests.
Over a month after the company’s disclosure, Musk on Twitter said he still owns and “won’t sell” his own personal Bitcoin, Ethereum or Dodge holdings, stressing that “it is generally better to own physical things like a home or stock in companies you think make good products, than dollars when inflation is high.”

$TSLALooks like a big correction is coming...a 40% correction happened last year after the ER...This year is different due to monetary policy changes....might go much lower than last year...

$TSLA breaking out of cup & handle pattern | Very bullish Tesla is b NASDAQ:TSLA $TSLA Breaking out of cup and handle pattern. Technicals and fundamentals both indicating new ATH imminent with potential to reach 2k per share near term.
$TSLA is breaking out of the cup and handle pattern that's been forming on the 4h chart. Confirmed bullish move as it gapped out of the handle channel today. Next area of resistance is around 1315$ where the 61.8% and trend line meet, so a new ATH in the 1300 zone seems to be an imminent target.If Tesla can break out of that strong resistance area then I think around 1559$ would be the next area of resistance since that’s where the 100% fib and the target height of the cup pattern intersect. If after that, strong fundamental momentum continues due to some strong upcoming catalysts such as ER numbers, Austin and Berlin factory updates or some other bullish news released, then reaching the 168% fib extension at 2k can happen quickly.
Either ways things are looking very bullish right now for Tesla .
Key areas of resistance and potential target zones:
Conservative target= 1315
Medium risk target= 1559
Aggressive target= 2002

TSLAHello. Due to the negative divergence in the weekly time frame and the formation of the weekly candle, it is predicted that the correction will continue

TSLA Analysis, Double Top !!Hello everyone, as we all know the market action discounts everything :)
_________________________________Make sure to Like and Follow if you like the idea_________________________________
TSLA is currently trading in the upper part of its 52-week range. The S&P500 Index is also trading in the upper part of its 52-week range, so TSLA is performing more or less in line with the market.
The long-term trend is positive and the short-term trend is neutral. The long-term trend may just continue or reversal may be around the corner!
A double top pattern has been spotted on the daily chart which could lead the TSLA stock back to the $850 levels.
Possible Scenario for the market :
The market is trading at $1014.97 and it's nearing the neckline of the double top pattern located at the $1001 range, if a breakout happens of that line we could be seeing the TSLA stock drop to the $850 level. and a lot of the indicators are showing Bearish signs that would support the double top pattern.
In case the support line held strong then we could be seeing a Bullish movement that will lead the TSLA stock price back to the resistance level located at $1112.85
Technical indicators show :
1) The market is below the 5 10 20 MA and EMA indicating a Bearish short-term trend, But still above the 50 100 and 200 MA and EMA (Bullish long-term trend)
2) The RSI is at 44.20 showing some weakness in the market.
3) The MACD is below the 0 line indicating a bearish state in the market with a negative crossover between the Signal line and the MACD line.
Support & Resistance points :
support Resistance
1) 1029.10 1) 1168.14
2) 976.28 2) 1254.36
3) 890.06 3) 1307.18
Fundamental point of view :
Tesla Inc has asked a U.S. court to affirm an arbitrator's recent decision dismissing a former engineer's claims that the automaker fired and defamed her for raising concerns about defective floormats and contracting practices.
TSLA has a Return On Assets of 6.00%. This is better than the industry average of -1.33% and The Earnings Per Share has grown by an impressive 174.51% over the past year.
Looking at the last year, TSLA shows a very strong growth in Revenue. The Revenue has grown by 66.27% and based on estimates for the next 5 years, TSLA will show a very strong growth in Revenue. The Revenue will grow by 35.52% on average per year.
This is my personal opinion done with technical analysis of the market price and research online from Fundamental Analysts and News for The Fundamental point of view, not financial advice.
If you have any questions please ask and have a great day !!
Thank you for reading.

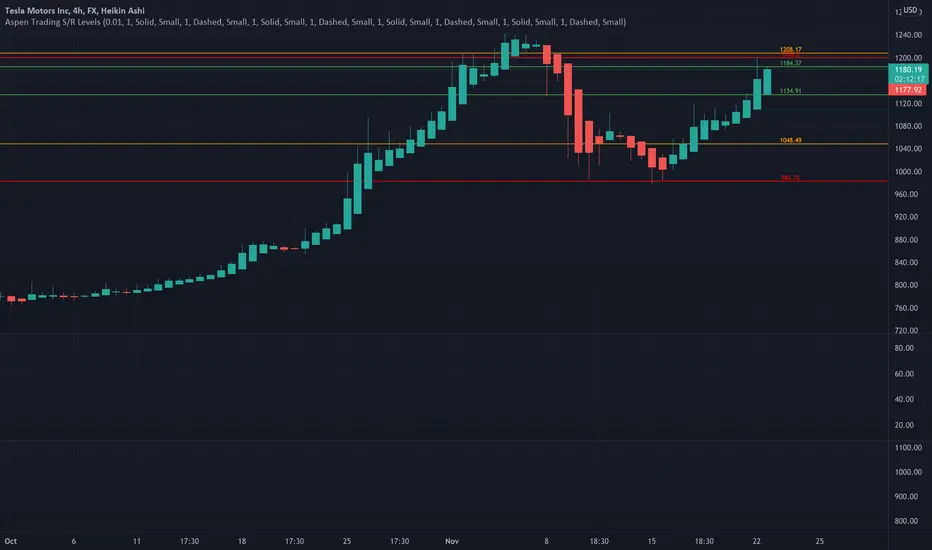
TSLA had a beautiful bounce from support Using Aspen Trading Support & Resistance Levels, TSLA has bounced from 982 support and can face the resistance at 1208.
A move above 1208 level will see further upside to TSLA.
Note - Aspen Trading S/R levels are invite only. They can be accessed through my profile information.
Disclaimer: This analysis is for information purpose only and does not constitute any investment advice.
TSLA matters a lot to the overall market Using Aspen Trading Support & Resistance Levels, a move below 978 is going to break the support and things can get ugly really quickly from that point for TSLA.
The overall market can also get impacted if the 1.2 trillion market cap of TSLA shrinks in size.
Please provide your feedback in comments if you like the analysis.
Note - Aspen Trading S/R levels are invite only. They can be accessed through my profile information.
Disclaimer: This analysis is for information purpose only and does not constitute any investment advice.

10/24/21 TSLATesla, Inc. ( NASDAQ:TSLA )
Sector: Consumer Durables (Motor Vehicles)
Current Price: $909.68
Breakout price trigger: $900.40 (hold above)
Buy Zone (Top/Bottom Range): $894.00-$834.00
Price Target: $1120.00-$1128.00
Estimated Duration to Target: 41-46d (1st)
Contract of Interest: $TSLA 12/17/21 1000c
Trade price as of publish date: $20.40/cnt

TSLA all time high$TSLA (TESLA) just reached all-time-high! Very bullish news especially for the stock that makes up the bulk of my portfolio. Congrats to those who followed me as well. My $TSLA portfolio is up by approximately 30% - with averaged price right below $700.
However, $TSLA is at $900 right now and RSI and bollinger bands is indicating that $TSLA is current very overbought right now. The rally came from their bullish earnings report that just got released recently: www.cnbc.com
Overall, i'm still very bullish on $TSLA and is holding it for the long run. Crypto gains might be hard to beat compared to equities but its very important to diversify and have both asset classes.

TSLA short soon readyHi there,
Tesla still looks bullish but price action is preparing a big bearish move to the downside, wait for wave 5 to complete to short it, or just go long with it till we near the top.
Target 400
Good luck

$TSLA - Cup & Handle PT $1,300 by Jan 2022Massive Cup and Handle Setup in a massive upward Channel. Price Objective of breaking above $1,300 by EOY/Jan 2022

TSLA - If Price Makes The News...If price makes the news, and not the other way around - then around August 12th, 2021 seems like the right time to release some company specific breaking news.
In TSLA's case, we have a ~6 month wedge forming that converges on 8/12/21.
Price is currently coiling in a tight range, and will need to resolve itself directionally within 2 weeks.
Look for signs of accumulation and watch what price does at the lows for clues.

TSLA - Elliott Wave Analysis - CorrectionHi All,
I'm a long term Tesla Bull, but bearish short term, the price action suggest short term bearish price action.
Reasons
- No Catalyst until July Delivery Numbers
- No S/X Deliveries yet
- Nasdaq still in correction mode and has a room to come down, pressure on tech/growth stocks.
- Elon's tweets about FSD subscription(impacts financials) and FSD V9 release dates(impacts no financials on short term, helps perception which is good) are still in the air with no factual date of release.
- Elon's sudden move on BTC adoption, then again sudden reaction on it's rejection, creates only confusion and markets don't like it, but this will have only short term ~1 day impact on trading.
PS: This is just my opinion based on price action and macro level economics. Please be careful picking your trades.

TSLA closed above the inside box today. Going up!Closed above key price level 701 today. If it holds 659 level, next upside target levels are 721, 762, 800 and 870 before new ATH. Let's see how it travels up.

TSLA Algorithm looking to go long!TSLA algorithm went long on March 31st on the 30 min timeframe around the 613 level and ran up to 668! We were able to catch this wave and made a good profit. We are looking to build position once TSLA Algorithm signals long on the daily timeframe which could have huge move to the upside going into earnings!
The plan is to wait until the TSLA algorithm enters into a long position on the daily timeframe with TTM Squeeze setting up. RSI is also reversing back into the 50 level which is a good sign along with the MACD signaling a bullish reversal. This can be a big potential move for TSLA and could be our biggest trade for the year yet!
