TSLA: Wave 4 or Explosive Momentum – Get Ready for a Big MoveTSLA: Wave 4 or Explosive Momentum – Get Ready for a Big Move
📈 Weekly Scenarios
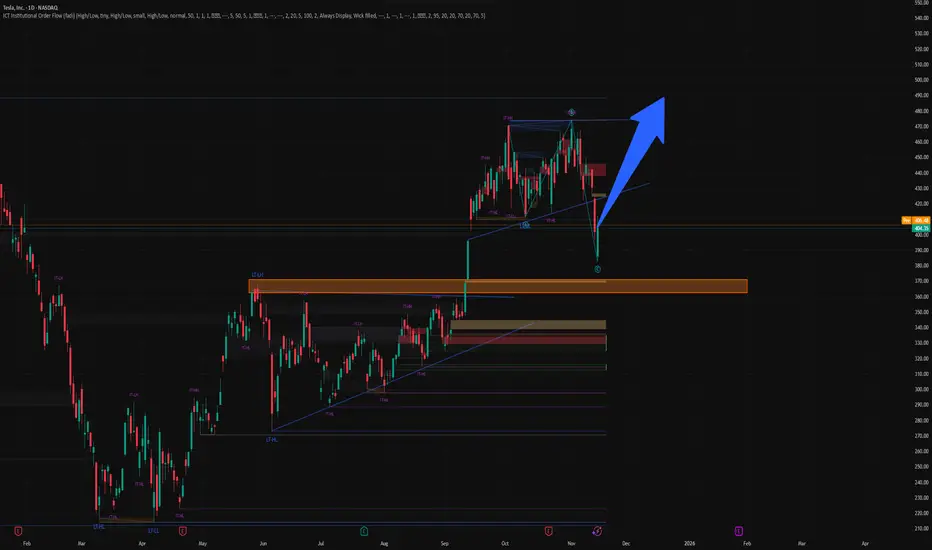
Bullish scenario:
The price holds the $436–$449 zone, ending the correction with wave 4.
Breaks above $470–$471, triggering wave 5 → target of $488–$505+.
Consolidation:
The price is in the $436–$471 range, without a clear breakout, preparing for the next impulse.
Bearish scenario:
Breakthrough of support at $425–$397 → possible reversal or deep correction instead of growth.
✅ Conclusion
Tesla is at an important wave crossroads – it either completes the correction and prepares for a strong rally, or reverses downward.
Key points to watch: $436–$449 (correction support) and $470–$471 (resistance breakout).
Confirmation of the wave structure and price reaction at these levels will be critical for making trading decisions.
Tslaidea
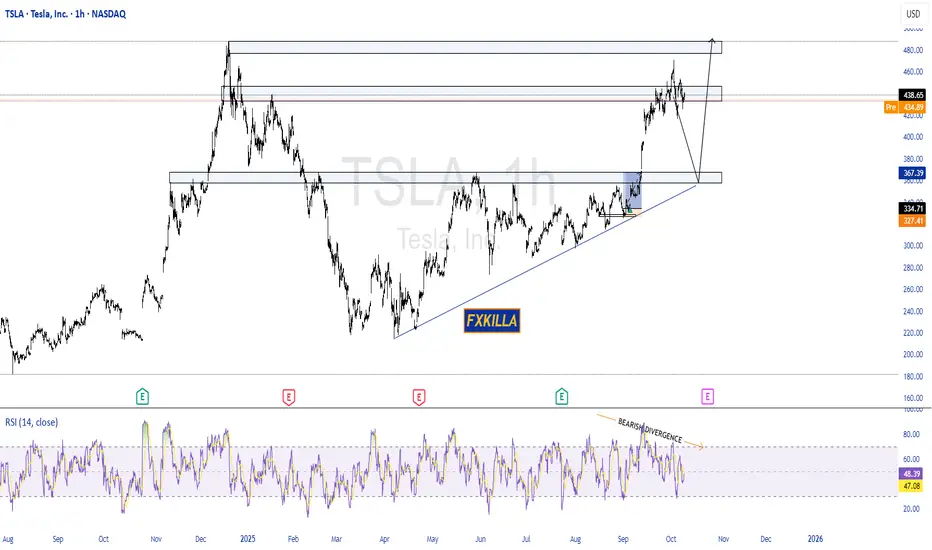
TESLA BIG SELL PROBABILITY SETUP SOON!!!🚨 TESLA HIGH PROBABILITY SELL SETUP 🚨
* Here We Can See Clearly The Next Potential Moves For TSLA Coming Hours/Days.
* Keep Your Eyes Close On Your Trading Positions.
* Happy PIP Hunting Traders.
FXKILLA.

TESLA HIGH PROBABILITY SETUPS SOON!!!🚨 TESLA HIGH PROBABILITY SELL/BUY SETUPS 🚨
* Here We Can See Clearly The Next Potential Move For TSLA Coming Hours/Days.
* Keep Your Eyes Close On Your Trading Positions.
* Happy PIP Hunting Traders.
FXKILLA.
TSLA $375 Call –Momentum + Options Flow Edge!
⚡ **TSLA 1‑Day Earnings/Weekly Scalp!**
📅 **Expiry:** 2025-09-12
🎯 **Strike:** \$375 CALL
💵 **Entry:** \$1.38 (Ask)
🛑 **Stop Loss:** \$0.69 → strict 50%
📈 **Profit Target:** \$2.07 (\~+50%)
📊 **Confidence:** 70% (Moderate Bullish)
⏰ **Entry Timing:** Market Open
💎 **Why This Trade:**
* Multi-timeframe momentum bullish (daily RSI 70.4, weekly RSI 67.8)
* Institutional call flow C/P = 1.57 → strong directional skew
* Low VIX (14.9) supports call buying
* Balanced strike with high liquidity (OI 16,237)
* Quick scalp: exit by Thursday close — avoid Friday gamma crush
⚠️ **Key Risks:**
* 1 DTE → extreme gamma & theta decay
* Underlying volume moderate → pullbacks possible
* News can reverse the move rapidly
* Use **small position sizing** (1–3% max risk)
💡 **Execution Tips:**
* Use limit at ask (\$1.38) or slightly better for control
* Hard stop at \$0.69
* Scale out at \$2.07 or partial at \$1.80
* Monitor intraday VWAP & price action; abort if momentum stalls
🎯 **Quick Take:** Cheap, high-conviction 1-day scalp with defined risk & asymmetric upside. Fast in, fast out, gamma-aware trade.

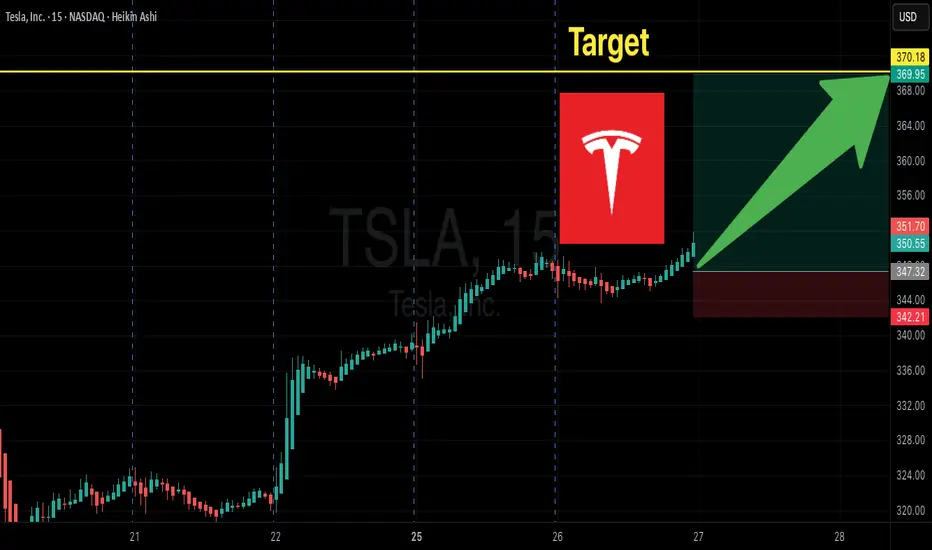
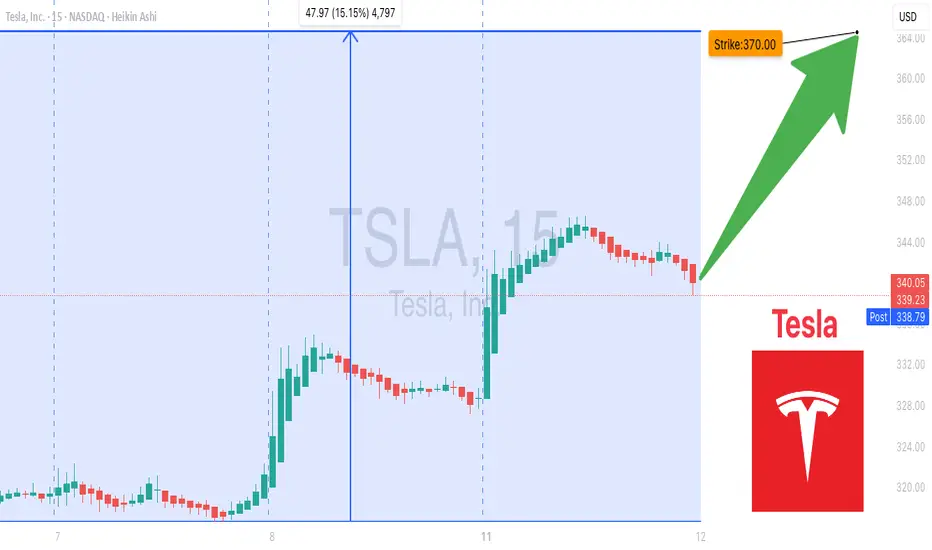
Tesla Options Flow Signals BIG Upside! $370C Momentum Trade
# 🚀 TSLA Weekly Options Setup | 370C Targeting 100%+ 📈
### 🔑 Key Highlights
* **Momentum:** RSI rising on both Daily (63.5) & Weekly (68.4) ✅
* **Options Flow:** Strong bullish skew (C/P = 1.79) 🟢
* **Volume:** Weak overall (0.9x), but institutional spike into close ⚡
* **Volatility:** VIX low → favorable for directional calls 😎
---
### 📊 Trade Setup (Consensus Pick)
* 🎯 **Instrument:** TSLA Weekly Call
* 💵 **Strike:** \$370C
* 📅 **Expiry:** 2025-08-29
* 💰 **Entry:** \$0.98 (ask) — open
* 🛑 **Stop:** \$0.49 (-50%)
* 🎯 **Target:** \$1.96 (+100%)
* ⏳ **Max Hold:** Close by **Thursday EOD** to avoid Friday theta/gamma crush
---
### 📌 Why \$370C?
* Best **liquidity** (OI \~18,450, vol 20k) → tightest fills ✅
* Balanced **delta & leverage** for short-term momentum 🎯
* Aligns with most model recommendations 📊
---
### ⚠️ Risks to Watch
* 🔻 **Theta decay** accelerates mid-week → avoid holding to Friday
* 🔻 **Gap risk** at open — manage entries with limit orders
* 🔻 **Market reversal** can kill momentum fast
---
## ✅ Final Verdict: **Strong Weekly Bullish Bias**
TSLA looks primed for an upside push — \$370C is the sweet spot for this week’s expiry.
---
### 🔥 Hashtags
\#TSLA #OptionsTrading #WeeklyOptions #StocksToWatch #MomentumTrading #TradingSignals #CallOptions #BullishSetup #TeslaStock
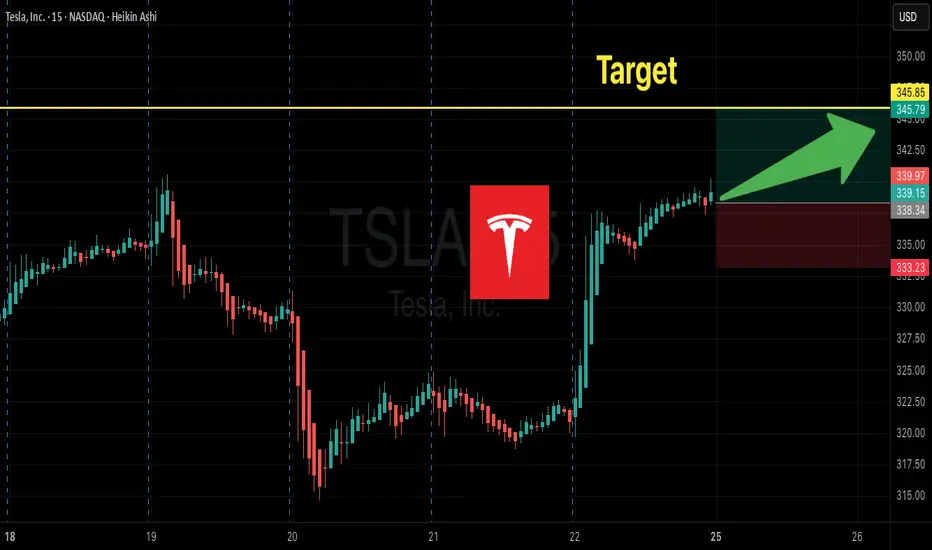
TSLA Weekly Options Setup:345C--Don’t Miss Out
# 🚀 TSLA Weekly Options Setup: Bullish Momentum Play w/ \$345C 🎯 (Aug 29 Expiry)
### 🔑 Multi-Model Summary
✅ RSI (Daily 60.1 → Weekly 65) = Bullish momentum
✅ VIX \~14.2 = Favorable volatility regime
⚠️ Weak weekly volume (0.9x) + neutral options flow (C/P \~1.10)
⚖️ Mixed models → Some lean bullish (\$345–355C), others prefer **no trade** due to weak institutional flow
---
### 📊 Recommended Trade (If You Take It)
* 🎯 **Instrument**: \ NASDAQ:TSLA
* 📈 **Direction**: Call (Long)
* 🎯 **Strike**: \$345C
* 💵 **Entry**: \~\$6.00 (limit at open)
* 🛑 **Stop**: \$3.60 (40% risk control)
* 🎯 **Target**: \$9.00 (+50%)
* 📅 **Expiry**: 2025-08-29
* 📏 **Size**: 1 contract (scalable)
* ⚡ **Exit**: By **Thursday close** (avoid Friday gamma decay)
* 🔒 **Confidence**: 65% (moderate conviction)
---
### ⚠️ Key Risks
* Weak volume = no big-money confirmation
* Event risk (SpaceX headlines)
* 5 DTE = aggressive theta decay
* Gamma swings → fast intraday moves
---
### 📌 Conclusion
Momentum favors upside, but lack of strong institutional confirmation = **medium conviction**.
👉 Conservative traders: wait.
👉 Active traders: \$345C is the best balance of **delta, liquidity, and leverage** this week.
---
### 🔥 Hashtags
\#TSLA #OptionsTrading #WeeklyOptions #CallOptions #SwingTrade #DayTrading #MomentumTrading #OptionsFlow #BreakoutTrading #StockMarket 🚀📈💎🔥
TSLA $365 Calls Heating Up – Big Move Ahead, Don’t Miss Out! 🚀 TSLA Weekly Options Analysis (2025-08-17) – Don’t Miss Out!
### 🔎 Model Insights Recap
**Grok/xAI Report**
* 📊 Signals: Bullish RSI + Options Flow + Volatility
* 🔊 Volume: Weak → ⚠️ caution
* 🛑 Decision: **No trade** (mixed confirmations)
**Gemini/Google Report**
* 📊 RSI: Rising (Weekly 63.7 = bullish momentum)
* 📈 Call/Put Ratio: **1.58** → institutional bullish bias
* ✅ Decision: **Buy \$365 Call** (Moderate Bullish)
**Claude/Anthropic Report**
* 📊 Weekly trend & call flow strong
* 🔊 Volume weak = confidence tempered
* ✅ Decision: **Buy \$340 Call** w/ strict risk mgmt
**Llama/Meta Report**
* 📊 Weekly momentum bullish, daily RSI neutral
* 📈 Options Flow: Positive
* 🔊 Volume: Weak
* ✅ Decision: **Buy \$352.50 Call**, targeting moderate gains
---
### 📌 Agreement
✔️ All models = **Moderate Bullish** bias (weekly RSI strength + options flow)
✔️ Key driver = **institutional positioning** & favorable volatility
### 📌 Disagreement
⚖️ Grok → **No trade** (volume too weak)
⚖️ Gemini/Claude/Llama → **Bullish calls** w/ different strikes & risk levels
---
## 📊 Recommended Trade Setup
* **Direction:** CALL (Long)
* **Strike:** \$365
* **Expiry:** 2025-08-22
* **Entry Price:** \$0.65 (limit order)
* **Stop Loss:** \$0.32 (50% premium)
* **Profit Target:** \$1.30 (100% return)
* **Strategy:** Single-leg naked calls
* **Entry Timing:** Market Open
* **Confidence:** 65%
---
### ⚠️ Key Risks
* Weak **volume** = 🚫 risk of failed breakout
* Must monitor **follow-through** carefully → momentum may stall without institutional push
---
## 📌 Final Outlook
**TSLA = Moderate Bullish Bias** ✅
Institutional call flow supports upside, but weak volume = proceed with **tight risk management**.
---
📊 **TRADE DETAILS JSON**
```json
{
"instrument": "TSLA",
"direction": "call",
"strike": 365.0,
"expiry": "2025-08-22",
"confidence": 0.65,
"profit_target": 1.30,
"stop_loss": 0.32,
"size": 1,
"entry_price": 0.65,
"entry_timing": "open",
"signal_publish_time": "2025-08-17 09:22:38 EDT"
}
```

TSLA Momentum Unstoppable To $370— Don’t Miss Out! 🚀 TSLA Weekly Options Analysis — Bullish Momentum Confirmed! (2025-08-11) 🚀
### 🔥 Key Highlights:
* **RSI Signals Bullish:** Daily RSI at **59.5**, Weekly RSI at **54.9** — momentum is building strong!
* **Massive Weekly Gain:** +13.62% this week, breaking past key moving averages & resistance levels.
* **Options Flow:** Call/Put ratio at **1.77** — traders and institutions betting big on upside!
* **Volatility:** VIX low at **15.8** — ideal environment for bullish directional trades.
* **⚠️ Volume Caution:** Weekly volume at **0.8x** last week — watch closely for institutional commitment shifts.
---
### 📈 Consensus:
Most models say: **BULLISH** ✅
* Momentum + Options Flow + Low Volatility = Perfect setup
* Volume dip is a caution flag but not a dealbreaker (yet).
---
### 🎯 Trade Setup: Buy Calls on TSLA
| Parameter | Details |
| ----------------- | ------------------------------------ |
| **Strike** | \$370 |
| **Expiry** | Aug 15, 2025 |
| **Entry Price** | \$0.53 (market open) |
| **Stop Loss** | \$0.26 (50% loss) |
| **Profit Target** | \$1.06 (100% gain) |
| **Position Size** | Risk 2-4% of account (1-2 contracts) |
---
### ⚠️ Risk Management & Notes
* Moderate gamma risk — manage actively as expiry nears
* Watch volume trends for sudden shifts
* Confidence level: **75%** — strong bullish signals but stay nimble!
---
### 📊 JSON Trade Snapshot for Algo Fans
```json
{
"instrument": "TSLA",
"direction": "call",
"strike": 370.00,
"expiry": "2025-08-15",
"confidence": 0.75,
"profit_target": 1.06,
"stop_loss": 0.26,
"size": 2,
"entry_price": 0.53,
"entry_timing": "open",
"signal_publish_time": "2025-08-11 14:59:39 UTC-04:00"
}
```
---
💡 **TL;DR:** TSLA’s weekly surge + bullish options flow make \$370 calls a compelling play this week. Manage risk, watch volume, and aim for that 2x profit target!
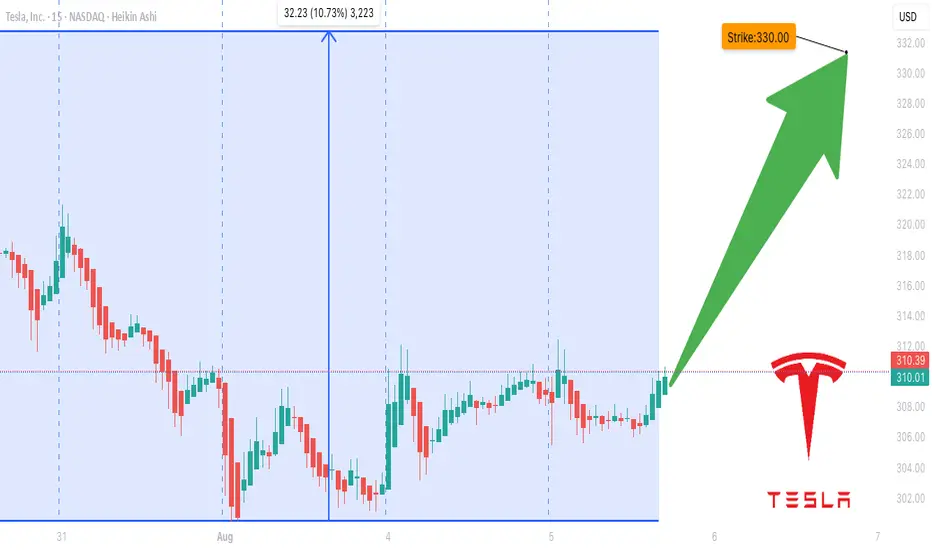
TSLA Don't Miss Out
### 🔥 TradingView Viral Post Format 🔥
---
### 📢 **Title:**
**TSLA Options Surge? \$330 Call Could Double in 3 Days — Here's the Setup** 🚀📈
---
### 📝 **Description:**
Tesla’s options market is flashing **moderate bullish signals** this week! 📊
✔️ Call/Put Ratio: **1.39** (Bullish)
✔️ RSI (Daily & Weekly): **Rising**
⚠️ Volume is light, but sentiment leans bullish.
🎯 **Trade Idea:**
Buy TSLA \$330 Call (Exp: Aug 8)
💰 Entry: \$0.85
🎯 Target: \$1.70
🛑 Stop: \$0.43
⏱️ Confidence: 65%
⚡ Gamma risk rising with time decay — tight execution is key.
Is this the breakout or a bull trap? Let’s watch it play out 👀
👇 Drop your thoughts or setups in the comments!
---
### 🏷️ **Tags (for TradingView):**
```
#TSLA #Tesla #OptionsTrading #CallOptions #BullishSetup #TSLAOptions #StockMarket #WeeklySetup #TradingStrategy #TechnicalAnalysis #TradeIdea #MomentumTrade #UnusualOptionsActivity #TradingView
TSLA Weekly Bearish Play — August 2, 2025
🔻 **TSLA Weekly Bearish Play — August 2, 2025** 🔻
🚨 **Multi-Model Consensus Signals a Tactical Put Opportunity**
### 🔍 Market Snapshot:
* **Daily RSI:** 39.9 (Bearish)
* **Weekly RSI:** 53.2 → Falling
* **Volume:** Weak (0.8x last week)
* **Options Flow:** Neutral (C/P Ratio \~1.04)
* **VIX:** 20.38 → Favorable for Options Plays
* **Institutional Support:** Weak
---
### 🔮 Model Consensus:
📉 **All major models (xAI, Google, Claude, Meta, DeepSeek)** confirm:
* Bearish momentum on both daily + weekly RSI
* Weak volume = cautious institutional behavior
* Volatility setup perfect for short-dated puts
---
### 🎯 Viral Trade Setup:
**💥 Trade Type:** PUT (Short TSLA)
**🔻 Strike:** \$300
**📆 Expiry:** 2025-08-08
**💰 Entry Price:** \$6.65
**🎯 Target Exit:** \$10.64 – \$13.30 (60%-100% gain)
**🛑 Stop Loss:** \$3.99
**📊 Confidence:** 65%
**📍 Entry Timing:** Monday open
**🕒 Signal Timestamp:** 2025-08-03 01:33:56 EDT
---
### ⚠️ Key Levels:
* Support to watch: **\$297.82**
* News/event risks: Stay alert ⚡
* Use tight risk controls for weekly plays!
---
🔥 **If you trade TSLA — don’t sleep on this one.**
Bearish consensus + clean setup = **high-probability weekly play.**

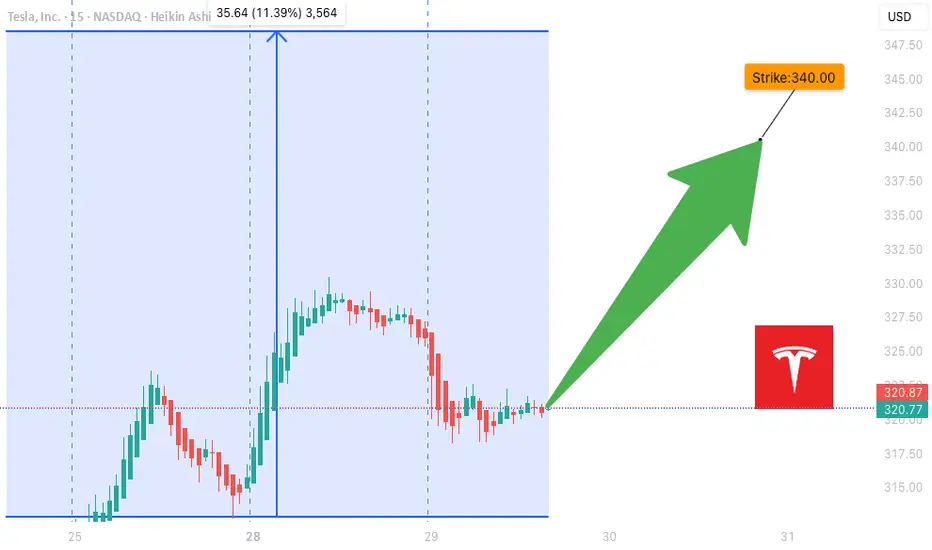
SLA Moderate Bullish Setup – Weekly Play for 08/01 Expiry
## ⚡ TSLA Moderate Bullish Setup – Weekly Play for 08/01 Expiry
🎯 *"Volume confirms it. RSI supports it. Time to strike—or stand by."*
---
### 🔍 Market Intelligence Snapshot:
📊 **Consensus**: Moderately Bullish
📈 **Weekly RSI**: Rising
📉 **Daily RSI**: Still Neutral (momentum building)
📉 **VIX**: Low → Great environment for call buying
📦 **Volume**: Strong institutional activity across models
---
### ✅ Recommended Trade Setup:
**TSLA \$340 CALL (Exp: Aug 1)**
💰 *Entry*: \~\$0.88
📈 *Target*: \$1.38
🛑 *Stop*: \$0.35
📆 *DTE*: 3 Days
🎯 *Entry*: Market Open
⚖️ *Confidence*: 65%
---
### 🔧 Model Blended Strategy Notes:
* Meta & Anthropic: Suggest ATM/ITM (\$327.50–\$330) → safer, higher cost
* Google & xAI: Prefer \$340–\$342.50 for a better risk/reward
* DeepSeek: Targets \$320 but with heavier premium
🧠 *Takeaway*: \$340 offers a balanced shot — affordable, but still responsive to upside flow.
---
### ⚠️ Risk Notes:
* ⏳ Time Decay → Quick exits = better outcomes
* 📰 External news or earnings reactions = watch for sudden volatility
* 🎯 Position size = keep light due to only 3 DTE
---
### 📊 TRADE SNAPSHOT (JSON):
```json
{
"instrument": "TSLA",
"direction": "call",
"strike": 340.0,
"expiry": "2025-08-01",
"confidence": 0.65,
"profit_target": 1.38,
"stop_loss": 0.35,
"size": 1,
"entry_price": 0.88,
"entry_timing": "open",
"signal_publish_time": "2025-07-29 10:16:14 UTC-04:00"
}
```
---
### 🧠 Quick Captions for Social:
* “TSLA bulls waking up? \$340C looks lit for the week 📈🔥”
* “Call volume surging. RSI rising. Low VIX. This \ NASDAQ:TSLA 340C might run 💥”
* “Risk-managed breakout shot — in and out fast 🎯”
TSLA WEEKLY OPTIONS SETUP
### 🚗 TSLA WEEKLY OPTIONS SETUP (2025-07-28)
**Big Call Flow. Low VIX. Can Bulls Hold \$325?**
---
📊 **Momentum Overview:**
* **Daily RSI:** 48.2 🔻 → *Neutral-to-Weak*
* **Weekly RSI:** 57.1 🔻 → *Still bullish zone, but falling*
⚠️ **Interpretation:** Momentum is softening, trend in question.
📉 **Volume Context:**
* **Volume Ratio:** 1.3x ⬆️ (vs. last week)
* **Price Change:** -0.77% despite that volume
🔍 *Distribution Alert:* Institutions may be selling into strength.
📈 **Options Flow:**
* **Call/Put Ratio:** **1.70** = 🚨 *Bullish flow confirmed*
* **Volatility (VIX):** 15.16 🟢 Favorable for directional plays
✅ Strong setup for options traders riding short-term momentum
---
### 🧠 **Weekly Sentiment Scorecard:**
* ✅ **Bullish Signals (2):** Options Flow, Volatility
* ⚠️ **Neutral Signals (2):** Daily & Weekly RSI
* ❌ **Bearish Signal (1):** Volume pattern = distribution risk
**Overall Bias:** 🟢 *Moderate Bullish*
---
### 🔥 **TRADE SETUP IDEA:**
🎯 **Strategy:** Long Call Option
* 📌 **Instrument:** TSLA
* 💵 **Strike:** \$355C
* 📅 **Expiry:** Aug 1, 2025
* 💸 **Entry:** \~\$0.75
* 🎯 **Profit Target:** \$1.50
* 🛑 **Stop Loss:** \$0.45
* 🔒 **Key Support to Watch:** \$327.50 — lose that = exit fast
📈 **Confidence Level:** 65%
⚠️ **Gamma Risk:** High → trade small, manage tight.
---
### 📦 TRADE\_DETAILS (JSON Format for Algo/Backtest):
```json
{
"instrument": "TSLA",
"direction": "call",
"strike": 355.0,
"expiry": "2025-08-01",
"confidence": 0.65,
"profit_target": 1.50,
"stop_loss": 0.45,
"size": 1,
"entry_price": 0.75,
"entry_timing": "open",
"signal_publish_time": "2025-08-01 09:30:00 UTC-04:00"
}
```
---
### 🧭 **Quick Notes for Traders:**
* ✅ Bulls have short-term edge — but **momentum is fading**
* ⚠️ If TSLA breaks below **\$325**, exit fast.
* 🔍 Watch for fakeouts: options flow is bullish, but volume says “not so fast.”
---
📊 TSLA \$355C → Risk \$0.75 to potentially double 📈
💬 Will this hold, or is it a bull trap before a dump? 👀
Comment below ⬇️ and follow for Monday updates!
---
**#TSLA #OptionsFlow #WeeklyTrade #TradingSetup #GammaRisk #AITrading #TeslaStock #UnusualOptionsActivity #SmartMoneyMoves**

Tesla Shares (TSLA) Drop Following Earnings ReportTesla Shares (TSLA) Drop Following Earnings Report
Yesterday, after the close of the main trading session on the stock market, Tesla released its quarterly earnings report. While both earnings per share (EPS) and gross profit slightly exceeded analysts’ expectations, the results reflected a negative trend driven by declining sales. This decline is being influenced by intensifying competition from Chinese EV manufacturers as well as Elon Musk’s political activity.
According to Elon Musk:
→ The company is facing “a few tough quarters” due to the withdrawal of electric vehicle incentives in the US;
→ The more affordable Tesla model (mass production expected in the second half of 2025) will resemble the Model Y;
→ By the end of next year, Tesla's financials should become "highly compelling".
Tesla’s share price (TSLA) fell by approximately 4.5% in after-hours trading, clearly reflecting the market’s reaction to the report. Today, the stock is likely to open around the $317 level, down from over $330 just the day before.
Technical Analysis of TSLA Stock Chart
In our analysis of TSLA charts dated 2 July and 8 July, we outlined a scenario in which the stock price could form a broad contracting triangle, with its axis around the $317 level.
The new candlesticks that have appeared on the chart since then have reinforced the relevance of this triangle, as the price rebounded from the lower boundary (as indicated by the arrow) and headed towards the upper boundary. However, yesterday’s earnings report disrupted this upward move.
Thus, while the broader stock market is trending higher (with the S&P 500 reaching a historic high yesterday), TSLA may remain "stuck" in a consolidation phase, fluctuating around the $317 level—at least until new fundamental drivers shift market sentiment.
This article represents the opinion of the Companies operating under the FXOpen brand only. It is not to be construed as an offer, solicitation, or recommendation with respect to products and services provided by the Companies operating under the FXOpen brand, nor is it to be considered financial advice.
TSLA Earnings Play (Bearish Bias)
🚨 TSLA Earnings Play (Bearish Bias) 🚨
Earnings Date: July 23, 2025 (AMC)
🧠 Confidence: 75% Bearish | 🎯 Target Move: -10%
⸻
🔍 Key Takeaways:
• 📉 TTM Revenue Growth: -9.2% → EV demand weakness
• 🧾 Margins Under Pressure: Gross 17.7%, Operating 2.5%, Net 6.4%
• ❌ EPS Beat Rate: Only 25% in last 8 quarters
• 🐻 Options Flow: High put volume at $330 strike
• 🧊 Low Volume Drift: Trading above 20/50MA but losing steam
• 📉 Sector Macro: EV competition + cyclical headwinds
⸻
🧨 Earnings Trade Setup:
{
"instrument": "TSLA",
"direction": "put",
"strike": 300,
"expiry": "2025-07-25",
"entry_price": 2.02,
"confidence": 75,
"profit_target": 6.06,
"stop_loss": 1.01,
"entry_timing": "pre_earnings_close",
"expected_move": 7.1,
"iv_rank": 0.75
}
⸻
🛠️ Trade Details:
Parameter Value
🎯 Strike Price $300 PUT
💰 Premium Paid $2.02
📅 Expiry Date 2025-07-25
🛑 Stop Loss $1.01
🚀 Profit Target $6.06
📏 Size 1 Contract
⏱ Entry Timing Pre-Earnings
📊 IV Rank 75%
🕒 Signal Time 7/23 @ 14:14 EDT
⸻
📈 Strategy Notes:
• 🧯 IV Crush Risk: Exit within 2 hours post-earnings
• 🎲 Risk/Reward: 1:3 setup | Max Loss: $202 | Max Gain: $606+
• 🧭 Volume Weakness & put/call skew signal downside
• 🧩 Macro + Tech + Flow Alignment = Tactical bearish play
⸻
🧠 “Not all dips are worth buying — this might be one to short.”
📢 Drop your thoughts — would you take the trade or fade it?

$TSLA Weekly Call Play – 07/22/25
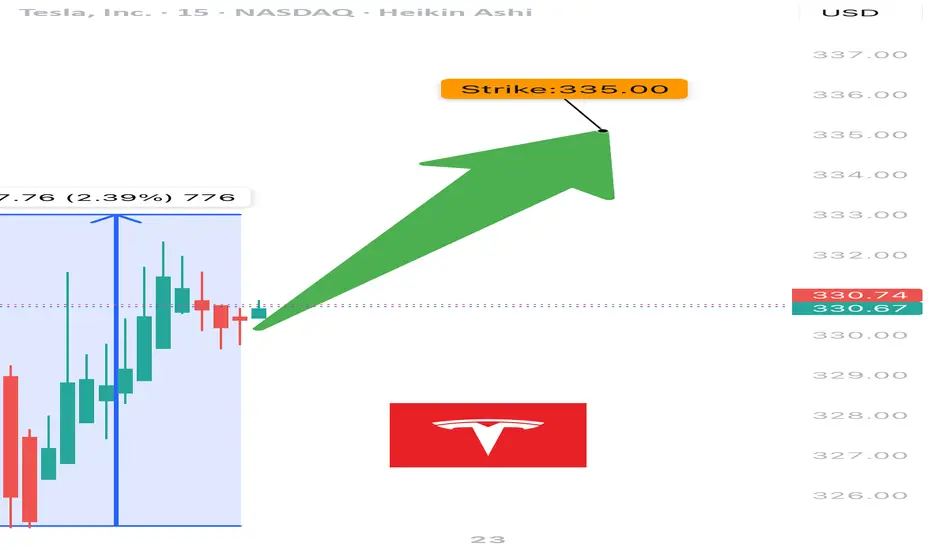
🚀 NASDAQ:TSLA Weekly Call Play – 07/22/25
RSI Bullish 📈 | Options Flow Strong 🔁 | Volume Weak 💤 | 3DTE Tactical Entry
⸻
📊 Market Snapshot
• Price: ~$332–335 (spot near strike)
• Call/Put Ratio: 🔁 1.24 – Bullish Flow
• Daily RSI: ✅ 57.6 – Rising momentum
• Weekly RSI: ⚠️ 54.8 – Neutral / flattening
• Volume: ❌ Weak – Institutional absence
• Gamma Risk: ⚠️ Moderate (DTE = 3)
• VIX: ✅ Favorable
⸻
🧠 Trade Setup
{
"Instrument": "TSLA",
"Direction": "CALL",
"Strike": 335.00,
"Entry": 9.90,
"Profit Target": 15.00,
"Stop Loss": 6.00,
"Expiry": "2025-07-25",
"Confidence": 0.65,
"Size": 1,
"Entry Timing": "Open"
}
⸻
🔬 Sentiment Breakdown
Indicator Signal
📈 Daily RSI ✅ Bullish – confirms entry
📉 Weekly RSI ⚠️ Flat – no long-term edge
🔊 Volume ❌ Weak – no institutional bid
🔁 Options Flow ✅ Bullish (C/P = 1.24)
💨 VIX ✅ Favorable for upside trades
⏳ Gamma Decay ⚠️ High risk (3DTE)
⸻
📍 Chart Focus
• Support Zone: $328–$330
• Breakout Watch: $335+
• Target Zone: $340–$345
• ⚠️ Risk Watch: Volume divergence + gamma decay on low move
⸻
📢 Viral Caption / Hook (for TradingView, X, Discord):
“ NASDAQ:TSLA bulls flash 335C with confidence, but volume’s asleep. RSI’s in, gamma’s ticking. 3DTE lotto with caution tape.” 💥📉
💵 Entry: $9.90 | 🎯 Target: $15.00+ | 📉 Stop: $6.00 | ⚖️ Confidence: 65%
⸻
⚠️ Who This Trade Is For:
• 🔁 Options traders chasing short-term call flows
• 📈 Momentum scalpers riding RSI pop
• 🧠 Disciplined risk managers eyeing 3DTE setups
⸻
💬 Want a safer bull call spread (e.g., 330/340) or risk-defined iron fly for theta control?
Just ask — I’ll build and optimize it for you.
TSLA WEEKLY TRADE IDEA – JULY 21, 2025
🚀 TSLA WEEKLY TRADE IDEA – JULY 21, 2025 🚀
🔔 Bullish Play, But Handle With Caution 🔔
Models split, but momentum wins (for now)…
⸻
📈 Trade Setup
🟢 Call Option – Strike: $332.50
📆 Expiry: July 25, 2025 (Weekly)
💰 Entry: $11.05
🎯 Target: $22.11 (100% Gain)
🛑 Stop: $5.53 (50% Loss)
🕰️ Entry Time: Monday Open
📊 Confidence: 65% (Moderate)
⸻
🧠 Why This Trade?
✅ RSI trending bullish on both daily + weekly
⚠️ Weak volume & bearish options flow (C/P ratio > 1)
📉 Institutions may be hedging into earnings
🌪️ Earnings risk looms – volatility expected
📉 Some models say no trade – we say: controlled risk, tight leash
⸻
🧨 Strategy:
🔹 Single-leg naked call only
🔹 Avoid spreads due to IV & potential gap risk
🔹 Scale out if gain >30% early-week
🔹 CUT FAST if volume + price diverge
⸻
🔥 Quick Verdict:
Momentum > fear, but don’t ignore the smoke.
TSLA 332.5C — Risk 1 to Make 2+
Ready? Let’s ride the wave 📊⚡
#TSLA #OptionsTrading #CallOption #TradingSetup #WeeklyTrade #EarningsSeason #MomentumPlay #TradingViewIdeas #SwingTrade #SmartMoneyMoves

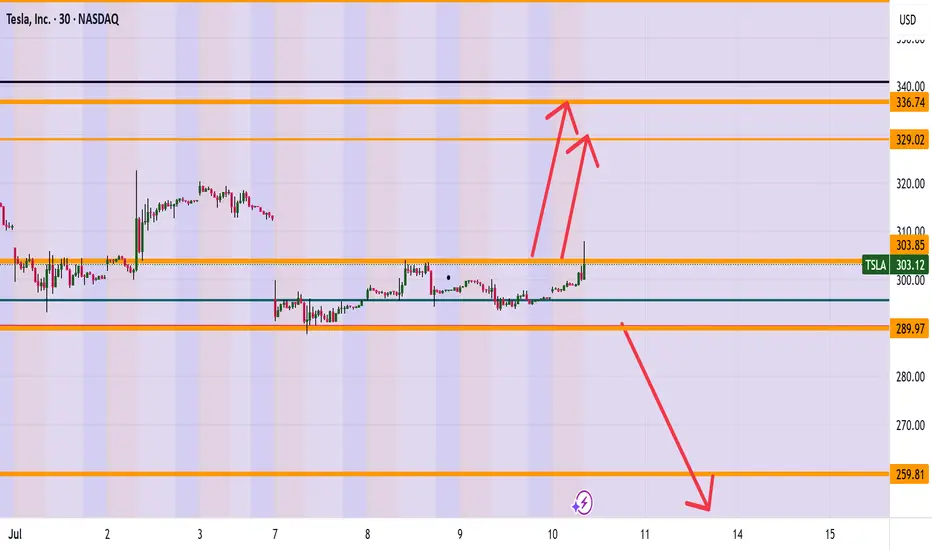
TESLA (TSLA) ARE WE HEADING TO 336? Morning Folks
It appears we are trying to break the highs of 304 and if we are successful a nice range up to 327-336 makes sense. However be careful if sink back down under 289 which then can see levels of 259 getting hit.
What are your thoughts on Tesla? Put in the comments section below
Kris Mindbloome Exchange
Trade Smarter Live Better
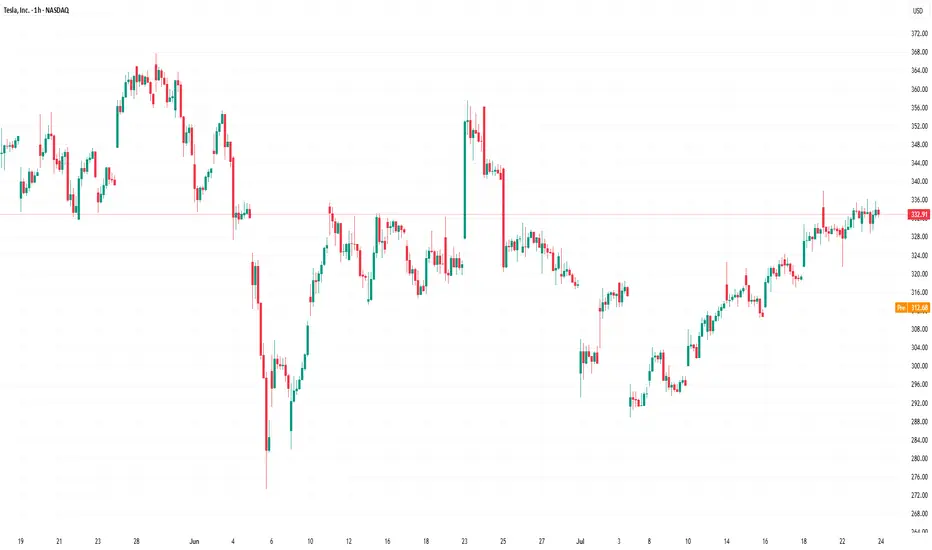
Tesla (TSLA) Shares Rebound After Sharp DropTesla (TSLA) Shares Rebound After Sharp Drop
When analysing the Tesla (TSLA) stock price chart six days ago, on the morning of 5 June, we:
→ highlighted Elon Musk’s critical comments regarding the spending bill promoted by the US President;
→ noted that a potential rift between Musk and Trump could have long-term implications, including for TSLA shares;
→ outlined an ascending channel (marked in blue);
→ suggested that the price might correct from the upper to the lower boundary of the channel.
This scenario played out rather aggressively: later that same day, during the main trading session, Tesla’s share price dropped sharply to the lower boundary of the channel amid a scandal involving Musk and Trump.
However, the lower boundary of the channel predictably acted as support. Yesterday, TSLA shares were among the top five performers in the S&P 500 index (US SPX 500 mini on FXOpen), gaining around 5.6%.
As a result, TSLA stock price climbed back above the psychologically important $300 mark, recovering from the previous week’s sell-off.
Why Are Tesla (TSLA) Shares Rising?
Bullish drivers include:
→ The upcoming launch of Tesla’s robotaxi service, provisionally scheduled for 22 June. Elon Musk has stated he intends to use the service himself.
→ Easing of tensions with the US President. Donald Trump declared that he has no intention of "getting rid of Tesla or Starlink" should he return to the White House.
→ Continued support from Cathie Wood, the prominent asset manager, who once again reaffirmed her confidence in Tesla’s future success.
Technical Analysis of TSLA Chart
Today, TSLA’s share price is hovering near the median line of the previously identified ascending channel – a zone where supply and demand typically seek equilibrium.
Also worth noting is the $320 level: in May, it acted as support, which suggests it may now function as resistance.
Given these factors, it is reasonable to expect that the sharp recovery from the 5 June low may begin to lose momentum, with the price likely to stabilise and form a consolidation range following the recent spike in volatility.
This article represents the opinion of the Companies operating under the FXOpen brand only. It is not to be construed as an offer, solicitation, or recommendation with respect to products and services provided by the Companies operating under the FXOpen brand, nor is it to be considered financial advice.

Bullish on TSLA if its stay above 290$ USD**INDICATOR SAY BULL🚀 TESLA (TSLA): The Ultimate Showdown – Bullish Surge or Bearish Collapse? 🚀
Tesla (TSLA) has all eyes locked on it , standing at a crossroads that could dictate its next explosive move. Hovering at $295.14 USD , it’s holding onto the crucial $290 USD support level , a make-or-break zone that could either ignite a spectacular rally or trigger a sharp decline.
🔥 Bulls Are Ready to Take Off: If Tesla defends $290 USD , it’s GAME ON. This level acts as a launchpad—a pressure point where accumulation fuels momentum, setting the stage for a surge toward $460 USD. Investors, traders, and market enthusiasts are all watching for this breakout moment, knowing that breaching higher resistance could spark an avalanche of buy orders. Tesla’s chart suggests a brewing storm of demand, one that could shatter expectations and push the stock into new highs.
⚡ Bears Are Lurking in the Shadows: But danger is never far away. A slip below $290 USD could signal the end of bullish dominance, dragging TSLA into a downward freefall toward $220 USD or even $200 USD . This break would suggest weakening momentum, market hesitation, and potential large-scale selling pressure. Bears will seize the opportunity, forcing Tesla into a recalibration phase—one that could reshape investor sentiment for weeks to come.
🔥 Tesla’s Next Move? A Market-Defining Moment! 🔥
This isn’t just another stock movement—it’s a battle between fear and ambition, bulls and bears, excitement and caution. Tesla is standing on the edge of innovation and volatility, making its current price action one of the most thrilling showdowns in the market today.
Will it skyrocket toward greatness , or will the bears drag it down?
Whatever happens next, one thing is certain— this ride will be unforgettable . Buckle up! 🚀⚡🔥
Let me know if you want even more refinements or additional angles! 😎🔥
Subscribe for more!

TSLA cooling offI know Tesla lovers hate to see a short post on the stock. Okay... it's cooling off... lol.
*another news report states he's leaving gov't; trump holding on tight... we shall see
*alleged new growth story incoming... check news and see what you see
*TA (technical analysis) look like a pullback in order... 330-325
Do you see what I see? Or you are feeling like it's a straight moon shot?
Have a great weekend.

TSLA A.M. Dump IdeaHere is a bearish imuplse at close breaking structure to the downside creating a sell opportunity if price retraces back to the arrow. Simple Idea.

Tesla Stock: Neutral Bias Persists Following Earnings ReportTesla’s stock is currently hovering near the $250 level, after a bullish gap formed following the release of its latest earnings report. Initially, the company's results fell short of expectations: earnings per share came in at $0.27 versus the expected $0.39, and total revenue reached $19.3 billion versus $21.11 billion anticipated by the market. Despite this, the stock's initial reaction was a bullish gap, fueled by brief, fleeting optimism, but the session ultimately closed with a notable indecision candle, casting some doubt on whether a new short-term uptrend is truly beginning.
Bearish Channel Remains in Play:
Despite the recent upward jump in the latest session, buying momentum has so far failed to break through the upper boundary of the descending channel that has persisted since late December. For now, this bearish channel remains the most important formation to monitor, based on recent price behavior.
MACD:
The MACD histogram is currently oscillating close to the neutral zero line, indicating that the average strength of the recent moving average swings remains largely neutral. If this behavior continues, the market may lack a clear short-term trend.
ADX:
The ADX indicator is showing a similar setup. The line continues to hover around the 20 level, which typically signals indecision in the market. This reflects a neutral tone in the current price movement, suggesting that a lack of momentum is driving a series of directionless swings. Unless the ADX line starts to rise steadily, a neutral bias may continue to dominate the stock in the short term.
Key Levels:
$220 – Key Support: This level marks the lowest point in recent months. A break below this support could reactivate the bearish channel that has defined short-term price action.
$290 – Technical Barrier: Aligned with the 200-period simple moving average, a bullish breakout above this level could pose a serious threat to the current bearish trend channel.
$330 – Final Resistance: This level is aligned with the 100-period simple moving average. If the stock reaches this area, it could confirm a shift in market momentum and pave the way for a more sustained bullish trend on the chart.
Written by Julian Pineda, CFA – Market Analyst

TSLA Setting Up for the Next Big Move?🚘Tesla's been cooking up some serious price action — and now it’s getting interesting. After holding above key supports, bulls might be eyeing their next shot. Here’s the plan I’m watching:
📥 Entry zones:
• 240 (aggressive)
• 215 (ideal support zone)
• 195 (deep discount territory)
🎯 Profit targets:
• 265
• 290
• 355+ (if momentum takes off)
TSLA has been showing signs of accumulation — and if buyers step in near 215–195, we could be looking at the early stages of a powerful move. Of course, nothing is guaranteed. The EV space is competitive, and macro volatility can flip the script fast.
🔍 Keep an eye on volume, trend confirmations, and news that could push sentiment one way or the other.
⚠️ Disclaimer: This is not financial advice. Just sharing my personal analysis and trade idea. Always do your own research and manage risk according to your own strategy.
