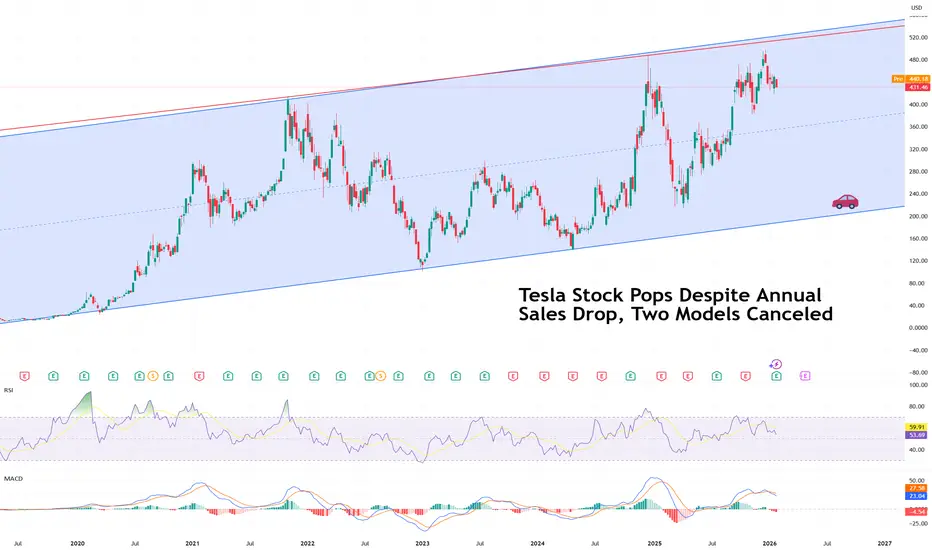
Tesla Stock Pops Despite Annual Sales Drop, Two Models CanceledTesla stock NASDAQ:TSLA managed a modest pop pre-market Thursday, rising about 3%, even as the company delivered a quarter that, on the surface, looked anything but celebratory.
Profits slid. Revenue dipped. Vehicle sales declined. Two iconic models were sent quietly into retirement. And yet, the stock bounced. Welcome to Tesla earnings season.
📉 Profits Fall, Reality Bites
Tesla reported a 61% drop in fourth-quarter profit, underscoring how much tougher the EV business has become. Revenue fell 3% in the quarter to $24.9 billion, bringing full-year 2025 revenue to $94.8 billion, also lower by 3% from the prior year.
EV sales dropped 16% year over year in Q4, and total vehicle deliveries for 2025 came in at 1.64 million, a 9% annual decline. That left Tesla trailing China’s BYD HKEX:1211 , which sold 2.26 million EVs last year and is now firmly wearing the global volume crown.
For a company that once defined EV dominance, this was a clear reminder that the market has caught up.
🏭 The End of an Era
Perhaps the most symbolic announcement came from Elon Musk himself. Tesla is ending production of the Model S and Model X, the premium vehicles that once represented the brand’s technological edge.
Sales have lagged behind Tesla’s mass-market models, and the economics no longer worked. “It’s time to basically bring the Model S and X programs to an end with an honorable discharge,” Musk said.
The Fremont factory space previously used for those vehicles will now be repurposed to manufacture Optimus humanoid robots, Musk said.
That decision alone tells you a lot about where Tesla believes its future lies. But also raises the question: New frontier or the perfect short entry?
🤖 From EV Maker to AI Builder
Tesla’s pivot toward artificial intelligence moved from abstract ambition to concrete capital this quarter. The company disclosed a $2 billion investment in xAI, Musk’s private AI startup, as part of its Series E funding round.
The move raised eyebrows, especially since Tesla shareholders had previously voted down a proposal to invest in xAI, with more “no” votes and abstentions than approvals. Tesla went ahead anyway.
SpaceX, which is eyeing a public listing in June, also committed $2 billion to xAI, reinforcing Musk’s push to build a vertically integrated AI ecosystem spanning cars, robots, rockets, and data.
Musk framed the effort as part of a broader mission. “There’s still obviously many who doubt our ambitions for creating amazing abundance,” he told investors, “but we’re confident it can be done.”
💸 Cash Flow Holds the Line
Despite the profit slump, Tesla delivered a small surprise where it mattered most to skeptics: cash flow.
Free cash flow came in at $1.4 billion, down 30% year over year but well ahead of analyst expectations, which had pointed to negative free cash flow. That cushion gives Tesla room to keep spending on AI and robotics without immediately stressing the balance sheet.
The company is clearly choosing to invest aggressively rather than defend margins, a decision that markets appear willing to tolerate, at least for now.
🚕 Cybercab Still on the Roadmap
Tesla also reiterated plans to begin production of Cybercab , its fully autonomous two-seater with no steering wheel or pedals, in April.
The vehicle remains one of the boldest expressions of Musk’s vision for an AI-first transportation future. It is also one of the least proven. Regulation, autonomy reliability, and consumer acceptance remain open questions.
Still, for investors inclined to think in decades rather than quarters, Cybercab represents optionality. For skeptics, it represents yet another promise waiting to be tested.
🌍 Competition Gets Real
Tesla’s challenges are no longer hypothetical. The EV market is crowded, price-sensitive, and increasingly competitive. Chinese manufacturers continue to scale aggressively. Government subsidies that once fueled demand are fading. Tesla’s lineup is aging faster than its innovation cycle can refresh it.
Musk’s strategy appears clear. EVs remain important, but they are no longer the center of gravity. AI, robotics, and autonomy now sit at the core of Tesla’s long-term story.
That pivot, however, comes with execution risk. Tesla still has to sell cars in the meantime, and margins remain under pressure.
🐻 The Bear Case Gets Louder
Not everyone is buying the vision. Veteran investor George Noble, former director at Fidelity International and founder of two hedge funds, has emerged as one of Tesla’s most vocal skeptics.
Speaking to Business Insider last week, Noble described Tesla as “possibly the biggest bubble in stock market history,” arguing that the stock is deeply disconnected from fundamental valuation.
What’s more, he believes shares should trade between $60 and $140, implying a potential drop of as much as 80% from recent levels.
In his view, Tesla remains primarily a car company with speculative upside attached, rather than an AI platform deserving of tech-multiple valuations.
📊 A Stock Caught Between Two Stories
That tension defines Tesla today. On the one side sits a slowing $1.4 trillion EV business facing global competition and margin compression. On the other stands an ambitious AI and robotics narrative that has yet to generate meaningful revenue.
The market’s reaction suggests investors remain willing to give Musk time, especially after they approved a hefty $1 trillion pay package . Tesla shares are still about 13% below their record high.
Peak earnings season continues with Apple NASDAQ:AAPL reporting after market close today.
Off to you : Where do you land? Do you believe Tesla’s pivot toward AI and robotics marks the start of a new chapter, or do you think gravity eventually reasserts itself and pulls the stock back to earth?
Tslastock
TSLA: Historical Gigantic Triangle Breakout, Next 200% in Sight!Hello There,
Welcome to my new analysis about the Tesla stock (TSLA). On the broader and global timeframe perspective, this stock is sending huge and historical signals that should not be underestimated. TSLA is continuously within this major uptrend from where it always had the ability to form new higher highs after the others. Now, TSLA is surging higher into the next spheres. Such price action is indicating massive events likely to follow through in 2026.
As when looking at my chart, we can see there that TSLA already broke out above the upper boundary of this gigantic triangle formation. Such a formation is, in a high number of cases, marking the starting point of a huge expansion towards the upside. Especially as TSLA already completed the wave count within the triangle formation, this is marking a huge confirmation of this gigantic formational structure.
As it is seen within my chart, TSLA is now building up above the upper boundary of this giant formation and is setting up the next bullish setup from where the next phases of the bull run are likely. There are also underlying factors supporting this trend, such as the 100-EMA and 50-EMA. As this uptrend is going on, TSLA has major supports here. From this level, the next bounces are highly likely. Currently the bullish setup is already building up, and a continuation should be expected.
Also, TSLA had the ability to expand their China business massively. Such a gigantic market is likely to boost sales, which in turn is bullish for the underlying stock. This dynamic is also attracting a lot of investors and whales to further move into this stock. It will be fascinating to see this dynamic expand in the upcoming times and how the actual market sets up further dynamics for the price action.
Technically, TSLA is already confirming the next major 200% move. As this whole formation has been completed, this is already the cornerstone of confirmation in this whole structure. Considering such a dynamic, there is a high likelihood that TSLA won't reverse or get stuck within the whole structure. It is important that TSLA stay above the upper boundary of the triangle. As long as this is the case, the next expansionist move is likely to happen soon.
With this being said, it is great to consider the important trades upcoming.
We will watch out for the main market evolutions.
Thank you very much for watching!

Tesla Stock Holds Strength and Breaks Above Yearly HighsTesla’s stock has achieved a streak of three consecutive bullish sessions, recording a gain of more than 5% over that period. For now, buying pressure has remained firm following recent announcements indicating that the company has confirmed unsupervised robotaxi testing, a development that could mark a significant milestone in Tesla’s autonomous vehicle program and become a project with major long-term impact. This announcement has reinforced confidence in the stock in recent sessions and may continue supporting consistent buying pressure in the coming days.
Long-Term Uptrend Remains Intact
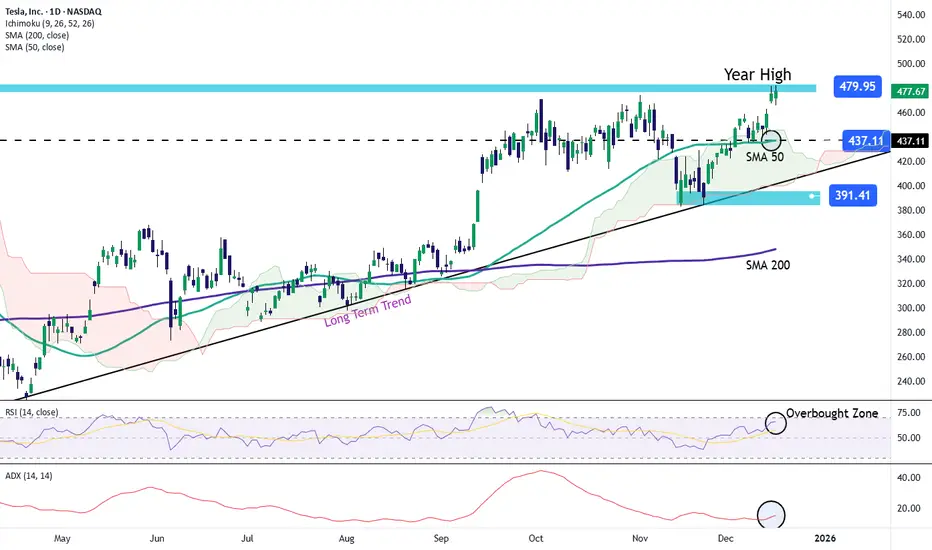
It is important to remember that Tesla’s bullish movements have maintained a consistent upward trend since April of this year. In recent sessions, buying pressure has strengthened again, even pushing the price toward the 480-dollar zone — a level not seen consistently since December 2024.
If buying pressure remains stable in the short term, the long-term uptrend could continue dominating Tesla’s price action toward year-end. However, it is also important to consider that confronting current highs may create room for short-term bearish corrections.
RSI
At the moment, the RSI line continues to oscillate above the neutral 50 level, indicating that buying momentum still dominates short-term price action. However, the RSI is now approaching the overbought zone (70), which may signal a potential imbalance in momentum and open the door for short-term pullbacks.
ADX
The ADX line remains below the 20 level, suggesting a period of neutrality in average volatility over the last 14 sessions. This indicates that unless a stronger directional move occurs in the short term, a phase of persistent indecision may continue, potentially leading to temporary bearish corrections.
Key Levels to Watch:
480 dollars – Crucial resistance:
A level not seen since 2024 and a major high for 2025. Sustained buying above this level could reinforce the bullish bias and potentially push the price toward the psychological 500-dollar mark.
437 dollars – Nearby support:
This level aligns with the 50-period moving average and may act as initial support should short-term bearish corrections occur.
391 dollars – Final support:
This level corresponds to recent lows. A pullback toward this zone could reactivate a bearish bias and put the current bullish structure at risk.
Written by Julian Pineda, CFA, CMT – Market Analyst
Is Tesla Setting Up for a Rebound? Key Entry Levels Inside🎯 TSLA: The "Thief Strategy" Playbook | Swing/Day Trade Setup 📈
🔥 Quick Overview
Asset: Tesla, Inc. (TSLA)
Bias: 🐂 BULLISH
Strategy Type: Thief Layering Entry Method
Risk Level: Medium-High (Swing/Day Trade)
💰 The "Thief" Entry Strategy Explained
The "Thief Strategy" uses multiple limit orders (layering method) to accumulate position at different price levels. Think of it like setting traps at various floors of a building—you catch opportunities wherever price decides to visit! 🎣
📊 Entry Zones (Layer Your Orders):
Layer 1: $430.00
Layer 2: $435.00
Layer 3: $440.00
💡 You can add more layers based on your own risk appetite and account size. The beauty of layering? You average your entry and reduce timing risk!
🛡️ Stop Loss (SL):
Thief SL: $415.00
⚠️ Important Note: This is MY stop loss level based on the Thief Strategy framework. You're the captain of your own ship! 🚢 Adjust your SL based on YOUR risk tolerance and account management rules. Trade at your own risk—make money, take money, manage wisely!
🎯 Target (TP):
Primary Target: $490.00
🚨 Why $490? This zone represents a confluence of:
Strong resistance area
Potential overbought conditions
Historical trap zone where bulls get exhausted
📢 Thief OG's Reminder: I'm NOT saying you MUST take profit only at my TP level. If you see profits that make you smile, SECURE THEM! 💵 The market gives, and the market takes. Be greedy when you can, be smart always.
🔍 Technical Analysis Breakdown
Tesla is showing bullish momentum structure with potential for continuation toward the $490 resistance zone. The layering strategy allows us to build position as price potentially dips into demand zones before the next leg up.
Key Technical Levels:
Support Zone: $430-$440 (Our entry layers)
Invalidation: Below $415 (Stop loss)
Resistance Target: $490
📌 Related Pairs to Watch (Correlation Play)
Understanding correlated assets helps confirm your thesis:
AMEX:SPY (S&P 500 ETF)
TSLA often moves with broader market sentiment
Watch SPY for overall risk-on/risk-off environment
NASDAQ:QQQ (Nasdaq 100 ETF)
Tech-heavy index where TSLA is a major component
Strong correlation with TSLA price action
NASDAQ:NVDA (NVIDIA)
Both are high-beta tech growth stocks
Often move together during risk appetite shifts
TVC:DXY (US Dollar Index)
Inverse correlation: Strong dollar = pressure on growth stocks like TSLA
Weak dollar = tailwind for equities
💡 Key Point: If SPY/QQQ are bullish + DXY weakening = Strong confirmation for TSLA upside!
⚡ Trading Tips for Thief OG's
Don't FOMO — Let price come to your layers
Manage position size — Each layer should be equal weight
Trail your stop — Once profitable, protect gains
Watch volume — Confirm breakouts with volume spikes
Stay flexible — Market conditions change; so should you!
🎬 Final Words
This setup is all about patience, precision, and profit extraction! 🎯 The Thief Strategy isn't about stealing from the market—it's about being SMART and setting yourself up for success with calculated entries.
Remember: The best trades are the ones where you're prepared, not scared! 😎
✨ If you find value in my analysis, a 👍 and 🚀 boost is much appreciated — it helps me share more setups with the community!
#TSLA #TeslaStock #SwingTrading #DayTrading #ThiefStrategy #LayeringStrategy #StockMarket #TradingIdeas #TechnicalAnalysis #BullishSetup #TradingStrategy #RiskManagement #StockTrading #MarketAnalysis #TradingCommunity

Tesla Stock Lifts 2025 Gains to 20% as Traders Eye Santa RallyA megacap squeezing in one more rally before year-end? Yes, please.
🚗 A Holiday Glide Higher for Tesla Shares
Tesla NASDAQ:TSLA is heading into December with solid momentum. Coming into Monday, the stock has risen 20% since January, putting it on track for a third straight annual gain .
Investors will gladly take it. Tesla isn’t exactly a low-volatility cuddle toy — this is a stock that fell 65% in 2022, then turned around and doubled in 2023, then tacked on another 63% in 2024.
Still, the long arc is impressive: since Tesla's 2010 IPO, the stock has only posted annual declines twice — in 2016 and that infamous crash year of 2022. This year’s 20% gain looks tame by Tesla standards, but context matters: tame is good.
🎅 Santa Rally Season: Will Tesla Join the Party?
This is the time of year when traders start looking for that special year-end swing called Santa rally.
Fortunately, December has been good to Tesla shares. Really good. The stock has risen in more than half of all Decembers since its flotation 15 years ago, with nine monthly gains and six declines over its life as a public company.
Why does the Santa rally happen?
• Some say it’s psychology: investors in a good mood tend to buy.
• Some say it’s portfolio managers smoothing out their year-end reports.
• Others point to tax strategies, retail flows, or just holiday optimism.
No one really knows — which makes it the perfect market myth. But if Santa does show up this year, Tesla benefits. A few cheerful sessions could be enough to lock in another positive annual finish.
Just don’t confuse December with easy money. Historically, it’s just as volatile as every other month — and sometimes worse.
🔥 When December Isn’t So Jolly
Want a reminder that Tesla can rewrite the script in both directions? Look no further than December 2022, when the stock plunged 37% in a single month.
Back then, investors worried CEO Elon Musk’s bold acquisition of Twitter (now X) was consuming far too much of his attention — at the cost of Tesla’s market cap.
The 2025 backdrop is far calmer. Today’s concerns are more traditional Tesla fare:
• How many cars will it deliver?
• What will margins look like?
• Is the growth runway intact?
• What type of robots will Elon talk about on the next call?
December can still swing.
📦 Deliveries: The Real Catalyst on Deck
But traders love a year-cap rally. Even more so when there’s something to bet on.
Expectations for Tesla’s Q4 2025 deliveries sit between 507,000 and 512,000 vehicles, a number that would help confirm a steady, if not explosive, growth narrative.
More importantly, full-year 2025 deliveries are projected to exceed 2 million units, aligning with Elon Musk’s long-term growth target of 20–30% year-over-year production.
In Tesla’s world, hitting numbers is the difference between “Tesla has momentum” and “Tesla is broken again.”
That means Q4 data — arriving Thursday, January 1 or Friday, January 2, 2026 — will be key for this year’s narrative. The numbers drop early in the morning while everyone is still recovering from celebrations, and suddenly your phone buzzes with either joy or existential dread.
Earnings are a big factor, too. The next report date, as per the earnings calendar , is set for January 28.
🎁 The Takeaway: A Rally Within Reach
Tesla’s 20% gain in 2025 looks solid heading into the final stretch, and seasonality is on its side.
• December tends to be kind.
• Santa rallies tend to lift boats.
• Analysts are optimistic about deliveries.
• The stock has historical resilience.
But this is still Tesla — a stock with a personality, a fanbase, a fierce opposition , and a volatility profile that can make your stomach churn.
Off to you : How do you see Tesla stock performing in December? Share your views in the comments!

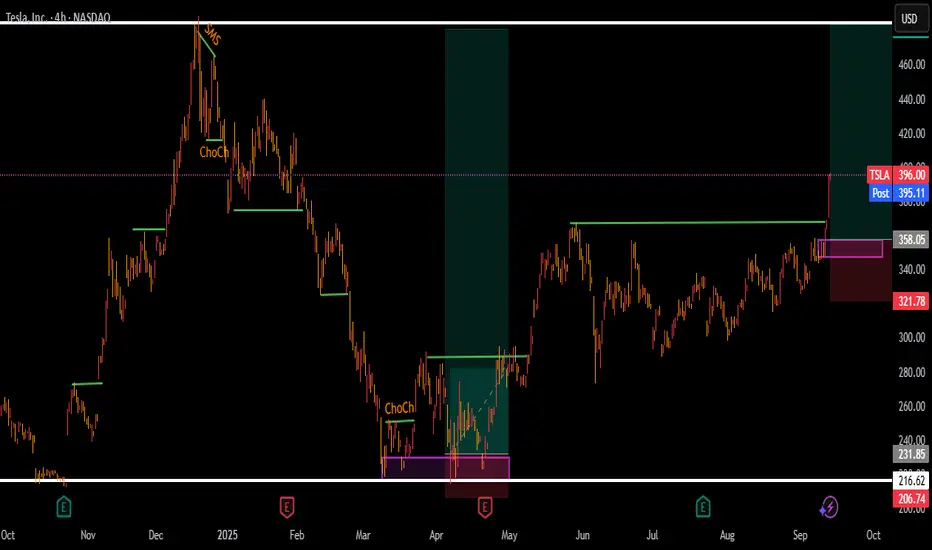
TESLA BIG SELL PROBABILITY SETUP SOON!!!🚨 TESLA HIGH PROBABILITY SELL SETUP 🚨
* Here We Can See Clearly The Next Potential Moves For TSLA Coming Hours/Days.
* Keep Your Eyes Close On Your Trading Positions.
* Happy PIP Hunting Traders.
FXKILLA.

TESLA HIGH PROBABILITY SETUPS SOON!!!🚨 TESLA HIGH PROBABILITY SELL/BUY SETUPS 🚨
* Here We Can See Clearly The Next Potential Move For TSLA Coming Hours/Days.
* Keep Your Eyes Close On Your Trading Positions.
* Happy PIP Hunting Traders.
FXKILLA.
Tesla (TSLA) Share Price Rises Ahead of Earnings ReportTesla (TSLA) Share Price Rises Ahead of Earnings Report
On 16 September, we noted signs of a strong market for Tesla (TSLA) shares, including:
→ The price remaining above the psychological level of $400;
→ Reaching the highest levels since late January.
We also identified an ascending channel and suggested that the long-term outlook remained optimistic, although a correction could not be ruled out.
Since then, TSLA shares have stabilised near the upper boundary of the channel, holding above the $400 level. On Friday, they were among the market leaders, rising by more than 4%. This brings the gain since the start of September to around +30%.
Why Are TSLA Shares Rising?
Key factors supporting a bullish outlook include:
→ Sentiment ahead of the quarterly Production and Deliveries report, expected this week. According to recent forecasts, actual figures could exceed expectations (although still showing a decline compared to the previous year).
→ Target price upgrades. Dan Ives of Wedbush, one of Tesla’s most prominent bulls, last week raised his target price to $600 — the highest on Wall Street — citing substantial potential in AI and robotaxi development.
→ The “Musk factor”: Discussions around Elon Musk stepping away from politics are seen as a long-term positive driver.
Technical Analysis of TSLA Shares
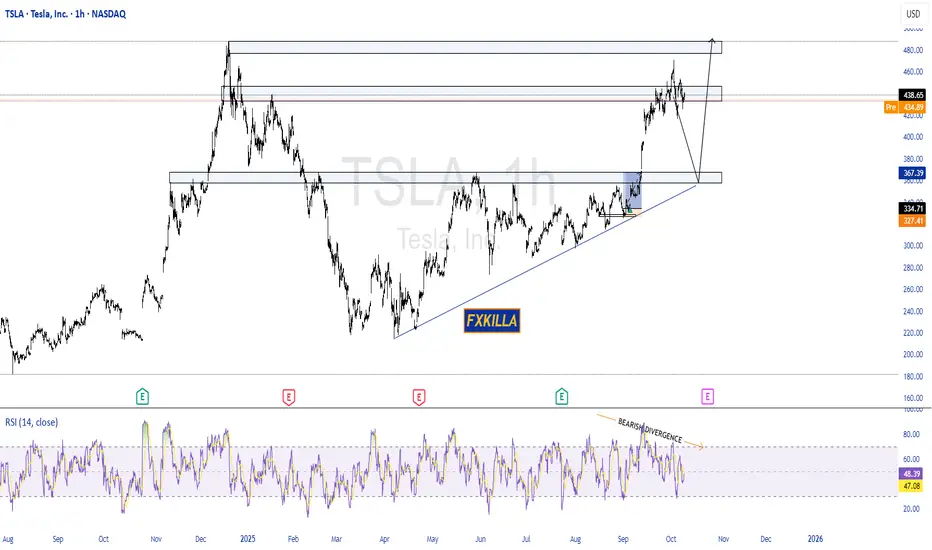
The ascending channel remains intact. However, the chart suggests that the upper boundary now acts as resistance — unsurprising given the exceptional gains in September (noting that TSLA’s price has doubled since its yearly low). A slowdown in momentum is signalled by a bearish divergence on the RSI indicator.
Resistance at the upper boundary is further reinforced by a strong bearish reversal from late 2024. A similar pattern was recently observed when the price struggled to break above the bearish reversal zone at $345–355, resulting in an extended sideways movement in August and early September.
By analogy, the $445–465 zone may also act as resistance — meaning a correction remains a plausible scenario. For example, TSLA stock price could pull back to test the psychological $400 level, which is supported by the median of the current channel.
This article represents the opinion of the Companies operating under the FXOpen brand only. It is not to be construed as an offer, solicitation, or recommendation with respect to products and services provided by the Companies operating under the FXOpen brand, nor is it to be considered financial advice.

Tesla (TSLA) Stock Price Rises Above $400Tesla (TSLA) Stock Price Rises Above $400
As the chart shows, Tesla (TSLA) stocks are displaying strong market momentum. In particular, the price:
→ is above the psychological level of $400;
→ has reached its highest levels since late January;
→ has gained around 25% since the beginning of September.
Why Is TSLA Rising?
The main news driving the price surge was a media report that Elon Musk had purchased $1 billion worth of Tesla stock. The market interpreted this as commitment and confidence in the company’s future from its founder, which sharply increased demand for the shares.
Other factors contributing to TSLA’s rise include:
→ Expectations of a Federal Reserve interest rate cut to stimulate the economy. This makes growth stocks such as Tesla more attractive to investors.
→ Reduced tensions between Elon Musk and President Trump’s administration. This removes some of the political risks that had weighed on the stock.
Technical Analysis of TSLA Stock
In our August analysis of the TSLA chart, we:
→ noted that the price had broken through the upper boundary of a broad contracting triangle with its axis around $317;
→ suggested that a correction might follow after the rally in early August.
Since then:
→ the price made a minor pullback before reversing upwards (as shown by the arrow);
→ the bullish trend resumed, providing anchor points to construct a rising (blue) channel.
Thus, the chart confirms:
→ a shift in sentiment in favour of buyers;
→ an improving fundamental backdrop (as highlighted in the news) and growth prospects linked to robotaxis and other innovations.
From a bullish perspective, the breakout of $355 followed by accelerated growth points to strong demand.
From a bearish perspective:
→ the RSI indicator has spiked into overbought territory;
→ the price is near the upper boundary of the rising channel;
→ the seven-month high could prompt profit-taking by investors – already reflected in yesterday’s pullback.
Taking this into account, we could assume that while the long-term outlook remains optimistic, a correction is possible, for example:
→ towards the 50% retracement level of the A→B impulse;
→ into the price expansion zone (a bullish imbalance signal, as described by the Fair Value Gap pattern in the Smart Money Concept methodology).
This article represents the opinion of the Companies operating under the FXOpen brand only. It is not to be construed as an offer, solicitation, or recommendation with respect to products and services provided by the Companies operating under the FXOpen brand, nor is it to be considered financial advice.

TESLA stock to gain more heights again!Tesla has finally broke out of that ardous consolidation it was in! investors can look for the buying opportunities for a probable pullback on a shown order block!
TSLA $375 Call –Momentum + Options Flow Edge!
⚡ **TSLA 1‑Day Earnings/Weekly Scalp!**
📅 **Expiry:** 2025-09-12
🎯 **Strike:** \$375 CALL
💵 **Entry:** \$1.38 (Ask)
🛑 **Stop Loss:** \$0.69 → strict 50%
📈 **Profit Target:** \$2.07 (\~+50%)
📊 **Confidence:** 70% (Moderate Bullish)
⏰ **Entry Timing:** Market Open
💎 **Why This Trade:**
* Multi-timeframe momentum bullish (daily RSI 70.4, weekly RSI 67.8)
* Institutional call flow C/P = 1.57 → strong directional skew
* Low VIX (14.9) supports call buying
* Balanced strike with high liquidity (OI 16,237)
* Quick scalp: exit by Thursday close — avoid Friday gamma crush
⚠️ **Key Risks:**
* 1 DTE → extreme gamma & theta decay
* Underlying volume moderate → pullbacks possible
* News can reverse the move rapidly
* Use **small position sizing** (1–3% max risk)
💡 **Execution Tips:**
* Use limit at ask (\$1.38) or slightly better for control
* Hard stop at \$0.69
* Scale out at \$2.07 or partial at \$1.80
* Monitor intraday VWAP & price action; abort if momentum stalls
🎯 **Quick Take:** Cheap, high-conviction 1-day scalp with defined risk & asymmetric upside. Fast in, fast out, gamma-aware trade.

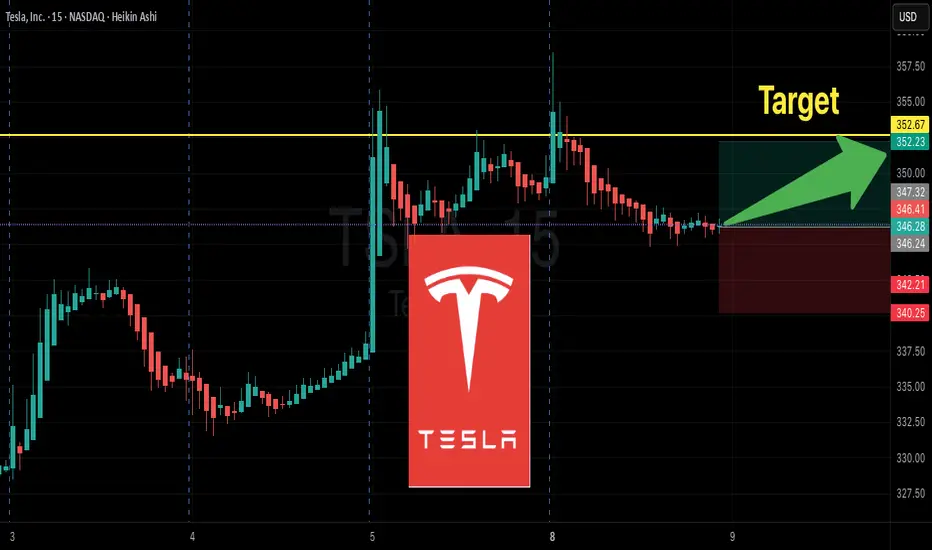
TSLA $352.50 Call—Capture Momentum Before Thursday!Here’s a **TradingView-friendly, viral-ready summary** for your TSLA weekly trade with punchy readability and attractive titles:
---
⚡ **TSLA Weekly Options Alert — Tactical Short-Duration Play**
**Directional View:** **Moderate Bullish** 💹
**Confidence:** 65%
**Trade Setup:**
* **Instrument:** TSLA
* **Strategy:** BUY CALL (single-leg)
* **Strike:** \$352.50
* **Expiry:** 2025-09-12 (4 DTE)
* **Entry Price:** \$5.00
* **Entry Timing:** Market Open
* **Size:** 1 contract
**Targets & Risk:**
* **Profit Target:** \$8.00 (\~60%+ gain)
* **Stop Loss:** \$2.50 (\~50% loss)
* **Max Hold:** No later than Thursday close (avoid Friday gamma/theta)
**Why This Trade?**
✅ Options Flow: Call/Put skew 1.35 → institutional call concentration \$350–\$355
✅ Daily Momentum: RSI 58.5 rising → near-term bullish signal
✅ Volatility: Low VIX (\~15–16) → cheaper premium, supportive environment
✅ Strike & Liquidity: \$352.50 slightly OTM with strong OI (5,781)
**Key Risks:**
⚠️ Weak weekly volume (0.9x) → institutional confirmation limited
⚠️ Short DTE → high theta/gamma; strict stop mandatory
⚠️ Negative news/catalyst risk → potential gap or intraday pullback
⚠️ Bid/ask spreads → manage fills carefully
**Quick Takeaway:**
* Tactical, short-duration directional trade leveraging **options flow + daily momentum**
* Strict risk management: **50% stop + exit by Thursday**
* Not high-conviction (>75%) — suitable for **speculative, nimble traders**
**Alternate Strikes / Ideas:**
* None provided — \$352.50 balances premium and upside potential for this 4-DTE window
---
📊 **TRADE DETAILS (JSON for precision)**
```json
{
"instrument": "TSLA",
"direction": "call",
"strike": 352.5,
"expiry": "2025-09-12",
"confidence": 0.65,
"profit_target": 8.00,
"stop_loss": 2.50,
"size": 1,
"entry_price": 5.00,
"entry_timing": "open",
"signal_publish_time": "2025-09-08 11:49:21 UTC-04:00"
}
```
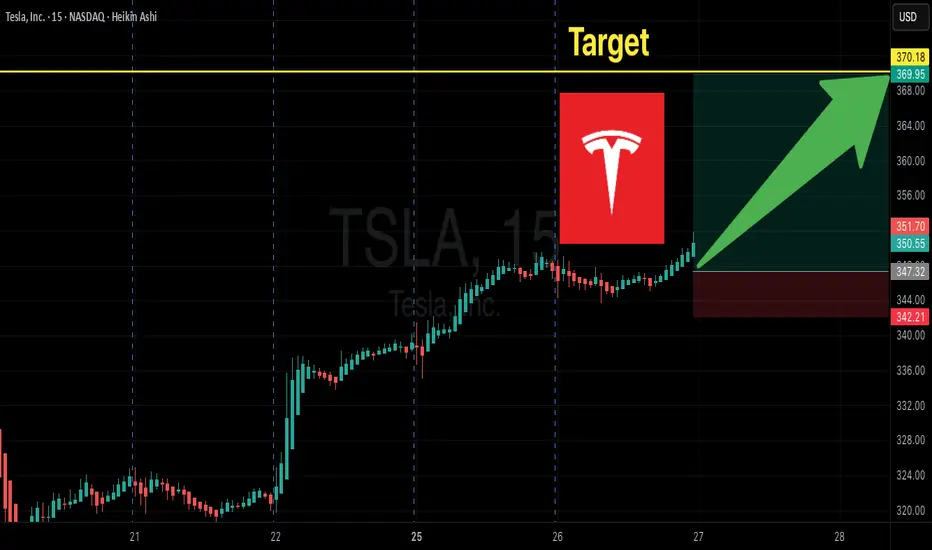
Tesla Options Flow Signals BIG Upside! $370C Momentum Trade
# 🚀 TSLA Weekly Options Setup | 370C Targeting 100%+ 📈
### 🔑 Key Highlights
* **Momentum:** RSI rising on both Daily (63.5) & Weekly (68.4) ✅
* **Options Flow:** Strong bullish skew (C/P = 1.79) 🟢
* **Volume:** Weak overall (0.9x), but institutional spike into close ⚡
* **Volatility:** VIX low → favorable for directional calls 😎
---
### 📊 Trade Setup (Consensus Pick)
* 🎯 **Instrument:** TSLA Weekly Call
* 💵 **Strike:** \$370C
* 📅 **Expiry:** 2025-08-29
* 💰 **Entry:** \$0.98 (ask) — open
* 🛑 **Stop:** \$0.49 (-50%)
* 🎯 **Target:** \$1.96 (+100%)
* ⏳ **Max Hold:** Close by **Thursday EOD** to avoid Friday theta/gamma crush
---
### 📌 Why \$370C?
* Best **liquidity** (OI \~18,450, vol 20k) → tightest fills ✅
* Balanced **delta & leverage** for short-term momentum 🎯
* Aligns with most model recommendations 📊
---
### ⚠️ Risks to Watch
* 🔻 **Theta decay** accelerates mid-week → avoid holding to Friday
* 🔻 **Gap risk** at open — manage entries with limit orders
* 🔻 **Market reversal** can kill momentum fast
---
## ✅ Final Verdict: **Strong Weekly Bullish Bias**
TSLA looks primed for an upside push — \$370C is the sweet spot for this week’s expiry.
---
### 🔥 Hashtags
\#TSLA #OptionsTrading #WeeklyOptions #StocksToWatch #MomentumTrading #TradingSignals #CallOptions #BullishSetup #TeslaStock
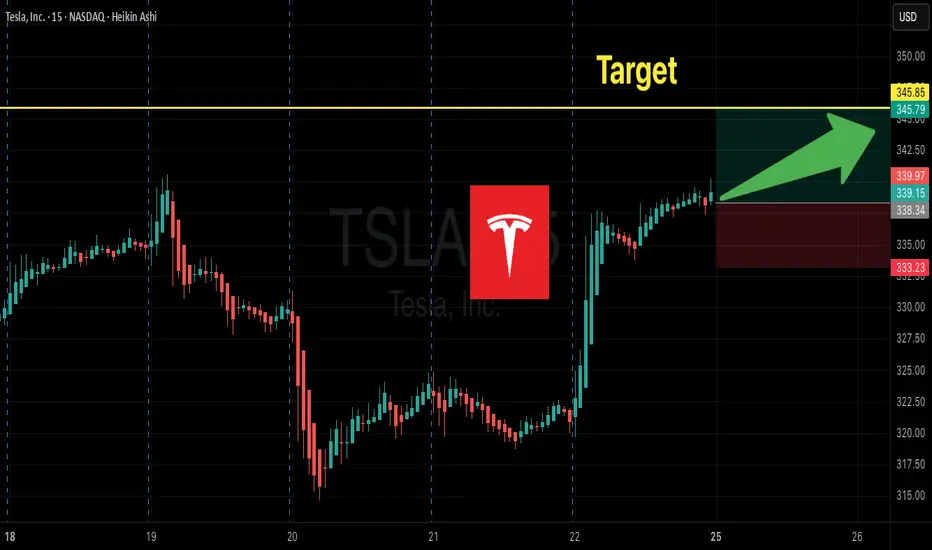
TSLA Weekly Options Setup:345C--Don’t Miss Out
# 🚀 TSLA Weekly Options Setup: Bullish Momentum Play w/ \$345C 🎯 (Aug 29 Expiry)
### 🔑 Multi-Model Summary
✅ RSI (Daily 60.1 → Weekly 65) = Bullish momentum
✅ VIX \~14.2 = Favorable volatility regime
⚠️ Weak weekly volume (0.9x) + neutral options flow (C/P \~1.10)
⚖️ Mixed models → Some lean bullish (\$345–355C), others prefer **no trade** due to weak institutional flow
---
### 📊 Recommended Trade (If You Take It)
* 🎯 **Instrument**: \ NASDAQ:TSLA
* 📈 **Direction**: Call (Long)
* 🎯 **Strike**: \$345C
* 💵 **Entry**: \~\$6.00 (limit at open)
* 🛑 **Stop**: \$3.60 (40% risk control)
* 🎯 **Target**: \$9.00 (+50%)
* 📅 **Expiry**: 2025-08-29
* 📏 **Size**: 1 contract (scalable)
* ⚡ **Exit**: By **Thursday close** (avoid Friday gamma decay)
* 🔒 **Confidence**: 65% (moderate conviction)
---
### ⚠️ Key Risks
* Weak volume = no big-money confirmation
* Event risk (SpaceX headlines)
* 5 DTE = aggressive theta decay
* Gamma swings → fast intraday moves
---
### 📌 Conclusion
Momentum favors upside, but lack of strong institutional confirmation = **medium conviction**.
👉 Conservative traders: wait.
👉 Active traders: \$345C is the best balance of **delta, liquidity, and leverage** this week.
---
### 🔥 Hashtags
\#TSLA #OptionsTrading #WeeklyOptions #CallOptions #SwingTrade #DayTrading #MomentumTrading #OptionsFlow #BreakoutTrading #StockMarket 🚀📈💎🔥
TSLA (Tesla) LONG SET UPEntry Price 1: $324.00
Entry Price 2: $314.00
Stop Loss: $294.00
Take Profit 1: $340.00 (Close 25%)
Take Profit 2: $354.00 (Close 50%)
Take Profit 3: $368.00 (Close 75%)
Take Profit 4: $384.00 (Close 100%)

TSLA $365 Calls Heating Up – Big Move Ahead, Don’t Miss Out! 🚀 TSLA Weekly Options Analysis (2025-08-17) – Don’t Miss Out!
### 🔎 Model Insights Recap
**Grok/xAI Report**
* 📊 Signals: Bullish RSI + Options Flow + Volatility
* 🔊 Volume: Weak → ⚠️ caution
* 🛑 Decision: **No trade** (mixed confirmations)
**Gemini/Google Report**
* 📊 RSI: Rising (Weekly 63.7 = bullish momentum)
* 📈 Call/Put Ratio: **1.58** → institutional bullish bias
* ✅ Decision: **Buy \$365 Call** (Moderate Bullish)
**Claude/Anthropic Report**
* 📊 Weekly trend & call flow strong
* 🔊 Volume weak = confidence tempered
* ✅ Decision: **Buy \$340 Call** w/ strict risk mgmt
**Llama/Meta Report**
* 📊 Weekly momentum bullish, daily RSI neutral
* 📈 Options Flow: Positive
* 🔊 Volume: Weak
* ✅ Decision: **Buy \$352.50 Call**, targeting moderate gains
---
### 📌 Agreement
✔️ All models = **Moderate Bullish** bias (weekly RSI strength + options flow)
✔️ Key driver = **institutional positioning** & favorable volatility
### 📌 Disagreement
⚖️ Grok → **No trade** (volume too weak)
⚖️ Gemini/Claude/Llama → **Bullish calls** w/ different strikes & risk levels
---
## 📊 Recommended Trade Setup
* **Direction:** CALL (Long)
* **Strike:** \$365
* **Expiry:** 2025-08-22
* **Entry Price:** \$0.65 (limit order)
* **Stop Loss:** \$0.32 (50% premium)
* **Profit Target:** \$1.30 (100% return)
* **Strategy:** Single-leg naked calls
* **Entry Timing:** Market Open
* **Confidence:** 65%
---
### ⚠️ Key Risks
* Weak **volume** = 🚫 risk of failed breakout
* Must monitor **follow-through** carefully → momentum may stall without institutional push
---
## 📌 Final Outlook
**TSLA = Moderate Bullish Bias** ✅
Institutional call flow supports upside, but weak volume = proceed with **tight risk management**.
---
📊 **TRADE DETAILS JSON**
```json
{
"instrument": "TSLA",
"direction": "call",
"strike": 365.0,
"expiry": "2025-08-22",
"confidence": 0.65,
"profit_target": 1.30,
"stop_loss": 0.32,
"size": 1,
"entry_price": 0.65,
"entry_timing": "open",
"signal_publish_time": "2025-08-17 09:22:38 EDT"
}
```

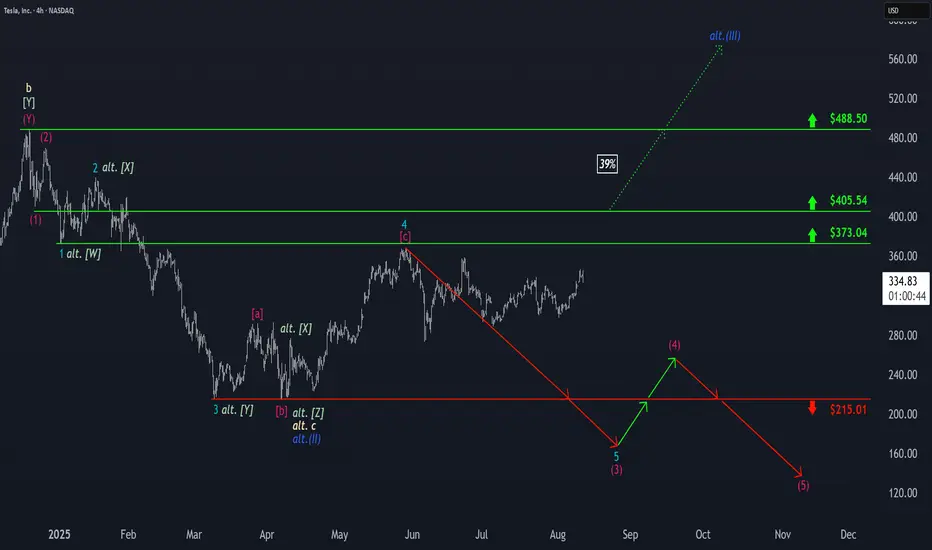
Tesla: Upward Pressure, but Bears May Soon Regain ControlTesla has once again faced upward pressure, which pushed the stock toward resistance at $373.04. However, our primary expectation is that the bears will soon regain control, setting off further sell-offs within the ongoing downward impulse. Step by step, this magenta five-wave move is expected to break below support at $215.01. If price moves above the $373.04 level, our alternative scenario will become significantly more relevant. If the stock even surpasses the higher threshold at $405.54, we will ultimately shift to this alternative view and classify Tesla as being in a sustained uptrend of blue wave alt.(III) , which would extend beyond $488.50. In this 39% likely scenario, wave alt.(II) would already be complete.
Tesla (TSLA) Shares Break Above July HighTesla (TSLA) Shares Break Above July High
As the chart indicates, Tesla (TSLA) stock is demonstrating a pronounced upward trend. Specifically, its price:
→ has risen for four consecutive days;
→ has moved above its July high;
→ has gained over 10% since the start of August.
Why Is TSLA Rising?
Among other factors, TSLA’s share price is being driven by:
→ News that Tesla has extended the estimated delivery time for the Model Y from one–three weeks to four–six weeks (according to Barron’s). This may signal an increase in orders, boosting market optimism after the first two quarters showed a notable decline in electric vehicle sales.
→ Statements from Elon Musk regarding the development of the robotaxi project. According to him, Tesla’s robotaxi service will be publicly available next month. Musk also noted that Tesla has achieved several additional breakthroughs in artificial intelligence that will make car control remarkably similar to that of a human driver.
Can TSLA continue to rise?
Technical Analysis of TSLA Stock
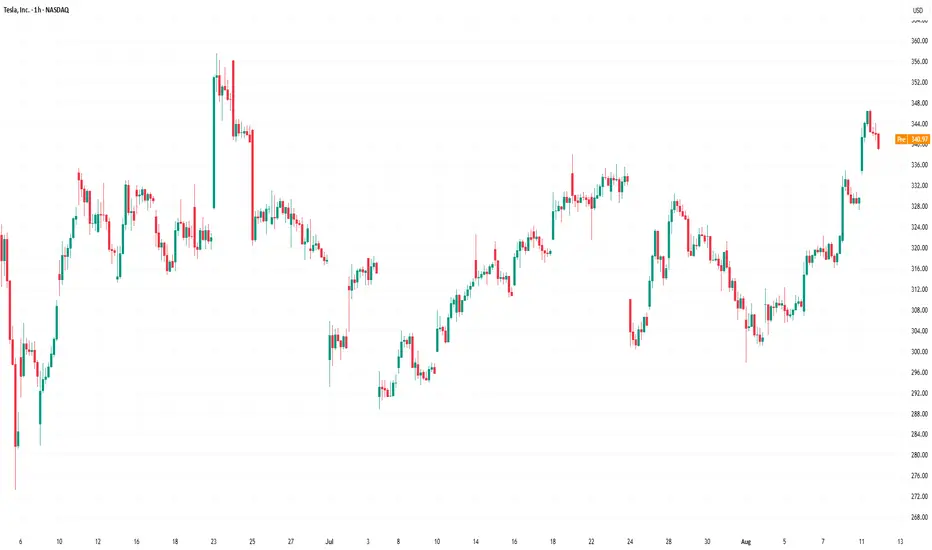
When analysing the TSLA chart on 24 July, we identified a broadening triangle pattern with its axis around $317. Since then:
→ the price tested the lower boundary of the triangle and reversed upwards (as indicated by the arrow);
→ importantly, it broke through the upper boundary. This was made possible by the improvement in the fundamental backdrop (as reflected in the news), leading to a shift in market sentiment in favour of buyers.
Yesterday, the NASDAQ recorded the highest trading volume in August, with the daily candle closing below its midpoint – a sign of increased seller activity, further confirmed by the most recent long bearish candle on the hourly chart.
Given the above (as well as the RSI indicator approaching overbought levels), we could assume that TSLA’s share price could see a short-term correction following its rally in early August. Should the market follow this scenario, the price could pull back to the area highlighted in purple, which represents a significant support level, as it lies close to:
→ the upper boundary of the triangle (former resistance);
→ the lower boundary of the ascending channel (shown in blue);
→ the 50% retracement level of the A→B impulse;
→ price zones of strong upward movement (a bullish imbalance zone, as described by the Fair Value Gap pattern of the Smart Money Concept methodology).
This article represents the opinion of the Companies operating under the FXOpen brand only. It is not to be construed as an offer, solicitation, or recommendation with respect to products and services provided by the Companies operating under the FXOpen brand, nor is it to be considered financial advice.
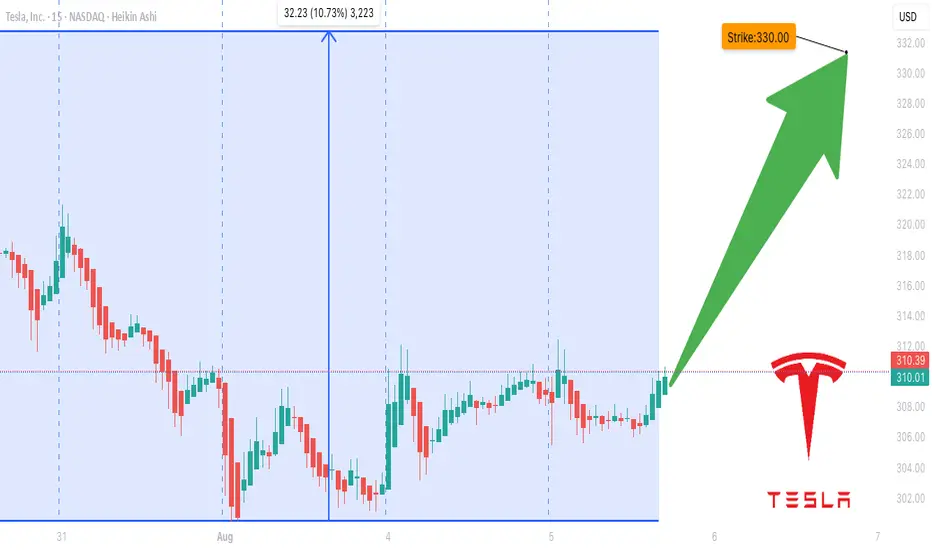
TSLA Don't Miss Out
### 🔥 TradingView Viral Post Format 🔥
---
### 📢 **Title:**
**TSLA Options Surge? \$330 Call Could Double in 3 Days — Here's the Setup** 🚀📈
---
### 📝 **Description:**
Tesla’s options market is flashing **moderate bullish signals** this week! 📊
✔️ Call/Put Ratio: **1.39** (Bullish)
✔️ RSI (Daily & Weekly): **Rising**
⚠️ Volume is light, but sentiment leans bullish.
🎯 **Trade Idea:**
Buy TSLA \$330 Call (Exp: Aug 8)
💰 Entry: \$0.85
🎯 Target: \$1.70
🛑 Stop: \$0.43
⏱️ Confidence: 65%
⚡ Gamma risk rising with time decay — tight execution is key.
Is this the breakout or a bull trap? Let’s watch it play out 👀
👇 Drop your thoughts or setups in the comments!
---
### 🏷️ **Tags (for TradingView):**
```
#TSLA #Tesla #OptionsTrading #CallOptions #BullishSetup #TSLAOptions #StockMarket #WeeklySetup #TradingStrategy #TechnicalAnalysis #TradeIdea #MomentumTrade #UnusualOptionsActivity #TradingView
TSLA Weekly Bearish Play — August 2, 2025
🔻 **TSLA Weekly Bearish Play — August 2, 2025** 🔻
🚨 **Multi-Model Consensus Signals a Tactical Put Opportunity**
### 🔍 Market Snapshot:
* **Daily RSI:** 39.9 (Bearish)
* **Weekly RSI:** 53.2 → Falling
* **Volume:** Weak (0.8x last week)
* **Options Flow:** Neutral (C/P Ratio \~1.04)
* **VIX:** 20.38 → Favorable for Options Plays
* **Institutional Support:** Weak
---
### 🔮 Model Consensus:
📉 **All major models (xAI, Google, Claude, Meta, DeepSeek)** confirm:
* Bearish momentum on both daily + weekly RSI
* Weak volume = cautious institutional behavior
* Volatility setup perfect for short-dated puts
---
### 🎯 Viral Trade Setup:
**💥 Trade Type:** PUT (Short TSLA)
**🔻 Strike:** \$300
**📆 Expiry:** 2025-08-08
**💰 Entry Price:** \$6.65
**🎯 Target Exit:** \$10.64 – \$13.30 (60%-100% gain)
**🛑 Stop Loss:** \$3.99
**📊 Confidence:** 65%
**📍 Entry Timing:** Monday open
**🕒 Signal Timestamp:** 2025-08-03 01:33:56 EDT
---
### ⚠️ Key Levels:
* Support to watch: **\$297.82**
* News/event risks: Stay alert ⚡
* Use tight risk controls for weekly plays!
---
🔥 **If you trade TSLA — don’t sleep on this one.**
Bearish consensus + clean setup = **high-probability weekly play.**

TSLA WEEKLY OPTIONS SETUP
### 🚗 TSLA WEEKLY OPTIONS SETUP (2025-07-28)
**Big Call Flow. Low VIX. Can Bulls Hold \$325?**
---
📊 **Momentum Overview:**
* **Daily RSI:** 48.2 🔻 → *Neutral-to-Weak*
* **Weekly RSI:** 57.1 🔻 → *Still bullish zone, but falling*
⚠️ **Interpretation:** Momentum is softening, trend in question.
📉 **Volume Context:**
* **Volume Ratio:** 1.3x ⬆️ (vs. last week)
* **Price Change:** -0.77% despite that volume
🔍 *Distribution Alert:* Institutions may be selling into strength.
📈 **Options Flow:**
* **Call/Put Ratio:** **1.70** = 🚨 *Bullish flow confirmed*
* **Volatility (VIX):** 15.16 🟢 Favorable for directional plays
✅ Strong setup for options traders riding short-term momentum
---
### 🧠 **Weekly Sentiment Scorecard:**
* ✅ **Bullish Signals (2):** Options Flow, Volatility
* ⚠️ **Neutral Signals (2):** Daily & Weekly RSI
* ❌ **Bearish Signal (1):** Volume pattern = distribution risk
**Overall Bias:** 🟢 *Moderate Bullish*
---
### 🔥 **TRADE SETUP IDEA:**
🎯 **Strategy:** Long Call Option
* 📌 **Instrument:** TSLA
* 💵 **Strike:** \$355C
* 📅 **Expiry:** Aug 1, 2025
* 💸 **Entry:** \~\$0.75
* 🎯 **Profit Target:** \$1.50
* 🛑 **Stop Loss:** \$0.45
* 🔒 **Key Support to Watch:** \$327.50 — lose that = exit fast
📈 **Confidence Level:** 65%
⚠️ **Gamma Risk:** High → trade small, manage tight.
---
### 📦 TRADE\_DETAILS (JSON Format for Algo/Backtest):
```json
{
"instrument": "TSLA",
"direction": "call",
"strike": 355.0,
"expiry": "2025-08-01",
"confidence": 0.65,
"profit_target": 1.50,
"stop_loss": 0.45,
"size": 1,
"entry_price": 0.75,
"entry_timing": "open",
"signal_publish_time": "2025-08-01 09:30:00 UTC-04:00"
}
```
---
### 🧭 **Quick Notes for Traders:**
* ✅ Bulls have short-term edge — but **momentum is fading**
* ⚠️ If TSLA breaks below **\$325**, exit fast.
* 🔍 Watch for fakeouts: options flow is bullish, but volume says “not so fast.”
---
📊 TSLA \$355C → Risk \$0.75 to potentially double 📈
💬 Will this hold, or is it a bull trap before a dump? 👀
Comment below ⬇️ and follow for Monday updates!
---
**#TSLA #OptionsFlow #WeeklyTrade #TradingSetup #GammaRisk #AITrading #TeslaStock #UnusualOptionsActivity #SmartMoneyMoves**

Tesla Shares (TSLA) Drop Following Earnings ReportTesla Shares (TSLA) Drop Following Earnings Report
Yesterday, after the close of the main trading session on the stock market, Tesla released its quarterly earnings report. While both earnings per share (EPS) and gross profit slightly exceeded analysts’ expectations, the results reflected a negative trend driven by declining sales. This decline is being influenced by intensifying competition from Chinese EV manufacturers as well as Elon Musk’s political activity.
According to Elon Musk:
→ The company is facing “a few tough quarters” due to the withdrawal of electric vehicle incentives in the US;
→ The more affordable Tesla model (mass production expected in the second half of 2025) will resemble the Model Y;
→ By the end of next year, Tesla's financials should become "highly compelling".
Tesla’s share price (TSLA) fell by approximately 4.5% in after-hours trading, clearly reflecting the market’s reaction to the report. Today, the stock is likely to open around the $317 level, down from over $330 just the day before.
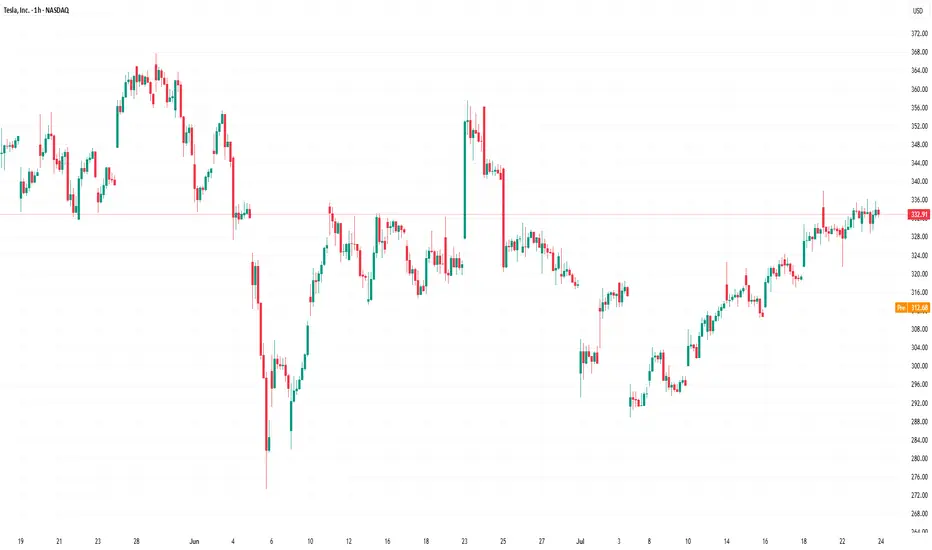
Technical Analysis of TSLA Stock Chart
In our analysis of TSLA charts dated 2 July and 8 July, we outlined a scenario in which the stock price could form a broad contracting triangle, with its axis around the $317 level.
The new candlesticks that have appeared on the chart since then have reinforced the relevance of this triangle, as the price rebounded from the lower boundary (as indicated by the arrow) and headed towards the upper boundary. However, yesterday’s earnings report disrupted this upward move.
Thus, while the broader stock market is trending higher (with the S&P 500 reaching a historic high yesterday), TSLA may remain "stuck" in a consolidation phase, fluctuating around the $317 level—at least until new fundamental drivers shift market sentiment.
This article represents the opinion of the Companies operating under the FXOpen brand only. It is not to be construed as an offer, solicitation, or recommendation with respect to products and services provided by the Companies operating under the FXOpen brand, nor is it to be considered financial advice.
TSLA WEEKLY CALL SETUP — 07/23/2025
🚀 TSLA WEEKLY CALL SETUP — 07/23/2025
📈 AI Consensus Signals 🔥 Bullish Move Incoming
⸻
🔍 SENTIMENT SNAPSHOT
5 AI Models (Grok, Gemini, Claude, Meta, DeepSeek) =
✅ MODERATE BULLISH BIAS
➡️ Why?
• ✅ RSI Momentum (Daily + Weekly = UP)
• ✅ Bullish VIX sentiment
• ⚠️ Weak volume + neutral options flow
• 🧠 No model signals bearish direction
⸻
🎯 TRADE IDEA — CALL OPTION PLAY
{
"instrument": "TSLA",
"direction": "CALL",
"strike": 380,
"entry_price": 0.88,
"profit_target": 1.76,
"stop_loss": 0.44,
"expiry": "2025-07-25",
"confidence": 65%,
"entry_timing": "Open",
"size": 1 contract
}
⸻
📊 TRADE PLAN
🔹 🔸
🎯 Strike 380 CALL
💵 Entry Price 0.88
🎯 Target 1.76 (2× gain)
🛑 Stop Loss 0.44
📅 Expiry July 25, 2025
📈 Confidence 65%
⏰ Entry Market Open
⚠️ Risk High gamma / low time (2DTE)
⸻
📉 MODEL CONSENSUS
🧠 Grok – Bullish RSI, cautious due to volume
🧠 Gemini – Momentum confirmed, weekly strength
🧠 Claude – RSI + VIX = green light
🧠 Meta – 3 bullish signals, minor risk caution
🧠 DeepSeek – RSI + volatility favorable, careful on size
⸻
💬 Drop a 🟢 if you’re in
📈 Drop a ⚡ if you’re watching this flip
🚀 TSLA 380C looks primed if we break resistance near $376
#TSLA #OptionsTrading #CallOptions #WeeklySetup #AIPowered #MomentumTrade #TeslaTrade #GammaRisk #ZeroDTEReady
