UK100 (FTSE 100) Bullish Setup | Day & Swing Outlook🔥 Bullish Bias — Tactical Opportunity in UK100 (FTSE 100) 🔥
📌 Asset: UK100 / FTSE 100 Index (largest 100 companies on London Stock Exchange) — benchmark for UK equity sentiment & global cyclicals.
🧠 Setup & Trade Plan
Bullish Plan: Anticipating continuation from value area / liquidity sweep, confirmation of buyers.
Entry: Any favorable price level BUT Thief’s preferred LIMIT LAYER entries (zone stacking) at:
💠 10,160
💠 10,180
💠 10,200
(Precision entries for better R:R — if price respects buyers here, odds tilt bullish.)
Stop-Loss (Thief SL): 📉 10,120
(Adjust according to your risk tolerance — trade safe, manage risk before entries.)
🎯 Profit Target
✔️ Primary Target: 10,350+
Rationale: Potential reaction zone — overlapped resistance, overbought divergences, correlation trap zone — consider partial profit taking. (Not financial advice; scale out with structure.)
🔁 Related Markets / Pairs to Watch
Monitoring correlations can help confirm trend strength and risk sentiment:
👉 GBP/USD
Weak GBP often boosts UK100 performance (many FTSE constituents earn overseas revenues).
Watch for strength/weakness sign changes around key levels.
👉 EUR/GBP & EUR/USD
Can signal broader risk shifts and GBP cross moves. Positive EUR/USD often reflects USD weakness which may align with equity strength.
👉 S&P 500 / US Indices
Global risk sentiment influence — broad equity strength often lifts UK indices.
👉 Gold & Commodities
Risk-off lift in gold might signal equity hesitations — use for context.
📊 Key Technical Notes
✔️ Price zones respected — layered demand strategy adds precision.
✔️ Watch for structural breaks or topping tails on higher TFs for reversal cues.
✔️ RSI / Stoch divergence tools can help confirm entry timing.
🧾 Fundamental & Macro Factors
📅 Upcoming Events That May Influence FTSE 100:
UK economic data (GDP, inflation prints, labour stats) — impact sentiment and monetary stance.
BOE interest rate expectations / policy bias — can shift GBP & equity flows.
Major global macro events (Fed pivots, US job data, China trade cues).
(These drive broader risk flows and can swing indices fast.)
📌 Economic Influence:
UK100 has strong international revenue exposure — GBP weakness often boosts FTSE returns as overseas revenue translates into stronger GBP earnings.
📌 Risk Management Reminder
❗ This idea isn’t financial advice — do your own analysis & size positions according to your personal risk rules. Trade with discipline.
🚀 Thief OG’s — Let’s Swipe Profits, Not Dreams.
🔓 “Every breakout once lived as resistance. Patience picks the lock.”
💎 Stack entry zones, manage risk, take profits — that’s how professionals trade.
UK 100

UK100 H1 |Falling Towards Key SupportBased on the H1 chart analysis, we could see the price fall to our buy entry level at 10,180.09, which aligns with the 38.2% Fibonacci retracement.
Our stop loss is set at 10,122.34, which is a pullback support that is slightly below the 61.8% Fibonacci retracement.
Our take profit is set at 10,272.06, which is a swing high resistance.
High Risk Investment Warning
Stratos Markets Limited fxcm.com Stratos Europe Ltd fxcm.com
CFDs are complex instruments and come with a high risk of losing money rapidly due to leverage. 69% of retail investor accounts lose money when trading CFDs with this provider. You should consider whether you understand how CFDs work and whether you can afford to take the high risk of losing your money.
Stratos Global LLC fxcm.com Losses can exceed deposits.
Please be advised that the information presented on TradingView is provided to FXCM (‘Company’, ‘we’) by a third-party provider (‘TFA Global Pte Ltd’). Please be reminded that you are solely responsible for the trading decisions on your account. Any information and/or content is intended entirely for research, educational and informational purposes only and does not constitute investment or consultation advice or investment strategy. The information is not tailored to the investment needs of any specific person and therefore does not involve a consideration of any of the investment objectives, financial situation or needs of any viewer that may receive it. Past performance is not a reliable indicator of future results. Actual results may differ materially from those anticipated in forward-looking or past performance statements. We assume no liability as to the accuracy or completeness of any of the information and/or content provided herein and the Company cannot be held responsible for any omission, mistake nor for any loss or damage including without limitation to any loss of profit which may arise from reliance on any information supplied by TFA Global Pte Ltd.
Stratos Trading Pty. Limited fxcm.com
Trading FX/CFDs carries significant risks. FXCM AU (AFSL 309763), please read the Financial Services Guide, Product Disclosure Statement, Target Market Determination and Terms of Business at fxcm.com

UK100 H4 | Bullish Continuation SetupBased on the H4 chart analysis, we could see the price fall to our buy entry level at 10,067.24, which is a pullback support that is slightly below the 23.6% FIbonacci retracement.
Our stop loss is set at 9,935.66, which is a pullback support that aligns with the 50% FIbonacci retracement.
Our take profit is set at 10,364.91, which aligns with the 61.8% FIbonacci projection.
High Risk Investment Warning
Stratos Markets Limited (

UK100 Ready for 10,000? Bullish Swing Setup Explained🔹 UK100 (FTSE 100) Index — Swing Trade Opportunity Guide
Asset: UK100 Index
Market Type: Indices
Trade Style: Swing Trade
📊 Market Bias
Trend Direction: 🟢 Bullish
Bullish structure confirmed with a HULL Moving Average + Triangular Moving Average pullback, indicating trend continuation after healthy retracement.
🎯 Trade Plan
Strategy: Trend-following pullback continuation
Entry Plan:
👉 Any price level entry allowed
👉 Layered entry approach (Thief Layering Strategy)
Buy Limit Layer Zones:
• 9700
• 9750
• 9800
(You may increase or adjust layers based on your own risk plan)
This layered approach helps optimize average entry during volatility without chasing price.
🛑 Risk Management
Stop Loss: 9650
⚠️ Dear Ladies & Gentlemen (Thief OG’s),
This stop loss is not mandatory. Adjust SL according to your personal risk management and strategy rules.
🎯 Profit Plan
Primary Target: 10000
📌 Reasoning:
• Strong resistance zone
• Overbought conditions expected
• Potential trap & corrective reaction near highs
⚠️ Dear Ladies & Gentlemen (Thief OG’s),
This TP is for guidance only. Partial profits and manual exits are encouraged based on price action.
🔗 Related Markets to Watch (Correlation Guide)
💵 USD Index (DXY)
• Weakness in DXY often supports global equity indices
• Risk-on sentiment favors UK100 upside continuation
🇺🇸 US30 / NAS100
• Strong US indices usually provide positive sentiment spillover
• Bullish continuation in US equities supports FTSE strength
🛢️ Brent Crude (UKOIL)
• UK100 has heavy energy exposure
• Rising oil prices can boost FTSE components
🏦 GBP/USD
• Extreme GBP strength may cap FTSE upside
• Mild GBP weakness is generally supportive for UK exporters
🧠 Final Notes
✔ Trend-following setup
✔ Layered risk-controlled entries
✔ Structure-based SL
✔ Resistance-aware profit planning
📌 Trade smart. Manage risk. Let the trend pay.

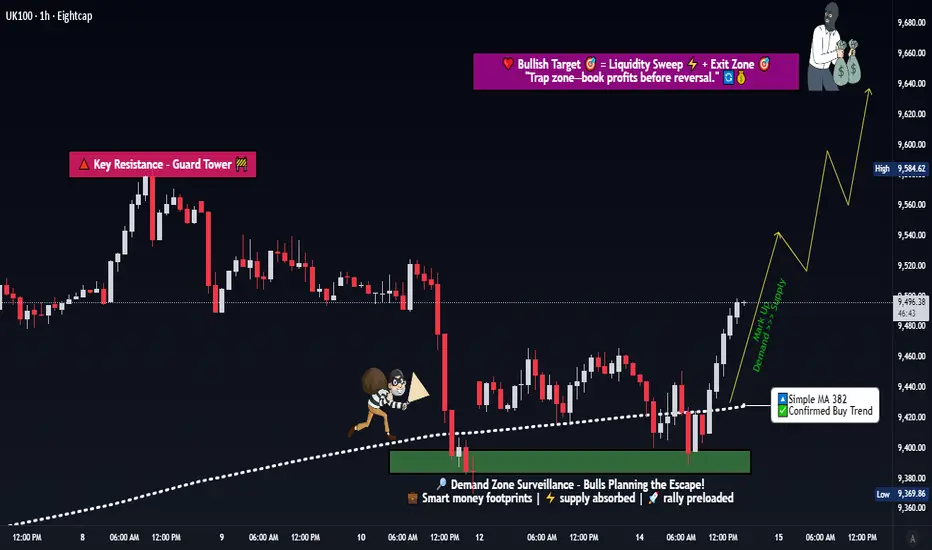
UK100 Strategy Map: SMA Pullback Meets Heikin Ashi Signal🚀 UK100 Index Market Wealth Strategy Map (Swing/Day Trade)
📊 Plan
🔹 Bias: Bullish trend confirmed
🔹 Method: Simple Moving Average (SMA-382) pullback + bullish Heikin Ashi candle confirmation + Double bottom pullback detected.
🔹 Style: Thief layering strategy (multiple limit orders to build position)
🎯 Entry Plan
💡 Using layer entries (multiple limit orders) for flexibility:
Buy Limit @ 9220
Buy Limit @ 9230
Buy Limit @ 9240
Buy Limit @ 9250
👉 (Layers can be increased depending on market context — this is just my thief-style approach 🕵️)
🛡️ Stop Loss (Thief SL)
Protective Stop @ 9190
⚠️ Note: Dear Ladies & Gentlemen (Thief OG’s) — this is my style of SL. You can manage risk in your own way.
💰 Target
Exit Zone @ 9330 (near strong resistance + overbought area + possible trap zone)
⚠️ Note: Not financial advice — escape with profits when the market gives!
🔑 Thief Notes
This is my OG layering strategy — I don’t set rigid SL/TP rules for everyone. Manage your own risk 💼.
Goal: Catch the swing, ride the bullish confirmation, and exit before trap levels lock profits.
🌍 Related Pairs to Watch
Because UK100 often correlates with global indices & USD movements:
FOREXCOM:SPX500 (US equities correlation, risk sentiment driver)
GOMARKETS:DAX40 (European equity benchmark, strong correlation with UK100)
FX:USDJPY (risk-on/risk-off sentiment gauge)
FX:GBPUSD (pound strength can influence UK equities indirectly)
Watching these helps confirm whether the UK100 move is supported by broader market flows 📈🌐
✨ “If you find value in my analysis, a 👍 and 🚀 boost is much appreciated — it helps me share more setups with the community!”
⚠️ Disclaimer: This is the Thief Style Trading Strategy — created for fun & educational purposes only. Not financial advice. Trade at your own risk.
#UK100 #FTSE100 #IndexTrading #SwingTrade #DayTrading #HeikinAshi #SMA #ThiefStrategy #SPX500 #DAX40 #GBPUSD #USDJPY #TradingCommunity

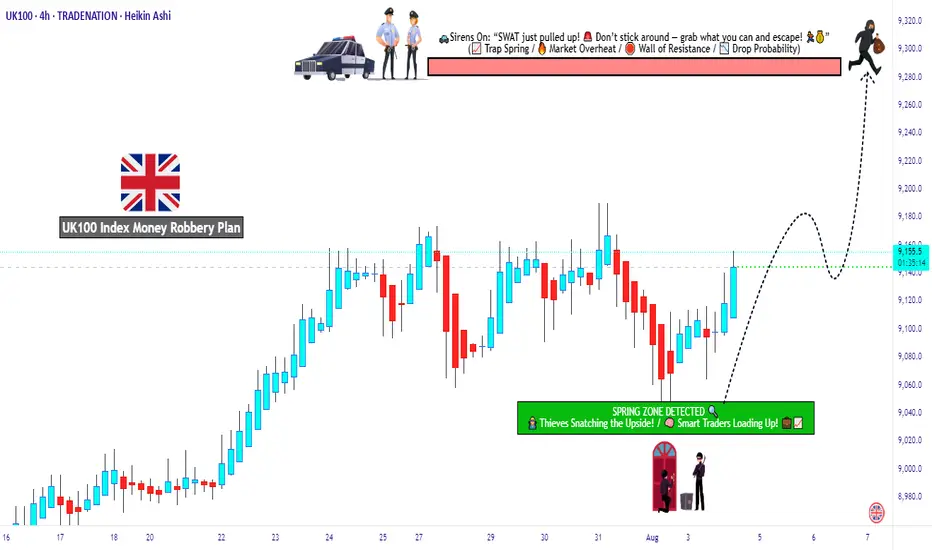
Is This the Perfect Retest for UK100 Buyers to Step In?💹 UK100 “Thief’s Layered Breakout Plan” | Bullish Retest Playbook 🏴☠️
Asset: UK100 Index CFD – Swing/Day Trade Opportunity Guide
Bias: 🔼 Bullish, confirmed by retest at the Simple Moving Average (SMA)
📊 Trade Plan:
The market structure shows a clean SMA retest zone, supporting a potential bullish continuation.
Our Thief Strategy uses layered entries — a pro-style method to catch price action across zones instead of waiting for a single perfect candle.
📍 Layered Buy Limits:
→ 9420
→ 9440
→ 9460
→ 9480
(You can increase layers based on your risk appetite and liquidity read)
🛑 Stop Loss (Thief SL): 9360
💰 Target: 9640 — “The Police Barricade” ⚠️ acting as resistance, overbought zone, and potential liquidity trap.
⚠️ Note to all Thief OG’s:
This setup is not financial advice — use my idea for educational purposes only. Manage your own SL and TP based on your plan and capital. You rob the market — but wisely.
🧠 Technical Key Points:
SMA Retest Confirmation: Confirms bullish continuation on lower timeframes.
Liquidity Sweep: Smart money grabbed stops near 9360 before reversal.
Momentum Rebuild: Buyers reloading via hidden accumulation layers.
Target Zone: Strong supply area near 9640 (watch for profit-taking).
🔗 Correlated Market Watch:
TVC:DXY – Inverse correlation; weaker USD can fuel UK100 strength.
SP:SPX / TVC:DJI – Risk-on sentiment confirmation.
SPREADEX:FTSE Futures – Directly mirrors UK100; monitor for intraday direction bias.
TVC:GOLD – Hedge flow signal; gold weakness can indicate equity strength.
Keep these on your radar — they add confluence to our Thief’s plan.
🎯 Thief’s Market Wisdom:
“You don’t chase the move — you build layers before it wakes up.
Smart traders rob the market with patience, not panic.” 💼
✨ If you find value in my analysis, a 👍 and 🚀 boost is much appreciated — it helps me share more setups with the community!
⚠️ Disclaimer:
This is a Thief-style trading strategy created just for fun and educational purposes — not financial advice. Trade at your own risk and reward.
#UK100 #FTSE #IndexTrading #SmartMoneyConcepts #PriceAction #SwingTrade #DayTrading #TradingPlan #MarketStructure #BullishSetup #ThiefTrader #LayeredEntry #CFDTrading #TechnicalAnalysis #ForexCommunity
Will The FTSE100 Breakout Trigger This Bullish Plan?🎯 Title: UK100/FTSE100 Money Heist Plan: Bullish Breakout Play (Swing Trade) 💰⚡
Asset: #UK100 #FTSE100 ( TVC:UKOIL , FX:GBPUSD , OANDA:EURGBP )
🗺️ The Heist Plan Overview
Ladies & Gentlemen, Thief OG's! 👋🕵️♂️ Welcome to the vault. Our plan is a calculated BULLISH swing trade on the UK100, triggered by a key breakout. We're not kicking the door down; we're waiting for the alarm to be disabled first.
Trade Bias: Bullish (Pending Order Plan) 📈
Strategy: "The Thief" Layering Entry (Minimizes risk, maximizes opportunity)
Key Level: 9,250.00 – The Vault Door 🚪
⚡ Execution Details (The How)
ENTRY CONFIRMATION: We only move after a CONFIRMED BREAKOUT above 9,250.00. ⚡
SET AN ALARM! {{ticker}} > 9250 - Don't miss the signal!
ENTRY METHOD ("The Thief" Layer Strategy): 🎯
Instead of one risky entry, we use multiple BUY LIMIT orders placed below the breakout level to catch any retest. This is a sophisticated, risk-aware method.
Layer 1: 9,200.00
Layer 2: 9,225.00
Layer 3: 9,250.00 (Breakout Level Retest)
You can add more layers (e.g., 9,275) based on your capital & risk appetite.
STOP LOSS (The Escape Route): 🚨
My SL: 9,150.00 (Place after your entry is filled).
⚠️ IMPORTANT NOTE: This is MY plan. You, the Thief OG, MUST adjust your stop loss based on your own risk management strategy. Protect your capital.
TAKE PROFIT (The Escape with the Money): 💎
TP Target: 9,400.00
Why Here? This aligns with a major historical resistance zone, potential overbought conditions, and a classic bull trap area. Escape with your stolen profits before the market reverses!
⚠️ IMPORTANT NOTE: You can choose to take partial profits earlier or trail your stop. "Make money then take money at your own risk."
🕵️♂️ Why This Heist? (The Analysis)
This isn't a random guess. It's a plan backed by data.
📊 Real-Time Snapshot (#UK100CFD)
Daily Change: -0.09% 📉 (A slight dip for a better entry?)
1-Month Performance: +0.48% 📈
1-Year Performance: +12.55% 🚀 (Strong underlying trend)
😊 Market Sentiment & Fear/Greed
Retail Sentiment: 55% Bullish 🐂 | 45% Bearish 🐻
Institutional Sentiment: 60% Bullish 🐂 | 40% Bearish 🐻
Overall Mood: Moderately Bullish 😊
Fear & Greed Index: 53/100 (Neutral) ⚖️
This suggests the market is not overly euphoric or fearful, providing a stable backdrop for our breakout play.
📈 Fundamental & Macro Backdrop:
Fundamental Score: 65/100 ✅
Strong earnings in defensive sectors (Healthcare, Energy). 💪
Attractive valuations vs. US indices (P/E 20% below S&P 500). 💰
Stable UK interest rate environment. 📊
Macro Score: 55/100 ⚖️ (Caution Advised)
Risks: UK GDP contraction (-0.3%) and global trade tensions. 📉🌎
Support: Bank of England rate cuts providing a floor. 🏦
Overall Outlook: 60/100 (Mildly Bullish) 🐂
The resilience of the FTSE100, combined with solid fundamentals and neutral sentiment, creates a favorable setup for a breakout to the upside.
✅ Related Pairs to Watch
TVC:UKOIL (BP/Shell correlation)
FX:GBPUSD (GBP strength/weakness)
OANDA:EURGBP (UK vs. Eurozone strength)
✨ “If you find value in my analysis, a 👍 and 🚀 boost is much appreciated — it helps me share more setups with the community!”
#Trading #Investing #SwingTrading #Breakout #Strategy #LayerStrategy #UK100 #FTSE #CFD #Protest #MoneyHeist #Plan

FTSE closes in on 9.5KThe FTSE 100 (+0.7%) has continued to push higher along with other European indices. The UK benchmark index has actually hit a new record high today to close in on the 9,500 level. Distributor Bunzl (+4%) leads the blue chips while miners such as Fresnillo are also among the gainers amid rallying metals prices.
As we have been banging on about it, the FTSE remains in a strong bullish trend and dips are continuing to be bought with resistance levels giving way. Old resistance at 9,360 is now the most important short-term support to watch. Below that 9,270 is the next key level where a trend line converges.
By Fawad Razaqzada, market analyst with FOREX.com

FTSE 100 Index Closes at an All-Time HighFTSE 100 Index Closes at an All-Time High
Earlier, when analysing the chart of the UK’s FTSE 100 stock index, we outlined an ascending channel and anticipated a scenario with a continued upward trend and an attempt to establish a new historical high.
Since then:
→ The index has risen by almost 5%. The channel structure has shifted slightly, but not dramatically – after adjustment, it remains relevant given the latest price dynamics.
→ Yesterday, the stock index climbed to 9,325, thereby setting an all-time high.
Bullish sentiment was supported by news of a shrinking public sector deficit and increased private sector output. How might the situation develop further?
Technical Analysis of the FTSE 100 Chart
From a bullish perspective:
→ The market remains in bullish territory.
→ The price successfully broke through the resistance zone at 9,180–9,200 (in effect since late July).
→ The 0→1 impulse was strong, signalling buyers’ dominance.
→ The price remains above the 50% Fibonacci retracement of the 0→1 impulse, which may serve as support during a pullback.
→ Additional support could come from the green zone, where bulls were strong during the breakout above the 9,180–9,200 resistance area.
From a bearish perspective: the upper boundary of the channel has confirmed its role as resistance. At the same time, peaks 1 and 2 have formed:
→ They show signs of a bearish Double Top pattern, creating bearish divergence with the RSI indicator.
→ The fact that the second peak is slightly above the first adds weight to the bearish case: this could have been a bull trap for late buyers, while in reality the rally may already be exhausted.
The ability of bulls to keep the price above the green zone may confirm the strength of the FTSE 100. Nevertheless, in the short term, scenarios involving pullbacks and retests of the mentioned support levels might be realised (as seen in early August, when the 9,040 level was tested in an aggressive manner).
This article represents the opinion of the Companies operating under the FXOpen brand only. It is not to be construed as an offer, solicitation, or recommendation with respect to products and services provided by the Companies operating under the FXOpen brand, nor is it to be considered financial advice.

Is UK100 Setting Up the Cleanest Bull Robbery This Week?🏴☠️💹“UK100 Bullish Bank Job Heist 🧠💰” – Thief Trader Limit Order Operation 🚨📊
📢 Calling all stealthy traders, market pirates, and strategic looters! The vault is open, and the FTSE100 (UK100) index is now under our radar for a planned bullish extraction. This ain’t no regular trade — this is a Thief-Style Layered Entry Operation™.
🎯 Plan of Attack:
Asset: UK100 / FTSE100
Bias: Bullish
Entry: Any price level — we layer like legends (multiple limit orders across price zones)
Stop Loss: 9040.0 (vault protection level 🔐)
Target: 9280.0 (loot zone confirmed 🎯)
🧠 Thief Strategy Breakdown:
🔎 Why Bullish?
The setup is showing signs of accumulation + macro support, with strong risk-to-reward potential. Market exhaustion and liquidity traps are visible — it’s time to slip in quietly and stack long orders like a silent thief in the night.
📈 Execution Plan:
🔹 Use limit orders below current price (layer across price pockets)
🔹 DCA-style entries for better average and flexibility
🔹 Risk small, aim large
🔹 Always watch for market traps or surprise bear moves
🛡️ Stop-Loss Logic:
Below structure zones or 4H support – ~9040.0
Don't get greedy — protect the bag at all times.
🚪 Target the Escape:
Primary TP set at 9280.0
Optional: secure partials earlier using trailing SL once price breaks above 9200 zone.
📊 Trader Alerts:
⚠️ Avoid new positions during high-impact UK news
📅 Check for BOE surprises or global market shocks
🔁 Trail stops — don’t let profits vanish like a clumsy thief
📌 Notes from the Underground Vault:
🔐 This trade idea is based on market structure + liquidity flow
📌 Not financial advice — always rob with your own blueprint
💼 Trade light. Think sharp. Escape clean.
🔥 Join the Robbery Squad
Smash the idea boost 💥 if you're running this setup too.
💬 Drop a “HEIST LOADED” in the comments if you're in. Let’s loot this market the smart way — layered, patient, and untraceable. 🏴☠️💸
"UK100 Grand Heist: Bullish Loot Plan with Thief Trading Style!🌍 Hello, Global Wealth Warriors! Ciao, Salut, Guten Tag, Ola! 🌟
Fellow Profit Pirates & Market Mavericks, 💸⚡
Unveiling our cunning blueprint to plunder the "UK100/FTSE100" Index Market, crafted with 🔥Thief Trading’s razor-sharp technical and fundamental insights🔥. Stick to the chart’s game plan, zoned in on a long entry. Our mission? Slip out near the high-stakes ATR Zone Level—a perilous spot with overbought vibes, consolidation, trend flips, and traps where bearish bandits lurk. 🏴☠️💰 Celebrate your wins, traders—you’ve earned it! 🎉
📈 **Entry Point**: The vault’s unlocked! Grab the bullish bounty at current prices—the heist is live!
💡 Pro Tip: Set buy limit orders on a 15 or 30-minute timeframe, targeting recent or swing lows/highs. Don’t forget to set chart alerts for precision! 🚨
🛑 **Stop Loss**:
📍 Thief SL parked at the recent/swing low on the 4H timeframe (8500.0) for day/swing trades.
📍 Tailor your SL to your risk appetite, lot size, and number of orders. Stay sharp!
🎯 **Target**: Aim for 8850.0 or make a swift exit just before.
👀 **Scalpers, Listen Up**: Stick to long-side scalping. Got deep pockets? Dive in now! Otherwise, join swing traders for the grand heist. Use trailing SL to shield your loot. 💰
💹 **Market Pulse**: The UK100/FTSE100 is in a neutral zone but leaning bullish, fueled by key drivers. ☝
🌐 Dive into fundamentals—macro economics, COT reports, geopolitical updates, sentiment, intermarket analysis, and index-specific trends. Check the linkss for the full scoop! 🔗🌍
⚠️ **Trading Alert**: News can shake the market! 📰
🔐 Protect your positions:
- Pause new trades during news releases.
- Use trailing stop-loss to lock in gains.
💪 **Join the Heist**: Smash the Boost Button to supercharge our robbery squad! 💥 With Thief Trading Style, we rake in profits daily with ease. 🚀 Your support fuels our market conquests. 🤝❤️
Stay tuned for the next daring heist, money makers! 🤑🐱👤🎯

FTSE 100: Bearish Order flowBearish Crab Pattern via the 1H timeframe. Let's see how this plays out.
There's also an order block at the bottom on the H4 timeframe. Maybe price could go bearish to mitigate it. As they say, false move beginning of the week.

FTSE UK100 Rebound: Navigating Fragile Markets & Resistance Zone📊 FTSE 100 Recovery in Focus: The FTSE 100 has bounced back 📈 after a sharp sell-off, showing signs of recovery. Here's a breakdown of the key points to consider:
📉 Recent Performance: After a steep 4.4% drop on Monday, the FTSE 100 rebounded by 1.9% (+144.29 points) to 7846.37. This recovery mirrors improved global market sentiment 🌏, with indices like the Nikkei 225 surging 6% 🚀 (source: Evening Standard).
🌍 Market Sentiment: Analysts warn that the recovery remains fragile ⚠️, with risks of volatility stemming from geopolitical tensions and trade concerns. However, bargain-hunting investors 🛒 have supported the rebound by targeting undervalued stocks.
📈 Technical Levels: The FTSE 100 is climbing from multi-month lows, with momentum suggesting a potential test of resistance levels. But the rally's sustainability hinges on broader market sentiment and key economic data 📊 (source: Saxo Group).
🧐 Analyst Views: While the recovery is promising, some experts caution it could be a "dead cat bounce" 🐱, where the rally fizzles out if negative news arises. This makes short-term trading decisions highly dependent on intraday developments.
💡 Trade Setup: With the current momentum, a buying strategy for a day trade 🎯 targeting resistance levels may be more favorable than selling at the current level. However, traders must closely monitor intraday sentiment and technical indicators to manage risks effectively.

FTSE 100: Can April's Seasonal Surge Overcome Fiscal Tightening?🌸 April: A Historically Bullish Month for the FTSE 100 📈
Over the past 25 years, April has consistently been the strongest month for the FTSE 100, delivering an average return of 2.28% and boasting a 76% win rate. 🌟 This seasonal strength is driven by several key factors:
📊 Earnings Season Momentum: April is a pivotal month for corporate earnings, with many FTSE 100 companies benefiting from a post-first-quarter earnings boost. 💼
💷 Fiscal Year-End Flows: UK-based funds often adjust their portfolios at the end of the tax year in early April, leading to a reallocation into equities. 🔄
💸 Dividend Reinvestment: As a high-dividend-yielding index, the FTSE 100 typically experiences dividend reinvestment flows in April, further supporting stock prices. 📈
Despite the challenging macroeconomic environment, these seasonal drivers suggest that the FTSE 100 could maintain its historical trend of strong April performance. Notably, even in years with intra-period declines of up to 6.88%, the index has managed to deliver positive returns during this period. 💪
🇬🇧 UK Fiscal Policy and Market Implications 💡
This year, the bullish seasonal trend for the FTSE 100 coincides with significant fiscal developments. On March 26, UK Chancellor Rachel Reeves delivered the Spring Statement, outlining measures to stabilize public finances amidst mounting economic pressures. 📜 According to the Office for Budget Responsibility (OBR), the UK is at risk of missing key fiscal targets, prompting the government to model spending cuts of up to 11%. Welfare programs and green investments 🌱 are expected to bear the brunt of these reductions.
Additionally, the Bank of England's stance on inflation remains a critical factor. 📉 Persistent inflation risks could lead to a more hawkish monetary policy, potentially weighing on rate-sensitive sectors within the FTSE 100. However, the index's strong seasonal pattern, driven by earnings momentum, fiscal year-end flows, and dividend reinvestments, provides a counterbalance to these headwinds. ⚖️
🔮 Outlook for April 2025 🌟
As of late March 2025, the FTSE 100 has shown resilience, with sectors such as energy ⚡ and homebuilders 🏠 leading gains ahead of the Spring Statement. While fiscal tightening and inflationary pressures present challenges, the historical strength of April, combined with supportive seasonal factors, suggests that the FTSE 100 could still deliver positive returns this month. 📅 Investors will closely monitor the impact of fiscal policy adjustments and the Bank of England's monetary stance as they navigate this critical period. 🧐
Not Financial Advice.

UK100 - Expecting The Price To Drop Lower FurtherHi Traders, on March 11th I shared this "UK100 - Looking To Sell Pullbacks In The Short Term"
We expected to see correction prior to the bearish continuation. You can read the full post using the link above.
Price is moving as per the plan!!!
Based on the current scenario my bearish view still remains the same here.
We have bearish divergence in play based on the moving averages of the MACD and I expect the price to drop lower further until the strong resistance zone holds
If you enjoy this idea, don’t forget to LIKE 👍, FOLLOW ✅, SHARE 🙌, and COMMENT ✍! Drop your thoughts and charts below to keep the discussion going. Your support helps keep this content free and reach more people! 🚀
---------------------------------------------------------------------------------------------------------------------
Disclosure: I am part of Trade Nation's Influencer program and receive a monthly fee for using their TradingView charts in my analysis.

Made in England.. FTSE 100 Triangle BreakoutFinally the long term triangle pattern in blue chip UK stocks has broken - and the weekly chart for the FTSE 100 index is looking very positive.
The breakout weekly candle is a long one with a close right near the highs - showing bulls are well in control of the market.
We can see the triangle break in more granular detail on the daily chart with the break confirmed on Thursday and a strong follow-through move on Friday.
Support is found first at the former all time high (8450-8475) then back at the broken trendline from the triangle pattern.
These support levels define our risk - the price back inside the triangle will inform us the breakout has failed - this time at least.
But if things move as we expect, using the height of the triangle pattern as a price objective from the breakout point, the UK 100 could reach 9,000.
But - as always - that’s just how the team and I are seeing things, what do you think?
Share your ideas with us - OR - send us a request!
Comments welcome :)
cheers!
Jasper
The material provided in this article is for information purposes only and should not be understood as trading or investment advice. Any opinion that may be provided on this page does not constitute a recommendation by Trading Writers and has not been prepared in accordance with the legal requirements designed to promote investment research independence. If you rely on the information on this page, then you do so entirely at your own risk.

UK100 (FTSE)-Weekly forecast, Technical Analysis & Trading IdeasMidterm forecast:
8380.25 is a major support, while this level is not broken, the Midterm wave will be uptrend.
Technical analysis:
The ascending flag taking shape suggests we will soon see another leg higher.
A trough is formed in daily chart at 8006.10 on 12/20/2024, so more gains to resistance(s) 8664.21, 8765.00, 9000.00 and more heights is expected.
Take Profits:
8083.43
8183.03
8242.89
8380.25
8485.05
8664.21
8765.00
9000.00
__________________________________________________________________
❤️ If you find this helpful and want more FREE forecasts in TradingView,
. . . . . . . . Hit the 'BOOST' button 👍
. . . . . . . . . . . Drop some feedback in the comments below! (e.g., What did you find most useful? How can we improve?)
🙏 Your support is appreciated!
Now, it's your turn!
Be sure to leave a comment; let us know how you see this opportunity and forecast.
Have a successful week,
ForecastCity Support Team

UK100GBP & NZDJPY Trade RecapApologies for the video cutting off at the end, I was too carried away in flow and forgot TradingView has a 20 minute maximum time limit! 😆
Any questions you have just drop them below 👇
OANDA:UK100GBP - Breakeven
FX:NZDJPY - +3.4%

07.01.24 Morning ForecastPairs on Watch -
FX:USDJPY
FX:EURNZD
FX:NZDJPY
OANDA:UK100GBP
A short overview of the instruments I am looking at for today, multi-timeframe analysis down to what I will be looking at for an entry. Enjoy!

06.01.25 Morning ForecastPairs on Watch -
FX:USDCAD
FX:CADCHF
OANDA:UK100GBP
A short overview of the instruments I am looking at for today, multi-timeframe analysis down to what I will be looking at for an entry. Enjoy!

UK100GB to see a limited rally?UK100 - 24h expiry
Price action looks to be forming a bottom.
A higher correction is expected.
The bias is still for lower levels and we look for any gains to be limited.
Rallies continue to attract sellers.
Further downside is expected although we prefer to sell into rallies close to the 8095 level.
We look to Sell at 8095 (stop at 8171)
Our profit targets will be 7943 and 7780
Resistance: 8110 / 8170 / 8230
Support: 7920 / 7780 / 7710
Risk Disclaimer
The trade ideas beyond this page are for informational purposes only and do not constitute investment advice or a solicitation to trade. This information is provided by Signal Centre, a third-party unaffiliated with OANDA, and is intended for general circulation only. OANDA does not guarantee the accuracy of this information and assumes no responsibilities for the information provided by the third party. The information does not take into account the specific investment objectives, financial situation, or particular needs of any particular person. You should take into account your specific investment objectives, financial situation, and particular needs before making a commitment to trade, including seeking advice from an independent financial adviser regarding the suitability of the investment, under a separate engagement, as you deem fit.
You accept that you assume all risks in independently viewing the contents and selecting a chosen strategy.
Where the research is distributed in Singapore to a person who is not an Accredited Investor, Expert Investor or an Institutional Investor, Oanda Asia Pacific Pte Ltd (“OAP“) accepts legal responsibility for the contents of the report to such persons only to the extent required by law. Singapore customers should contact OAP at 6579 8289 for matters arising from, or in connection with, the information/research distributed.

UK100GBPThis index has been ranging for the past few weeks and it is testing the support zone at 8330.
Let us wait for it to break this zone, wait for a retest so that we can have a clear entry position.

UK100 to find support at market price?UK100 - 24h expiry
Price action looks to be forming a bottom.
This is positive for short term sentiment and we look to set longs at good risk/reward levels for a further correction higher.
Dip buying offers good risk/reward.
We look for a temporary move lower.
Further upside is expected although we prefer to buy into dips close to the 8175 level.
We look to Buy at 8175 (stop at 8135)
Our profit targets will be 8275 and 8295
Resistance: 8480 / 8570 / 8720
Support: 8010 / 7870 / 7725
Risk Disclaimer
The trade ideas beyond this page are for informational purposes only and do not constitute investment advice or a solicitation to trade. This information is provided by Signal Centre, a third-party unaffiliated with OANDA, and is intended for general circulation only. OANDA does not guarantee the accuracy of this information and assumes no responsibilities for the information provided by the third party. The information does not take into account the specific investment objectives, financial situation, or particular needs of any particular person. You should take into account your specific investment objectives, financial situation, and particular needs before making a commitment to trade, including seeking advice from an independent financial adviser regarding the suitability of the investment, under a separate engagement, as you deem fit.
You accept that you assume all risks in independently viewing the contents and selecting a chosen strategy.
Where the research is distributed in Singapore to a person who is not an Accredited Investor, Expert Investor or an Institutional Investor, Oanda Asia Pacific Pte Ltd (“OAP“) accepts legal responsibility for the contents of the report to such persons only to the extent required by law. Singapore customers should contact OAP at 6579 8289 for matters arising from, or in connection with, the information/research distributed.
