Natural Gas: Buy The Rumor Sell The NewsNatural gas spiked higher in the morning session on a strong inventory report.
Natural Gas inventories came in at 53B vs 66B est.
This report is showing a greater demand likely due to the colder temps.
In the afternoon Natural Gas reversed from the highs and sold off.
Ending the day with a Daily topping tail.
Technically the chart pattern in still strong. The 200 MA should be observed as bulls will want to defend that price level.
The Chart is still showing $4.00 target unless we see a failed breakout.
We netted a lovely day trade short today on the live stream.
UNG

Natural Gas Triggers Bullish PatternNatural gas triggered and confirmed a daily chart breakout.
A technical inverse head and shoulders pattern can be observed.
Natural GAs is rallying on colder temperature forecast in the US.
Colder temps often yield more consumption.
Inventories are set to take place on Thursday...the daily 200MA should be watched closely.

Natural Gas & Oil Rally...What You Need to KnowNatural gas price action made a bullish reversal on the daily chart.
Closing up 1.8% ahead of inventories is very aggressive trading by the bulls.
The last couple of inventory prints have been bearish.
Crude Oil inventories sent WTI crude higher.
Energy & oil stocks were very strong today on the drop in oil inventories.
September 19 week inventories dropped by about 3.5 Million barrels.
This is showing a greater demand for oil.
Crude is still chopping around in a very dangerous technical level. Hasn't broken out or down.

Natural Gas Bearish News TodayNatural Gas crumbled off the inventory report this morning.
Natural gas inventories came in at 90B vs 80B consensus.
This larger than expected build shows a weaker demand for Nat Gas during this seasonal period.
Key things to consider:
1. EU moves to accelerate ban on Russian LNG.
2. New Israel–Egypt pipeline coming online
3. China continues to import from Arctic LNG‑2 despite sanctions
4. Japan’s JERA in talks to buy U.S. shale gas assets
5. Gas storage in Germany & winter supply concerns
6. Western Canada storage nearly full; supply glut
7. Canadian production at record levels, but prices very low

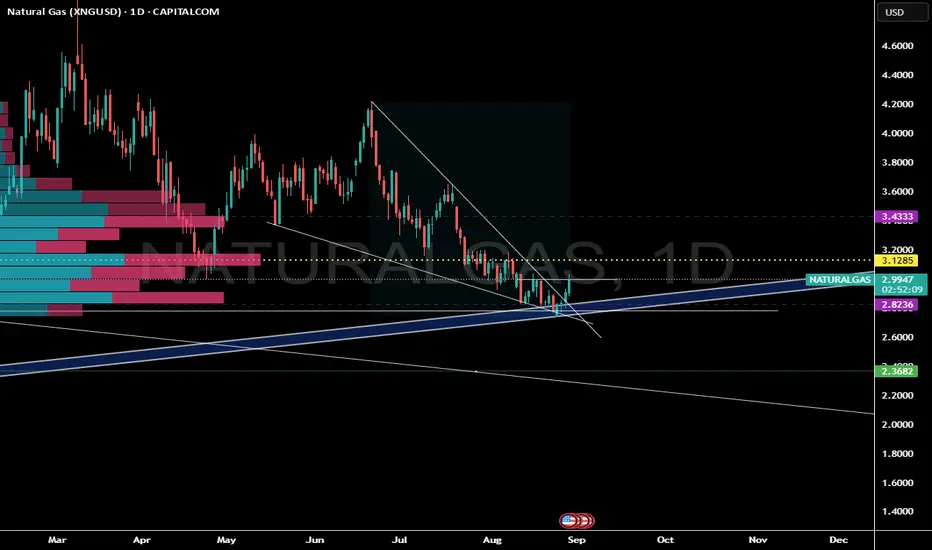
Natural Gas Inventories Today: What You Need To KnowNatural gas is currently holding the 50 Moving average.
Inventories come out tomorrow and could make or break this trend.
I'm keeping it simple and looking for shorts below the 50 MA and longs above.
Nat Gas inventories estimate is 69B build.
Right now the EMA weekly 113 is a tough resistance level.
Consolidation would be best in this commodity to help support the next leg higher.

Natural Gas Surging into Key Moving AverageNatural gas has tagged near term resistance.
We have trimmed and locked in profits on many of the equity trades and the boil trade that we were long.
The entire commodity complex minus oil has been very strong.
Inventory report is tomorrow at 10:30am.
Let see if Nat gas can continue its bullish ascent.
Dont forget to trim profits along the way.

NATURAL GAS: Stunning breakout!Natural Gas has had a wonderful move off the lows.
Breaking out of a falling wedge pattern on inventories.
Inventory report supports higher price. 27B exp build vs 18B actual.
If you have been following our analysis you would have ought to have know to start accumulating into the key weekly gap fill zone.
We have been pounding the table on resource stocks showing relative strength compared to the underlying commodity.
Our members have received several alerts via: AMEX:BOIL , NYSE:EQT NYSE:AR NYSE:RRC and others. We have netted some wonderful profits and it looks like Nat Gas should climb higher after some near term consolidation.
I would like to see Nat gas retest the major volume shelf (POC). That level should be monitored closely.
Gold | Oil | Dollar | Silver | Natural Gas Price Forecast Support & Resistance Guide
Natural Gas NYMEX:NG1! stock Bulls AMEX:UNG
USO NYMEX:CL1! Oil Stock price Forecast
DXY US dollar Stock analysis
Gold COMEX:GC1! XAUUSD Stock price Forecast
Silver XAGUSD stock analysis

Natural Gas Equities Showing Relative StrengthNatural Gas was briefly red today but saw a bit of a bullish recovery.
Price action came very close to filling the weekly downside gap but just missed it.
Inventories are set to be released tomorrow at 10:30am
Interestingly, Nat Gas stocks like NYSE:AR & NYSE:EQT showed great relative strength in the market today.
Is this signaling a pop in Nat Gas price tomorrow?
We are long NYSE:AR calls from yesterday.

Gold | Oil | Dollar | Silver | Natural Gas Price ForecastGold | Oil | Dollar | Silver | Natural Gas Price Forecast
NYMEX:NG1! NYMEX:CL1! COMEX:GC1! COMEX:SI1!

Natural Gas Bullish Recovery?Nat gas has recovered key technical levels with a strong rally today.
Looking at the daily chart we got a close above the 7 MA staging a potential 3 bar surge setup.
Nat gas looks to be targeting 3.18 in the near term...
Inventory report tomorrow: 10B forecast for inventories.
A potential arbitrage opportunity setting up for EQT, upside calls for next week.

Natural Gas Bullish Reversal...Are the Lows in?U.S. natural gas inventories increased by 48 billion cubic feet last week to 3,123 Bcf, increasing the surplus over the five-year average.
Consensus / forecast was 37Billion Cubic feet.
Despite a much higher build than expected Nat gas saw positive price action.
This appears to simply be a dead cat bounce before we go lower.
A death cross on the daily chart has occurred. This signal often results in a small bounce before going lower.

Natural Gas Crisis: Profits were made!Nat Gas plunged to a 1-week low Monday on the outlook for cooler US temperatures.
A report came out that Nat gas has heat peak demand which is scaring investors.
Nat GAs equities got demolished which could indicate that this breakdown is real.
We got rejected off the daily 50 MA & Knifed through the 200 Daily MA.
Some clear technical breakdowns are now in affect.
We banked on EQT put options that ran over 400%. This trade was called out free on our channel. You tube Short.

Gold | Oil | Dollar | Silver | Natural Gas July 2025 Forecast.Gold | Oil | Dollar | Silver | Natural Gas July 2025 Forecast.
NYMEX:NG1! COMEX:GC1! COMEX:SI1! NYMEX:CL1!

Natural Gas - The Epic Reversal? Natural gas had an astonishing move to the upside. Closing up over 5% today.
This volatility can make all tarders head spin if youre not used to it.
Why did Nat gas pop today?
Partly from being oversold and into really good technical support, Natural gas inventories were released today at 10:30am.
The inventories showed a smaller build than the market expected which implies stronger demand. 56B consensus vs 53B actual.
This could potentially be the start to a new bullish trend.
Names like EQT & AR hit some major support today. Some call options on these names have been accumulated.

Gold | Oil | Dollar | Silver | Natural Gas July 2025 Forecast.July 2025 Forecast.
Gold | Oil | Dollar | Silver | Natural Gas
NYMEX:NG1! COMEX:GC1! COMEX:SI1! AMEX:UNG

NATURAL GAS - Who can Predict this wild beast?Natural gas got demolished today, down over 8%.
The one headline we saw hitting the tape that is having some partial influence:
"Vessel Arrives at LNG Canada to Load First Cargo, Strengthening Global Supply Outlook – LNG Recap"
Today, we did hedge our core long UNG position with a short dated $56 put on EQT.
We are already green on that trade and looking for $56 level to come into play.
Natural gas volatility sure trades in a world of its own which is why it is key to size accordingly.

Natural Gas - Silver Lining!Natural gas is ending the day with a daily bottoming tail.
Potentially forming an inverse head and shoulder pattern that takes us above the key $3.83 level.
We took profits on our EQT put hedge! The put contract went up over 100%
Lets see if Nat gas can build some pressure.

Natural Gas plummets - Israel and Iran PeaceIran and Israel de escalation is causing nat gas to plummet.
Fear of the "Hormuz Strait" closing have slipped away!
Roughly 20% of global liquefied natural gas (LNG) trade flows through the Strait of Hormuz, primarily from Qatar (~9.3 Bcf/d) with smaller volumes from the UAE (~0.7 Bcf/d)
In 2024, approximately 83–84% of those LNG volumes were destined for Asian markets—China, India, South Korea

Give It The Gas
I've got a long Idea for the Henry Hub Natural Gas ETF, UNG.
After rising in late-2024/early-2025, UNG fell again (Mar-Jun), but recently (significantly) crossed above the trendline from that down move.
Time to look for a long position. But UNG is volatile - to reduce risk it's best to pick it up after a minor pullback. That seems to be happening now.
One thing I find useful when looking at an ETF backed by a commodity is to look at the chart for the underlying commodity future.
To be clear, I am NOT trading the future, only looking to it for (more) guidance.
In this case, for UNG, I chose the Aug Henry Hub Natural Gas contract (NGQ2025), which TradingView provides 10-minute delayed date for;
Here we see the trendline (light blue) is even stronger (i.e., more points of contact). In addition, the contract made a series of slightly higher lows (yellow line) before breaking through strong resistance at ~3.82 (a level which may now be providing support). Trendline breaks alone can be very flighty - they often don't work - so it helps to have other supporting factors (e.g., higher lows preceding, strong resistance breaks). And, not shown here but useful, UNG/NG is not overbought on the daily chart.
Now one could take a long position here, with a stop below the trendline, but I prefer my knives to at least slow down before I catch them.
Looking at the 4-hour chart for a reversal to enter;
A reversal and close above 3.92 would give a good entry point (using UNG), with a tighter stop at ~3.7 (or ~16.25 on UNG).
This is a "work in progress", so the actual trigger levels may change a bit. Or the whole setup could invalidate itself if the instrument(s) corrects back to at/below the trendline.
For targets, natural gas has resistance at 19.1 and again at 24.0 - best to trail a stop as UNG's price rises, bringing it up as each zone is hit.
For the long position, I anticipate an ITM option ~90 days out. I'm doing this in a taxable account, and for tax purposes UNG issues a K-1 to shareholders. I can do without the hassle. Option holders do not receive K-1's* (unless assigned), making tax reporting more routine.
Time to step on the gas?
*To the best of my knowledge - if any tax experts here know otherwise please drop a comment.
My ideas here on TradingView are for educational purposes only. It is NOT trading advice. I often lose money and you would be a fool to follow me blindly.

Natural Gas | Oil | Dollar | Silver | Gold Price Forecast.Natural Gas | Oil | Dollar | Silver | Gold Price Forecast.
NYMEX:NG1! NYMEX:CL1! COMEX:GC1! COMEX:SI1!

Navigating a Pullback in Natural GasNatural gas prices have been on a wild ride lately, with a recent pullback raising questions about the future of this energy source. This video provides insights into navigating this market volatility, offering actionable strategies for live trading in the midst of uncertainty.
Current weather forecasts for the U.S. show neither extreme heat nor cold—limiting heating or cooling demand. This typical spring-to-summer lull supports low prices .
Although rig counts in the U.S. are falling—the latest count shows an 8‑week decline—production remains ample. Storage levels remain healthy, and oversupply worries persist .
Natural gas rallied earlier today but faced resistance at the $4/mmBtu mark—a major psychological barrier. After hitting that ceiling, prices gave back gains, a typical sign of "rally exhaustion"

Natural Gas Explodes - Bullish Option ContractsTechnical Breakout Observed! Huge upside potential!
Inverse Head & Shoulders breakout on daily chart.
Weekly Bullish Cross 7/20 MA.
- Increased Demand: After a sluggish 2024, demand for natural gas is rebounding—especially for electricity generation in North America and Asia. This is tightening the market and pushing prices up.
- LNG Export Boom: New liquefied natural gas (LNG) export terminals, like the one coming online in British Columbia, are expanding shipping capacity. That’s opening up more international markets and driving up prices domestically.
- Geopolitical Tensions: Broader energy markets are reacting to instability in the Middle East, particularly between Iran and Israel. While this directly impacts oil, it also creates uncertainty across all energy commodities, including natural gas.
- Inventory and Supply Adjustments: After oversupply in 2024, producers are now recalibrating. But with inventories still low in some regions, prices are sensitive to even small disruptions
