#UNI/USDT Forming Bullish Continuation#UNI
The price is moving within a descending channel on the hourly timeframe. It has reached the upper boundary and is heading towards breaking it. A retest of this boundary is expected.
The Relative Strength Index (RSI) is showing an upward trend, as it has approached the upper boundary. A bearish reversal is expected.
There is a key support zone in green at 5.10. The price has bounced from this zone several times and is expected to bounce again.
A consolidation trend is observed above the 100-period moving average, which we are approaching. This trend supports a decline towards this level.
Entry Price: 5.36
Target 1: 5.40
Target 2: 5.60
Target 3: 5.79
Stop Loss: Above the green support zone.
Remember this simple thing: Money management.
For any questions, please leave a comment.
Thank you.
Unibtc

#UNI/USDT Forming Bullish Continuation#UNI
The price is moving in a descending channel on the 1-hour timeframe. It has reached the lower boundary and is heading towards a breakout, with a retest of the upper boundary expected.
We are seeing a bearish bias in the Relative Strength Index (RSI), which has reached near the lower boundary, and an upward bounce is expected.
There is a key support zone in green at 5.58, and the price has bounced from this level several times. Another bounce is expected.
We are seeing a trend towards stabilizing above the 100-period moving average, which we are approaching, supporting the upward trend.
Entry Price: 5.73
First Target: 5.90
Second Target: 6.12
Third Target: 6.36
Place your stop-loss order below the green support zone.
Remember a simple principle: Money Management.
For any questions, please leave a comment.
Thank you.

UNI Analysis (4H)A trigger line has been broken on the chart. We have a bullish CH, and a Three Drive pattern is also visible at the bottom. These patterns usually push price upward toward the nearest supply zone. Price has been fueled from a strong origin, suggesting sufficient buy-side orders.
We currently have two re-buy entry points. If price pulls back to the downside, we can enter the position using a DCA approach.
The targets are marked on the chart.
Please note: if price reaches our entry zones before touching the red supply zone, we will enter the position. However, if price first reaches the supply zone and then returns to our entry area, we will not enter.
A daily candle close below the invalidation level will invalidate this analysis.
For risk management, please don't forget stop loss and capital management
When we reach the first target, save some profit and then change the stop to entry
Comment if you have any questions
Thank You

FireHoseReel | Uniswap Is Approaching a Market Decision Zone🔥 Welcome To FireHoseReel !
Let’s jump into Uni Swap (UNI) market analysis.
👀 UNI 4H Overview
UNI is currently trading inside a range box, with resistance at $5.858 and support at $5.445.
A breakout from either side can lead to a major move. Looking at the chart history, every strong upside move has been followed by a deep correction, yet the impulses themselves have been very sharp and aggressive.
📊 Volume Analysis
UNI volume on Binance is currently not very strong, so clear confirmation is still missing.
However, when UNI starts printing high volume on Binance as well, it signals increased trader attention.
A rise in volume would be a logical confirmation for the next price move.
✍️ UNI Trading Scenarios
🟢 Long Scenario:
A breakout above $5.858 can activate our long trigger, but this setup requires a clear increase in buying volume for confirmation.
🔴 Short Scenario:
A breakdown below the $5.44 support can push price toward the next demand zone.
This move should be confirmed with a strong rise in selling volume, making it a valid short opportunity.
🧠 Protect your capital first. No setup is worth blowing your account. If risk isn’t controlled, profit means nothing. Trade with rules, not emotions.

UNI Looks Bearish (1H)From the point where we marked the red arrow on the chart, the UNISWAP correction has begun, and the pattern appears to be a diametric.
The best area for wave F to complete is the highlighted red zone. If the price reaches this zone, we will look for Sell/Short positions.
The stop-loss and targets are also marked on the chart.
For risk management, please don't forget stop loss and capital management
When we reach the first target, save some profit and then change the stop to entry
Comment if you have any questions
Thank You

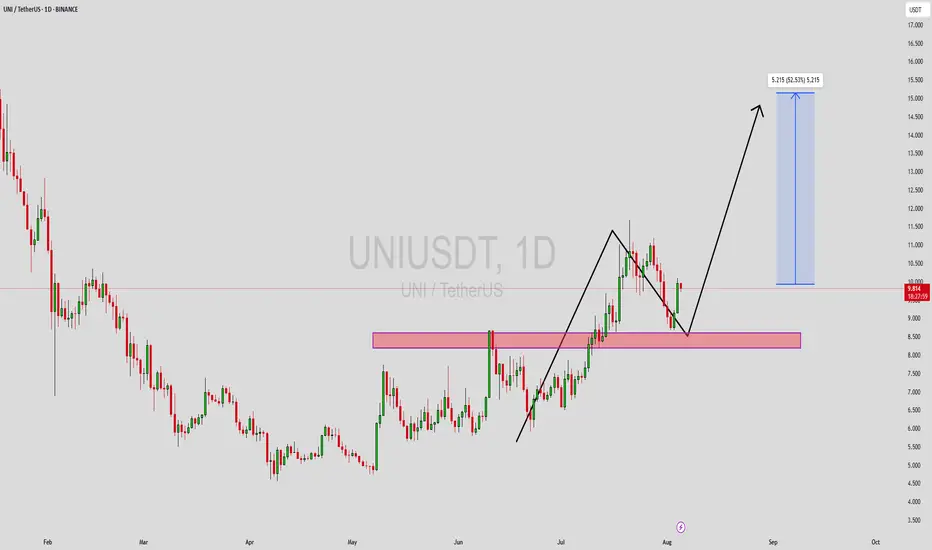
UNIUSDT Forming Bullish ContinuationUNIUSDT is currently presenting a compelling bullish continuation setup, as evidenced by the recent price action retesting a major support zone that previously acted as strong resistance. This key area, highlighted on the chart, has flipped to support—indicating a potential launchpad for the next impulsive move. The price has respected this zone and is already showing signs of a rebound, which may lead to a fresh leg upward in the near term.
The chart analysis points to a potential 52%+ gain from current levels, with a clear projection toward the $15.00 mark. The current pullback appears healthy within an overall bullish structure. UNI's steady volume during this phase further validates investor confidence, supporting the potential for a strong recovery rally. Technical traders often look for such clean price action following a breakout and successful retest of critical levels.
Fundamentally, UNI (Uniswap) remains one of the leading decentralized exchange protocols, and its continued development in DeFi space keeps it highly relevant. The market seems to be recognizing this with renewed buying interest. If current market sentiment remains bullish and broader conditions support altcoin growth, UNI could reach its projected upside in a relatively short timeframe.
With a strong technical setup, supportive volume, and renewed investor attention, UNIUSDT is shaping up to be a promising trade idea for mid-term swing traders and investors.
✅ Show your support by hitting the like button and
✅ Leaving a comment below! (What is You opinion about this Coin)
Your feedback and engagement keep me inspired to share more insightful market analysis with you!
#UNI/USDT#UNI
The price is moving within a descending channel on the 1-hour frame, adhering well to it, and is heading toward a strong breakout and retest.
We are experiencing a rebound from the lower boundary of the descending channel, which is support at 7.78.
We are experiencing a downtrend on the RSI indicator that is about to be broken and retested, supporting the upward trend.
We are looking for stability above the 100 Moving Average.
Entry price: 7.85
First target: 8.19
Second target: 8.53
Third target: 8.85

#UNI/USDT#UNI
The price is moving within a descending channel on the 1-hour frame, adhering well to it, and is heading for a strong breakout and retest.
We are experiencing a rebound from the lower boundary of the descending channel, which is support at 5.82.
We are experiencing a downtrend on the RSI indicator, which is about to break and retest, supporting the upward trend.
We are looking for stability above the 100 Moving Average.
Entry price: 6.15
First target: 6.53
Second target: 6.93
Third target: 7.33

UNIUSDT Forming Bullish ReversalUNIUSDT is showing a classic bullish reversal pattern, marked by a clear W-shaped recovery, which is often a strong signal for trend reversal in crypto markets. The recent breakout has come with good volume support, further validating the strength of this move. The price action suggests a clean structure of higher highs and higher lows, indicating the start of a potential upward leg. Based on the pattern and momentum, we can expect a price gain in the range of 50% to 60% in the coming sessions.
From a technical perspective, this bullish formation aligns with an inverse head-and-shoulders structure, often seen at the end of prolonged downtrends. The price has reclaimed key resistance levels and is now consolidating above them, a sign that buyers are stepping in with confidence. The clear breakout candle and measured move projection both support the potential target range of $12 to $13 in the near term.
Fundamentally, UNI continues to be one of the most recognized names in the DeFi space, and growing ecosystem updates have attracted renewed interest from both retail and institutional investors. The recent uptick in trading volume and social media chatter surrounding UNI indicates rising momentum and strong investor sentiment. As the market rotates back into high-utility tokens, UNI is likely to remain in the spotlight.
For traders, keeping an eye on short-term pullbacks or consolidation zones around $8.00–$8.50 could offer ideal entries before the next breakout leg begins. Overall, UNIUSDT stands poised for a major bullish continuation if current market conditions persist and broader crypto sentiment remains positive.
✅ Show your support by hitting the like button and
✅ Leaving a comment below! (What is You opinion about this Coin)
Your feedback and engagement keep me inspired to share more insightful market analysis with you!

UNI Sell/Short Setup (4H)The overall structure in UNI is bearish, considering the recent CH (Change of Character) observed in the swing.
The price is currently below the resistance line, and if it approaches the premium zone of the previous minor wave, we can look for sell/short positions based on UNI’s overall outlook. The zone where we are interested in entering a position is marked with a red circle.
The target can be the green box.
A daily candle close above the invalidation level would invalidate this analysis.
For risk management, please don't forget stop loss and capital management
When we reach the first target, save some profit and then change the stop to entry
Comment if you have any questions
Thank You

#UNI/USDT Ready to launch upwards#UNI
The price is moving in a descending channel on the 4-hour frame and is adhering to it well and is heading to break it strongly upwards
We have a bounce from the lower limit of the descending channel, this support is at a price of 10.23
We have a downtrend on the RSI indicator that is about to be broken, which supports the rise
We have a trend to stabilize above the moving average 100
Entry price 11.80
First target 12.78
Second target 14.11
Third target 15.75

#UNI/USDT Ready to go higher#UNI
The price is moving in a descending channel on the 1-hour frame and sticking to it well
We have a bounce from the lower limit of the descending channel, this support is at 14.00
We have a downtrend on the RSI indicator that is about to be broken, which supports the rise
We have a trend to stabilize above the 100 moving average
Entry price 14.50
First target 15.00
Second target 15.61
Third target 16.35

#UNI/USDT#UNI
The price is moving in an ascending channel on the 1-day frame and is sticking to it very well and is about to break higher
We have a bounce from the lower limit of the channel at 6.37
We have an ascending trend on the RSI indicator that is about to break, which supports the rise
We have a trend to stabilize above the 100 moving average
Entry price 7.16
First target 8.90
Second target 10.00
Third target 11.62

UNI is bearishThe structure is bearish on large time frames.
The liquidity pools in the upper part of the chart have been swept and now the price is going to move towards the liquidity pools in the lower part of the chart.
The short-term target is the demand range.
In the long term, our buy position is the place we specified at the bottom of the chart.
Closing a daily candle above the invalidation level will violate the analysis
Note that the financial market is risky, so:
Do not enter a position without setting a stop and capital management and confirmation and trigger.
When we reach the first TP, save some profit and try to move the stop continuously in the direction of your profit.
If you have any comments please post them, comments will help us improve our performance
Thanks

🦄 UNI Long 🦄if everything remains the same, there is a high probability that UNI will continue in the bullish channel .
It passed the 38.2 Fib Fan level, I would expect it to reach 61.8 at least
What do you think?

#UNI/USDT#UNI
We have a bearish channel on a 4-hour frame, the price moves within it and adheres to its borders well at this price.
We have a fundamental support area at $10
We have a higher stability moving average of 100
We have a downtrend on the RSI that is about to break higher
Entry price is 11.16
The first goal is 11.96
Second goal 14.16
Third goal 16.00

UNI looks bullishUNI looks to be inside the bullish wave C. The degree of this wave is big and it is expected that this wave will continue for months.
The SWAP range is the right place for buy/long positions.
The targets are clear on the chart. Note that these targets are medium term.
Closing a daily candle below the invalidation level will violate the analysis
For risk management, please don't forget stop loss and capital management
When we reach the first target, save some profit and then change the stop to entry
Comment if you have any questions
Thank You

UNI is moving along the channelUNI is moving along the channel.
🔵Entry Zone 12.230 - 12.467
🔴SL 11.291
🟢TP1 13.387
🟢TP2 14.798
Risk Warning
Trading Forex, CFDs, Crypto, Futures, and Stocks involve a risk of loss. Please consider carefully if such trading is appropriate for you. Past performance is not indicative of future results.
If you liked our ideas, please support us with your likes 👍 and comments.

#UNI/USDT#UNI
The pair has recently witnessed noticeable price movement
After falling for a long time
The price recently touched the downtrend, from which a price correction is expected
Current price 4.57
First goal 6.85
Second goal 9.78
Please note that the price is on its way to the targets and may be exposed to ups and downs at intervals that are expected to take time to reach the targets.

#UNI/USDT#UNI
The price has been moving in a downward channel since August 2022
The price is now on its way to a downward trend
The price now is 5.47 $
First goal 6.63 $
Second goal 7.73 $
Third goal 9.0 $
Which represents 210 % of the current price
With significant oversold and upward momentum
We also find that the MACD indicator is highly oversold
All of this supports the falling channel pattern, whose upper trend we are about to reach
We have a big support area on the chart at the price of 4.5 $

UNI ANALYSIS (4H)structure according to bearish CH And iBOS is bearish.
The previous lows have all been cleared and the price has hit a support.
Now we need a range where there is a significant sell order to continue the decline.
We have marked the good area where there is a sell order on the chart. It is expected that the price will reach this range with fluctuations and then we will see a drop
For risk management, please don't forget stop loss and capital management
When we reach the first target, save some profit and then change the stop to entry
Comment if you have any questions
Thank You

UNI ANALYSIS (1D)We seem to be in a big wave B which consists of 3 ABC waves. Wave B of B looks like a diametric, now we are inside the g wave of this diametric. In the red box, the rise of this coin can end and enter the falling wave C.
For risk management, please don't forget stop loss and capital management
Comment if you have any questions
Thank You

UNIUSDT Good Bullish!UNIUSDT Technical Analysis Update
The price of UNIUSDT is about to break its trend resistance line, and the volume is increasing on the daily chart. I am expecting a bullish move in UNIUSDT in the coming days.
Buy zone : Below $5.65
Stop loss : $4.80
Swing Trade
Regards:
Hexa
