Bitcoin Sitting on Crucial 50 EMA Support!Finally, CRYPTOCAP:BTC has reached a key confluence zone, sitting right on the 50 EMA support, a level that has acted as dynamic support since 2023.
Technically, I’m expecting a potential bounce from here. However, if the current candle fails to reclaim this support, we could see a deeper correction, especially with ongoing geopolitical uncertainty weighing on the market. 📉
DYOR, NFA
Thanks for reading! Appreciate your support and engagement
Unichartz

EURJPY Reaction Zone AheadOANDA:EURJPY is showing signs of weakness after a strong rally.
The pair is now approaching a key support zone, which also aligns with an unfilled gap.
A retest of this area could attract buyers, but if it fails to hold, we might see a deeper pullback in the short term.
DYOR, NFA

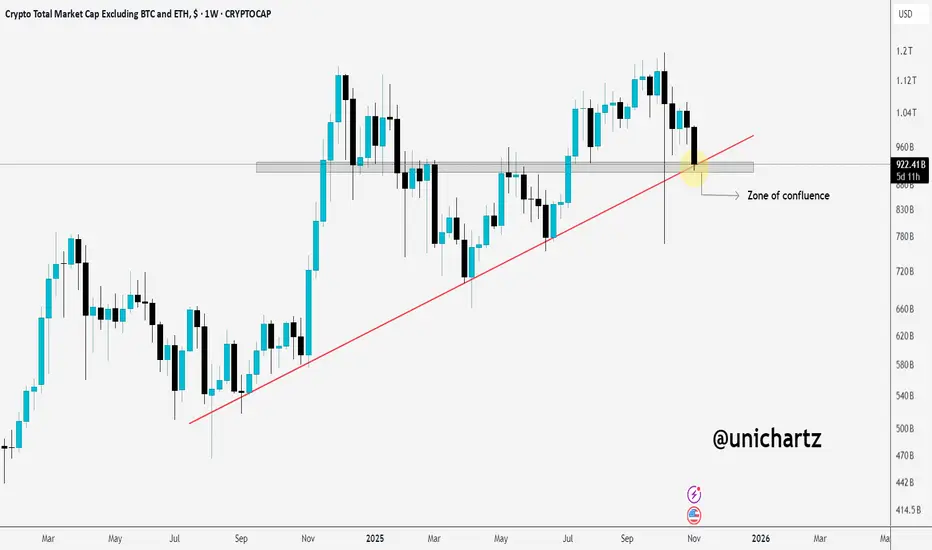
Altcoins at a Turning Point, Can Bulls Defend This Level?Altcoins are currently hovering at a critical zone of confluence, where horizontal support meets the rising trendline. A strong bounce from here could revive bullish momentum, but a breakdown below this level might open the door for deeper corrections.
This is a make-or-break area for the broader altcoin market.
Stay alert.
NFA
USDT.D Eyeing Resistance, Altcoin Holders Stay Alert!USDT.D is trading right at the edge of a breakout near the resistance zone. If it manages to break above, we could see another sharp drop in altcoins in the coming days.
However, a rejection here might give altcoins some much-needed breathing room.
DYOR, NFA
#PEACE

ETH Weakening Near Support, Big Move Loading?CRYPTOCAP:ETH is currently trading near a key support zone, which has held strong multiple times in the past. The price has been consolidating between this support and the mid S/R zone, showing that both bulls and bears are battling for control.
If ETH manages to break and sustain above the mid S/R zone, we could see a potential upside continuation toward higher levels. However, if the price fails to hold this key support and closes below it, a deeper correction toward the lower support zone could be on the table.
For now, ETH looks weaker day by day, so it’s important to keep a close eye on how the price reacts around this zone, a decisive move could set the tone for the next big trend.
DYOR, NFA

Strong Recovery, Key Level Ahead $TRUMPAfter the recent crash, $TRUMP/USDT has made a strong comeback, recovering sharply from the bottom with solid momentum.
On the daily timeframe, the price has successfully broken above the key resistance trendline, showing clear bullish intent. However, it’s now testing a major resistance on the weekly chart.
If the price manages to break and close above this weekly resistance trendline, it could trigger an explosive upside move for TRUMP.
DYOR, NFA
Thanks for reading! Appreciate your support and engagement 🙏

ETH: Range-Bound, But Breakdown Could Get UglyOn the CRYPTOCAP:ETH daily chart, the mid-zone is acting as a clear barrier. The price is currently consolidating within a range, caught between the key support zone and this mid S/R zone.
A breakout above could trigger a strong move higher, while a breakdown here would be a scary scenario for the overall market.
DYOR, NFA
Thanks for reading! Appreciate your support and engagement 🙏

BTC: Hold Here or Drop to 104K?CRYPTOCAP:BTC is currently retesting a crucial zone after facing rejection from the recent resistance area.
This “important zone” around $111K–$110K will likely decide the next move, a strong hold here could trigger a bounce back toward the highs, while a breakdown below it might open the doors toward $108K or even $104K.
In short — this is a key make-or-break level. Keep a close eye on how the daily candle closes here.
DYOR, NFA
#BTCUSDT #unichartz

TAO Could Explode if This Zone BreaksBINANCE:TAOUSDT has been repeatedly testing the resistance zone and is now making another strong attempt with solid momentum.
If the price manages to break and close above this zone, it could trigger a massive upside move. Keep a close eye, momentum is building up fast.
DYOR, NFA

History Repeats? BTC Dominance Rejected at the Same Zone AgainBTC Dominance is currently facing rejection from the key resistance zone after multiple failed attempts to break above it.
If it continues to struggle here and fails to reclaim the upper zone, a potential drop could follow — which might give altcoins some room to breathe and rally.
Keep an eye on how dominance reacts here; this zone has historically triggered major trend shifts across the market.
DYOR, NFA
Thanks for reading! Appreciate your support and engagement 🙏

ZCASH Breaks 3-Year Accumulation!$ZCASH has finally broken above its 2021 high after spending over three years in a long accumulation phase. This breakout above the major resistance zone signals a clear shift in momentum and could mark the start of a strong bullish cycle.
As long as the price holds above the breakout zone, the structure remains solid, any retest toward $240–$260 could offer a healthy entry point before the next leg higher. Momentum looks powerful here.
DYOR, NFA

ETH Support Holding, But Cracks ShowingAs long as CRYPTOCAP:ETH holds the key support zone, the overall structure remains bullish and there’s nothing to worry about.
However, the technical setup is starting to weaken, a break below this support could turn things ugly, especially for altcoins.
DYOR, NFA
#PEACE
Thanks for reading! Appreciate your support and engagement 🙏

AIXBT Approaching Breakout Zone$AIXBT/USDT has fully recovered from the recent crash and is now trading near a key resistance, a level that previously acted as strong support.
If the price manages to close above this zone, it could trigger a massive upside move. Definitely one to keep a close eye on.
DYOR, NFA

SOL at Support, History Could Repeat$SOL/USDT Analysis
SOL continues to respect its long-term rising support line beautifully. Each time it has accumulated around this trendline, we’ve seen a strong rally follow, and the same pattern seems to be forming again.
Right now, SOL is in another accumulation phase, holding well above the key support zone. If history repeats itself and the price sustains this level, we could see another explosive move toward new highs.
DYOR, NFA
Thanks for reading! Appreciate your support and engagement 🙏

HYPE/USDT Price Heating UpGETTEX:HYPE is showing a nice bounce from the key support zone, holding that area quite well. The price is now approaching a minor resistance around the trendline.
If it manages to break and close above this line, we could see a strong upside move in the coming sessions.
DYOR, NFA
PEACE

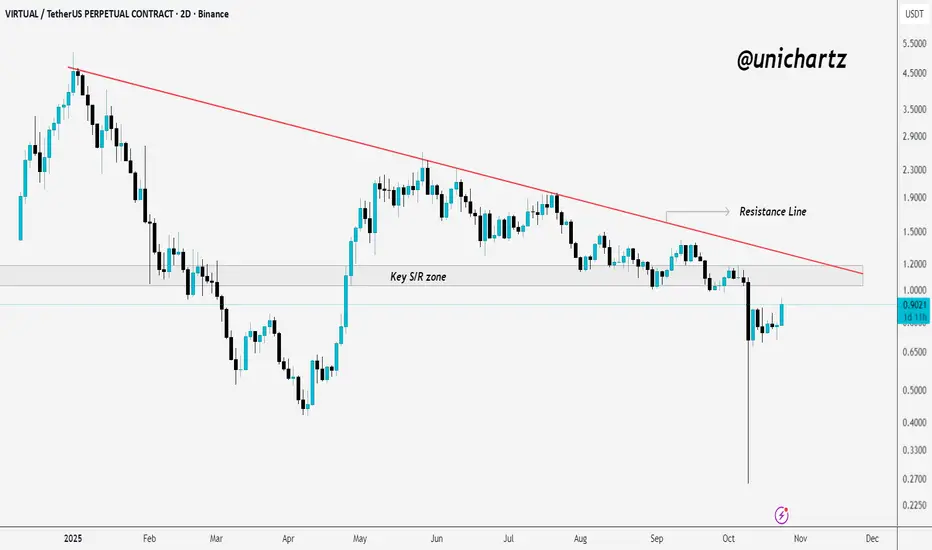
VIRTUAL Rebounds Strongly but Faces Key ResistanceSPARKS:VIRTUAL has rebounded strongly from the bottom after the recent drop but is still trading below the resistance zone, which once acted as key support.
A breakout and close above this zone could signal a shift in momentum and open the way for further upside, while rejection here might lead to a short-term pullback.
DYOR, NFA
GBP/JPY Support Flip in ActionLong-term vibe (2W chart):
GBP/JPY's been cursing upwards since 2020, riding that strong support line. It's like the pair's got a safety net, and as long as it holds above this line, the trend's buddy-buddy with the bulls.
Short-term play (1D chart):
Check it, on the daily chart, GBP/JPY broke above a key resistance zone, and now that level turn into support. It's like getting a green light for a potential push higher. We're chillin' around the 203-204 zone now, if this holds, we're prob looking at higher targets.
Putting it together:
Long-term trend's up, and short-term breakout saying "hey, maybe more upside". If GBP/JPY hangs out above 203-204, bulls might keep pushing it higher.
DYOR, NFA
Thanks for reading! Appreciate your support and engagement 🙏

DXY Forming a Strong Base – Reversal Ahead?U.S. Dollar Index TVC:DXY – Daily Analysis
After a long downtrend, the Dollar Index seems to be forming a strong base at the bottom, as highlighted by multiple bounces from the same support zone. This area has been acting as a reliable floor, preventing further downside.
Currently, the price has also broken above the descending trendline, showing early signs of strength. If the price holds above this breakout, we could see a move toward the 100–101 zone, which is the next key resistance area.
However, if the price dips back below the trendline, a retest of the base zone near 97.00 could take place before any potential continuation higher.
Summary: DXY is showing a potential reversal structure. A sustained move above the trendline could confirm the start of a stronger bullish phase.
DYOR, NFA
Thanks for reading! Appreciate your support and engagement 🙏

EUR/USD Approaching Critical Zones: What’s Next? On the upside, the key resistance zone around 1.1880–1.1900 has capped rallies multiple times. A break above this level could open the door for a strong upward move.
On the downside, if price fails to hold the ascending support line, it could drop toward the key support zone around 1.1300–1.1350.
Summary: Watch how price reacts around the ascending support line, this will likely dictate the next big move.
DYOR, NFA
Thanks for reading! Appreciate your support and engagement 🙏

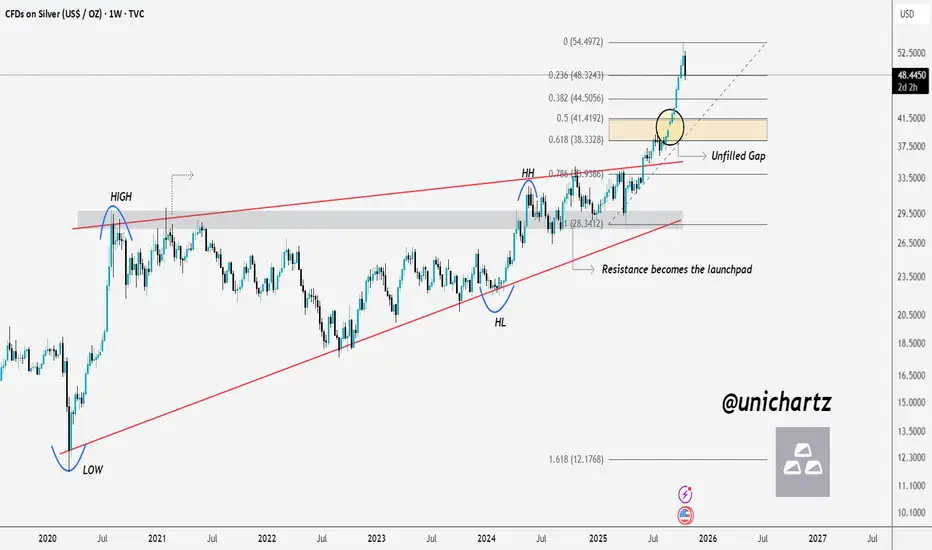
Correction Incoming – Silver Eyes Fib ZoneSILVER Weekly Analysis 🪙
At first, Silver faced strong rejection from the resistance zone, but once it finally broke out, the price came back to retest that same resistance — which then turned into a powerful launchpad, sending prices to new all-time highs.
Currently, the price is showing early signs of a correction. I’m expecting a possible retest of the Golden Fib Zone (0.5–0.618), where there’s also an unfilled gap near the 0.5 level. A move toward that area would make sense before the next major leg higher.
Resistance becomes the launchpad.
DYOR, NFA
Thanks for reading! Appreciate your support and engagement 🙏
USDT.D Breaks Out, Altcoin Correction Ahead?USDT.D has broken above the resistance trendline and is now forming higher highs and higher lows, a clear sign of a bullish structure shift.
If the price breaks above the next resistance, we could see more correction across altcoins.
Keep an eye on USDT.D and stay tuned for further updates.
DYOR, NFA

$GOLD Rally Pause – Will the Golden Fib Hold?TVC:GOLD has seen a strong rally after months of accumulation, but the recent sharp pullback looks like a healthy correction rather than a trend reversal.
Currently, price is approaching the Golden Fib Zone (0.5–0.618), an area that often acts as a strong support during ongoing uptrends. If the price manages to hold this zone and form a solid base, we could see the next leg higher, potentially leading to new highs.
For now, the focus remains on how price reacts at this Fib zone, a bounce here could confirm continuation, while a breakdown below may signal a deeper correction.
DYOR, NFA
THANKS FOR THE READING

ETH Consolidating Before the Next Move$ETH/USDT has been trading sideways for the past 74 days, holding strong at the confluence of the rising trendline and key support zone. This prolonged consolidation suggests that both buyers and sellers are in a state of equilibrium, waiting for a decisive move.
A breakout on either side could set the tone for the next major trend. If ETH manages to hold this support and gain momentum, we might see a strong recovery toward the upper resistance levels.
However, if it loses this zone, a deeper correction could follow before any significant upside move.
DYOR, NFA
PEACE
