UNIUSDT 3,752% profits potential with 7X leverage —LONG tradeThis is a truly great chart setup. This same day a low was hit and the action is already turning green. Four weeks closed red.
A very strong yet high probability target is $17. A target that will hit with 100% certainty if a bullish wave develops is $9.3. The higher targets are a possibility if the bullish wave we are about to experience becomes awesome.
If you are the conservative type, I just shared the levels that you should be focusing on. If you are the risk taker, then you can aim higher... Whatever works for you.
Uniswap is truly an amazing Cryptocurrency project. Most of everything in this market is awesome. I love this market. I love Crypto. I love you.
It will get better with each passing day. We are yet to witness the start, it will be an incredible bullish wave. A long time in the making... The longer it takes to unfold, the stronger the wave that follows. It is now or never...
Full trade-numbers for Uniswap below:
___
LONG UNIUSDT
Leverage: 7X
Potential: 3752%
Allocation: 8%
Entry zone: $4.44 - $4.95
Targets:
1) $5.64
2) $6.33
3) $7.47
4) $8.39
5) $9.31
6) $10.6
7) $12.3
8) $14.8
9) $17.1
10) $20.1
11) $22.2
12) $24.9
13) $30.1
Stop: Close weekly below $4.25
___
Do you agree with this analysis and chart setup?
If you are going to take this trade, leave a comment.
Thank you for reading.
Namaste.
Uniusdt

#UNI/USDT Forming Bullish Continuation#UNI
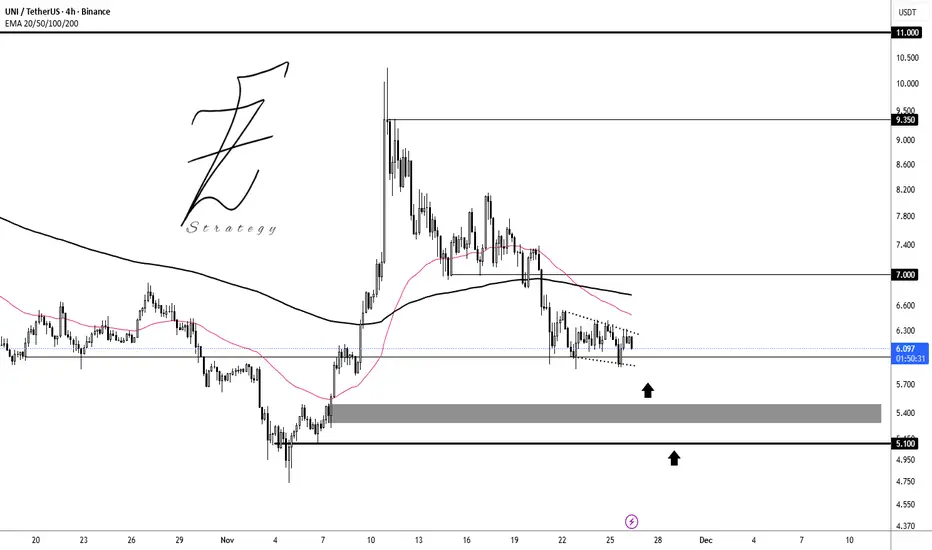
The price is moving within a descending channel on the hourly timeframe. It has reached the upper boundary and is heading towards breaking it. A retest of this boundary is expected.
The Relative Strength Index (RSI) is showing an upward trend, as it has approached the upper boundary. A bearish reversal is expected.
There is a key support zone in green at 5.10. The price has bounced from this zone several times and is expected to bounce again.
A consolidation trend is observed above the 100-period moving average, which we are approaching. This trend supports a decline towards this level.
Entry Price: 5.36
Target 1: 5.40
Target 2: 5.60
Target 3: 5.79
Stop Loss: Above the green support zone.
Remember this simple thing: Money management.
For any questions, please leave a comment.
Thank you.

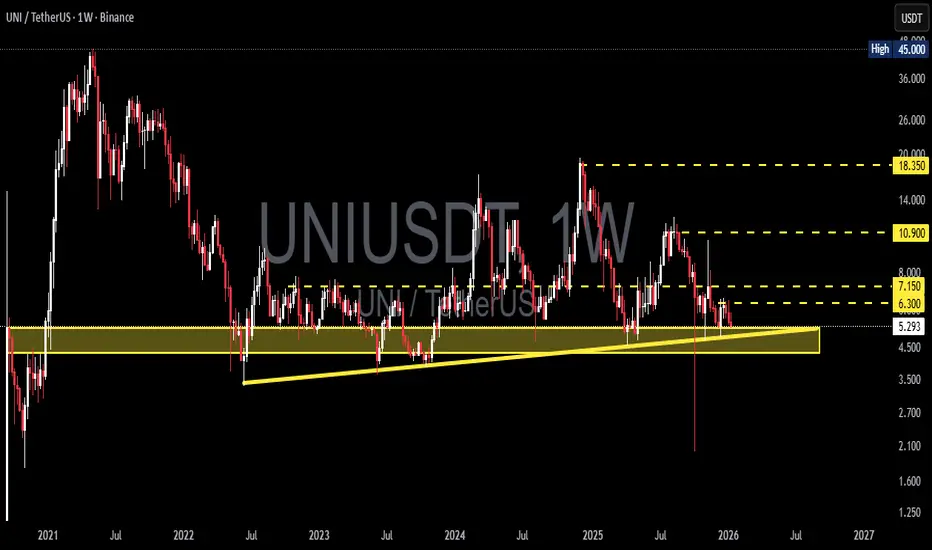
UNI/USDT at Critical Support — Accumulation or Breakdown?UNI/USDT is currently trading on the Weekly (1W) timeframe and remains within a broad range following a prolonged downtrend from its historical peak. Price has returned to test a key demand zone (yellow box 5.2 – 4.3), which has acted as a strong historical support since 2022.
The current market structure reflects compression and re-accumulation, indicating that UNI is positioned at a critical decision area for medium- to long-term price direction.
---
Key Levels & Zones
Major Demand / Accumulation Zone: 5.2 – 4.3 (yellow zone – critical support)
Intermediate Resistance: 6.3 – 7.15
Major Resistance: 10.9
Upper Resistance / Bullish Target: 18.35
ATH Reference: 45.00
---
Pattern & Structure Explanation
1. Ascending Support Trendline (Weekly)
A clear rising trendline can be observed from the 2022 → 2023 → 2024 lows. Price is still holding above this trendline, keeping the higher-low structure intact.
2. Range Accumulation (Wyckoff-like Structure)
Since 2023, price has been moving sideways within a broad range. The yellow zone acts as a Spring / Last Point of Support (LPS).
3. Long Wick Rejection
Strong lower-wick rejections indicate active buyers defending the demand zone.
---
Bullish Scenario
As long as price holds above the 5.2 – 4.3 zone, the bullish scenario remains valid.
Bullish confirmation strengthens if:
Weekly close holds above 5.2
Break and close above 6.3 – 7.15
Bullish Targets:
1. 7.15 (minor range high)
2. 10.90 (major resistance)
3. 18.35 (upper range / supply zone)
A breakout above 10.9 could shift the structure into a macro bullish continuation.
---
Bearish Scenario
The bearish scenario activates if:
A strong weekly close below 4.3
Breakdown of the ascending support trendline
Bearish implications:
Higher-low structure fails
Potential continuation toward 3.5 – 3.0
In extreme conditions, a revisit of 2.0 – 2.5
A breakdown of the yellow zone would signal failed accumulation and bearish continuation.
---
Conclusion
UNI/USDT is currently trading at a major long-term decision zone.
The 5.2 – 4.3 area remains the key level to watch:
Holding the zone → potential reversal and upside expansion
Losing the zone → bearish continuation
The market has not yet confirmed direction, making weekly candle confirmation critical before taking aggressive positions.
#UNIUSDT #UNISWAP #CryptoAnalysis #WeeklyChart #AccumulationZone #DemandZone #SupportResistance #AltcoinAnalysis
UNIUSDT long setup on the 45min TFUNIUSDT long setup on the 45min TF
Entry: 5.435
SL: 5.34
TP1: 6.03
TP2: 6.30
RR: 1:3
Strategy: Bullish divergence with a break of the lower high (LH)

#UNI/USDT Forming Bullish Continuation#UNI
The price is moving in a descending channel on the 1-hour timeframe. It has reached the lower boundary and is heading towards a breakout, with a retest of the upper boundary expected.
We are seeing a bearish bias in the Relative Strength Index (RSI), which has reached near the lower boundary, and an upward bounce is expected.
There is a key support zone in green at 5.58, and the price has bounced from this level several times. Another bounce is expected.
We are seeing a trend towards stabilizing above the 100-period moving average, which we are approaching, supporting the upward trend.
Entry Price: 5.73
First Target: 5.90
Second Target: 6.12
Third Target: 6.36
Place your stop-loss order below the green support zone.
Remember a simple principle: Money Management.
For any questions, please leave a comment.
Thank you.

UNI / USDT Waiting for Liquidity Grab — Safer Entry at $5.46UNI / USDT is looking strong at current levels, but for a safer entry we are watching the $5.46 zone to allow liquidity below the higher lows and a fill of the 4H FVG. A clear reaction from this area would offer a much better risk-to-reward setup. Manage risk wisely, as buying at current price does not offer a favorable R:R.

UNI - Long idea.BINANCE:UNIUSDT.P
I am waiting for a reaction at this level. The nearest target is to break through the $6.1 high.
Add it to your watch list. Set alerts and wait for the price to approach the level.
I will not short. I will work strictly from the level.

UNI/USDT – Bullish Momentum Builds But Resistance Looms at $6.26Uniswap (UNI) has surged nearly 35% from its December 18th low, igniting stop-loss runs above prior swing highs and establishing clear upside momentum.
The rally left behind a bullish daily gap between $6.06 and $5.38, which now serves as a key support zone.
🗳️ This price action coincides with the start of a new governance vote, adding fundamental interest. However, $6.26 – where sellers last pushed back on Dec 20th – remains the critical resistance bulls must flip for continuation.
🔼 Bullish Targets (if $6.26 breaks):
$6.57 – Prior distribution zone (week of Nov 10).
$6.73 – Bearish daily gap (Nov 20).
$7.18 – Major resistance (week of Nov 17), where bears previously regained control.
🔽 Bearish Scenarios (if support fails):
$5.20 – December 17 open; key line of defense.
Below that: $4.86 (Dec 18 swing low) becomes vulnerable.
These levels also align with the mid-point of last week’s long wick, adding further confluence.
📊 Momentum favors bulls for now, but watch how UNI reacts at $6.26—it's the gate to further upside or potential rejection.

UNI Analysis (4H)A trigger line has been broken on the chart. We have a bullish CH, and a Three Drive pattern is also visible at the bottom. These patterns usually push price upward toward the nearest supply zone. Price has been fueled from a strong origin, suggesting sufficient buy-side orders.
We currently have two re-buy entry points. If price pulls back to the downside, we can enter the position using a DCA approach.
The targets are marked on the chart.
Please note: if price reaches our entry zones before touching the red supply zone, we will enter the position. However, if price first reaches the supply zone and then returns to our entry area, we will not enter.
A daily candle close below the invalidation level will invalidate this analysis.
For risk management, please don't forget stop loss and capital management
When we reach the first target, save some profit and then change the stop to entry
Comment if you have any questions
Thank You

UNI/USDT — Market StructureThe chart clearly shows a rising channel that price has respected for 3.5 years.
During the flash crash, there was a brief sweep below the lower boundary, but price quickly reclaimed it and has not broken down since.
As long as the weekly timeframe does not close below the lower boundary, the channel remains valid.
Accordingly, this is the logical stop level.
At current prices, the setup offers a solid risk/reward: price is sitting in an accumulation zone, and a bullish engulfing pattern has formed.
UNI also has strong fundamentals:
— positive tokenomics changes: 100M UNI scheduled to be burned,
— additional UNI burns planned from a portion of DEX platform revenues.
Suitable for adding to a long-term investment portfolio.

$UNI is sitting on a major long term demand zone, and historicalUNI is sitting on a major long term demand zone, and historically every time price respected this base, it delivered a strong upside move, the last comparable setup resulted in a ~156% pump. Right now, the focus is clear: support lies at $4.70–$5.26 with deeper demand at $3.30–$4.10, while $7.18–$7.80 remains the key resistance that must break to unlock real upside.

FireHoseReel | Uniswap Is Approaching a Market Decision Zone🔥 Welcome To FireHoseReel !
Let’s jump into Uni Swap (UNI) market analysis.
👀 UNI 4H Overview
UNI is currently trading inside a range box, with resistance at $5.858 and support at $5.445.
A breakout from either side can lead to a major move. Looking at the chart history, every strong upside move has been followed by a deep correction, yet the impulses themselves have been very sharp and aggressive.
📊 Volume Analysis
UNI volume on Binance is currently not very strong, so clear confirmation is still missing.
However, when UNI starts printing high volume on Binance as well, it signals increased trader attention.
A rise in volume would be a logical confirmation for the next price move.
✍️ UNI Trading Scenarios
🟢 Long Scenario:
A breakout above $5.858 can activate our long trigger, but this setup requires a clear increase in buying volume for confirmation.
🔴 Short Scenario:
A breakdown below the $5.44 support can push price toward the next demand zone.
This move should be confirmed with a strong rise in selling volume, making it a valid short opportunity.
🧠 Protect your capital first. No setup is worth blowing your account. If risk isn’t controlled, profit means nothing. Trade with rules, not emotions.

UNIUSDT OK 🦌 BINANCE:UNIUSDT is bear trend but this level between 5 to 6 $ best level for again buy.
Supports: 6 - 5.5 - 5
Resistance: 7 - 9.35 - 11
⚠️Please control your risk
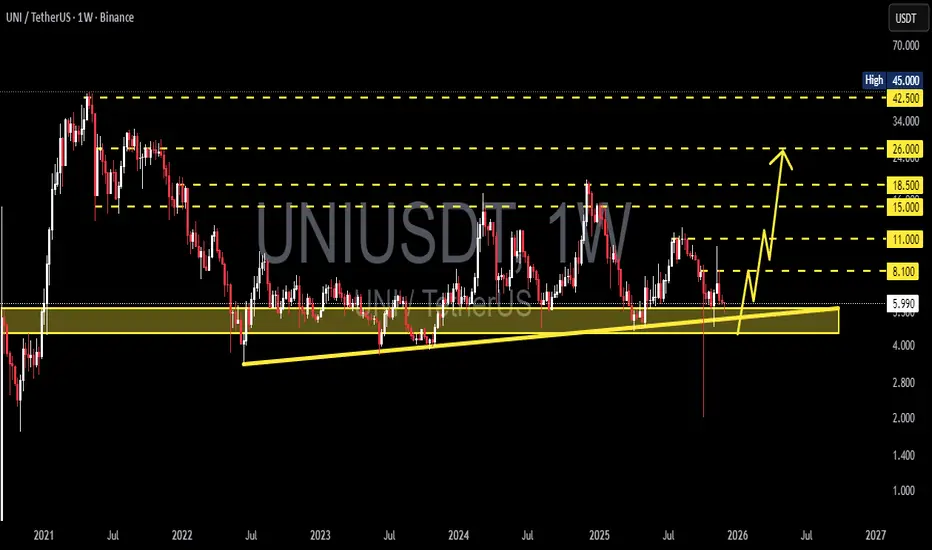
UNI/USDT — The Decision Zone: A Major Rebound or Full Breakdown?UNI is now sitting at the most critical level since 2022.
Price has returned to the golden support zone at 5.7–4.5, an area that has repeatedly acted as the final defense before massive moves — either explosive rallies or deep capitulation.
The weekly structure reveals one thing clearly:
The market is testing long-term investor conviction.
---
🔶 Market Structure & Dominant Pattern
UNI has been forming a multi-year accumulation range, with a remarkably consistent base at 5.7–4.5.
An ascending base formation has slowly taken shape from 2022 to 2025, showing subtle higher lows.
Price action here will determine whether this structure becomes:
Re-accumulation before a new uptrend, or
Distribution before a major breakdown.
This zone is not just support —
it is a liquidity battlefield where large buyers and market makers typically operate.
---
🟩 Bullish Scenario — If 5.7–4.5 Holds
If UNI shows strong weekly rejection from this zone:
1. Expect a bullish reversal candle (pin bar / long wick) confirming buyer aggression.
2. First target: 8.1 — the initial key resistance.
3. If momentum continues, price could expand toward
11 → 15 → 18.5.
4. A clean break above 15 usually signals the beginning of a mid-term expansion phase.
This is the scenario where UNI reclaims strength as one of the main DeFi assets.
---
🟥 Bearish Scenario — If 4.5 Breaks
A weekly close below 4.5 would be a major structural failure:
The multi-year accumulation pattern becomes invalid.
Market likely enters a capitulation phase.
Downside targets would shift to:
3.0
And potentially 2.0 if selling accelerates.
This scenario only unfolds if investors completely abandon the support zone.
---
🔍 Why the 5.7–4.5 Zone Is Critical
Almost every UNI rally since 2022 has started from this box.
Massive liquidity sits here: stop-loss clusters, limit orders, and margin liquidations.
Historical wicks repeatedly show aggressive buybacks from this region.
Market makers tend to accumulate here before large directional moves.
Simply put:
If UNI is going to launch a new uptrend, this is the most strategic zone to do it.
---
🧭 Bottom Line
UNI is in a make-or-break phase.
Holding above 5.7–4.5 opens a pathway toward 11–18.
Breaking below 4.5 sets the stage for a deeper bearish continuation.
This chart has no middle ground —
The next weekly closing will define UNI’s trajectory for 2025.
---
🔖 Hashtags for TradingView
#UNI #UNIUSDT #Uniswap #CryptoAnalysis #WeeklyChart #SupportZone #BreakoutOrBreakdown #BullishScenario #BearishScenario #CryptoMarket
UNI Waite for strong breakout %25 gain toward 7.70$Hi the support and resistances on the chart are based on the previous data and weekly candlesticks if BINANCE:UNIUSDT holds this last support the potential of 25% gain is logical toward 7.70$

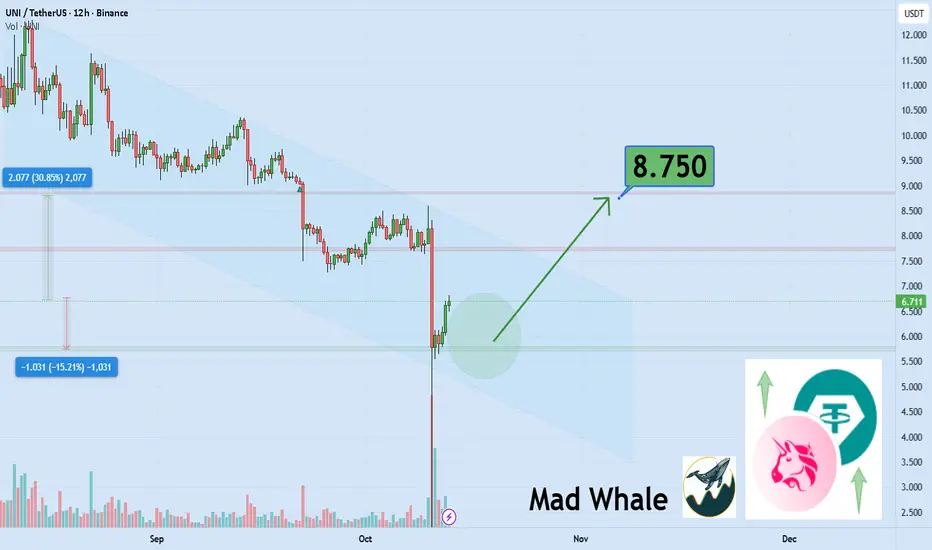
support area for Uni explosion of at least 30% gain to 8.75$hi
the support and resistances on the chart are based on the previous data and weekly candlesticks if BINANCE:UNIUSDT holds this last support the potential of 30% gain is logical toward 8.75$
UNIUSDT Better Long Setups Coming...Patience PaysI'm seeing a lot of bullish setups and decided to give me two cents.
Current UNI/USDT price action is raising a red flag for potential long entries. History shows this specific Rate of Change (ROC) zone has often marked a local top.
Historic ROC Overbought: Every time the price has pushed into this ROC zone in the past, it quickly resulted in a break of the bullish market structure. Followed by a corrective move down toward the support/accumulation zone. We are seeing that pattern play as of right now.
Balance Volume (OBV) indicator trendline has been broken. This confirms that buying volume is no longer supporting the price momentum.
This is not a good spot for a buy signal.
I personally would wait for the test of the support zone then look for buy. Then we can aim for our potential targets.
Good Luck!

UNI Looks Bearish (1H)From the point where we marked the red arrow on the chart, the UNISWAP correction has begun, and the pattern appears to be a diametric.
The best area for wave F to complete is the highlighted red zone. If the price reaches this zone, we will look for Sell/Short positions.
The stop-loss and targets are also marked on the chart.
For risk management, please don't forget stop loss and capital management
When we reach the first target, save some profit and then change the stop to entry
Comment if you have any questions
Thank You

UNI SWAPHello friends
As you know and the news has spread, UNI has grown well, which indicates the arrival of buyers.
Now that the price is correcting, we have two scenarios:
The first scenario is that the price breaks the specified channel from here and moves to the specified targets.
The second scenario is that the price corrects further, which is also better because you can buy at lower prices.
Please note that our suggestion is to buy a ladder with capital and risk management and be careful to observe capital management and not act emotionally.
*Trade safely with us*

UNI — Third Time’s the Charm?Wrapping up today with one more setup — UNI looks ready for a move lower. We’ve got a clean break of the trendline, structure turning bearish, and confluence across multiple signals pointing south.
I’m entering on the Fair Value Gap retracement, right after a one-candle pullback — keeping it tight and calculated.
Let’s see if this setup delivers! 😎
Trade safe and protect your capital — always. 📉💪

UNIUSDT - The Best Going to Retest!The coin skyrocketed 45% in a single daily candle right after breaking out of the red rectangle.
That rectangle represents a major support zone on the chart — so as long as it’s pulling back, it’s likely just retesting that zone before starting a new bullish leg upward.
This area lines up with the 0.618 Fibonacci level, plus both the 25 EMA and 50 EMA, which are getting ready to form a golden cross, and it also matches the descending trendline.
⚠️ Caution with futures trading though — market makers can easily play psychological tricks around this exact zone
Best Regards:
Ceciliones🎯

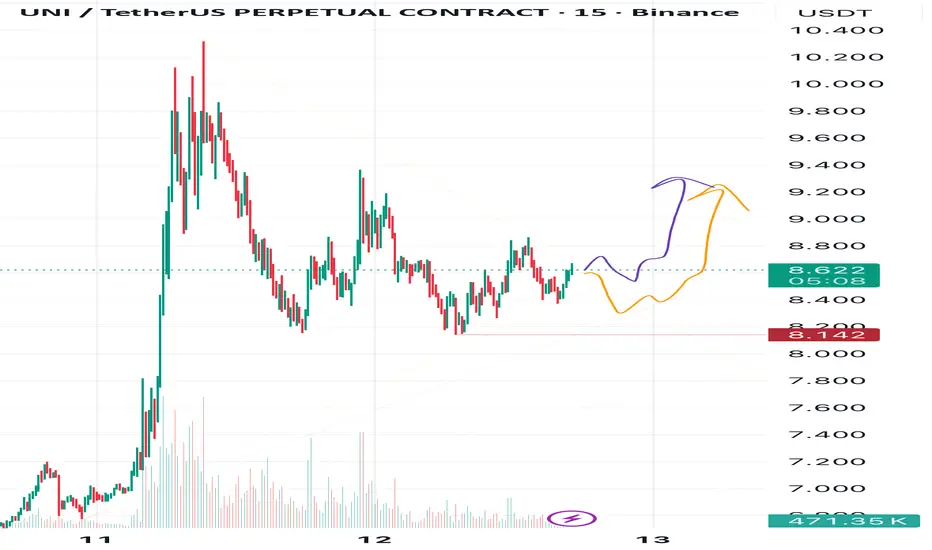
UNI Rising Soon — Triangle in TuneThe situation in UNI right now looks almost identical to what I recently showed in my post about NEAR.
We’re seeing a corrective triangle, and a breakout to the upside seems likely.
As always, I see two possible scenarios — shown by the orange and purple arrows on my chart.
🎯 Targets:
• Target 1: 9.000
• Target 2: 9.400
• Target 3: 10.000
For now, my main focus remains on Target 1, since we’re still in a corrective phase.
❌ Invalidation zone: 8.142
⚠️ Disclaimer:
This is not a financial signal, just my personal view of the market.
Trade according to your own risk management, and never trade without stop-losses.
💬 Drop your comments and reactions below — and hit follow if you’d like me to keep sharing regular updates and forecasts on UNI!
$UNI Update📊 CRYPTOCAP:UNI Update
CRYPTOCAP:UNI is testing the 🔴 resistance zone — a breakout could confirm a bullish setup 📈
If confirmed, first target is the 🟢 level —
