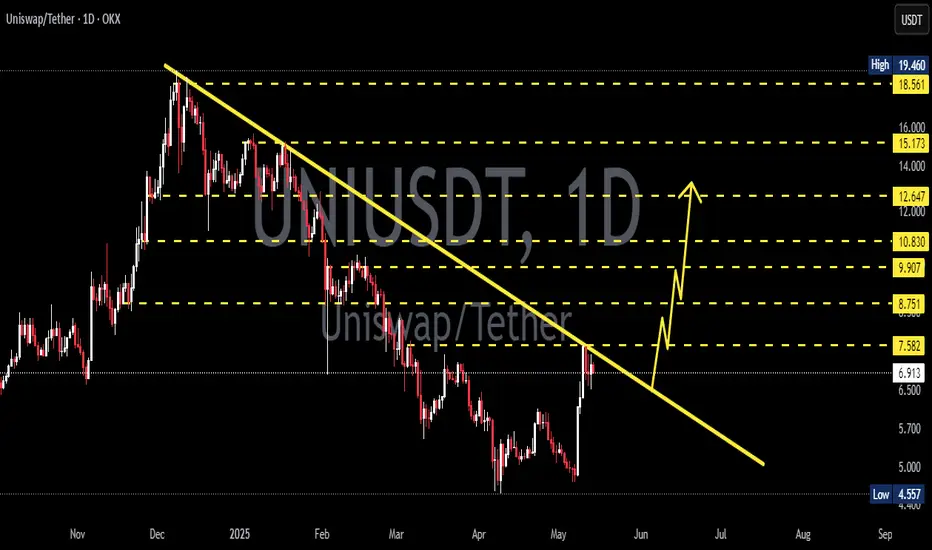
UNIUSDT — at Golden Zone: Major Reversal or the Final Breakdown?Main Narrative
UNI is currently trading at one of the most decisive levels in its entire price history — the $4.0–$5.0 zone, a multi-year fortress of demand that has repeatedly triggered strong rebounds since 2021.
Each time price entered this zone, buyers stepped in aggressively. However, this time the structure looks different — lower highs have been forming consistently, indicating sustained selling pressure.
This is a make-or-break moment for UNI: either it defends this golden zone and starts a new uptrend, or it breaks down into uncharted territory.
---
Technical Analysis
Timeframe: Weekly (mid-to-long-term structure).
Current price: Around $6.39, sitting just above the critical golden zone.
Key levels:
Support zone: $4.0–$5.0 → major historical accumulation area since 2021–2024.
Resistance levels: $8.77 → $11.04 → $14.31 → $18.33 → $26.41 → $42.82.
All-Time High: $45.00.
Price structure:
Continuous lower highs since early 2024, showing sustained bearish control.
Price is moving within a multi-year accumulation range roughly between $4 and $18 — forming a type of megaphone compression that’s nearing its resolution point.
Notice the long lower wick below the current range — a clear liquidity sweep or stop-hunt, often a precursor to trend reversals.
Main pattern formation:
Descending structure (lower highs) → bearish compression.
Potential double bottom / spring setup → if a bullish candle forms in this zone, a macro reversal may begin.
Long-term accumulation range → suggests the market is building energy for a large move soon.
---
Bullish Scenario
Major Reversal Setup (Reclaim from the Golden Zone)
If UNI holds the $4.0–$5.0 zone and forms a strong bullish weekly candle, key upside targets are:
Target 1: $8.77 (first major resistance reclaim)
Target 2: $11.04
Target 3: $14.31
Extended target: $18.33 if momentum builds.
Additional confirmation: weekly bullish divergence on RSI or MACD, and a break above the first lower high structure.
This would signal the start of a potential mid-term reversal trend — possibly marking this zone as the golden bottom for UNI.
---
Bearish Scenario
Breakdown Continuation (Collapse Below Multi-Year Support)
A weekly close below $4.0 would confirm a breakdown from a 3-year accumulation structure.
Consequences could be severe:
Next support levels: $2.5 → $1.7 → $0.85.
Likely panic sell-off or capitulation wave.
However, such a breakdown could also serve as a final shakeout before a large-scale reversal — watch the weekly close, not just intraday wicks.
---
Sentiment & Context
UNI is standing at a psychological and structural crossroads.
Long-term holders have been defending this area for years, making it a critical liquidity zone.
If the zone breaks, stop losses and long-term positions could be flushed — but if it holds, UNI could become one of the strongest DeFi rebound plays in the next cycle.
This is the kind of setup where patience and confirmation matter far more than prediction.
---
Conclusion
The $4.0–$5.0 zone is not just support — it’s UNI’s lifeline.
Hold above = possible start of a new bullish era.
Break below = risk of a deeper bearish expansion.
Everything now depends on how the weekly candle closes.
The best traders will wait for confirmation rather than chase the wick.
> “This golden zone will decide UNI’s destiny — rebirth from the ashes, or another chapter in its decline.”
---
#UNI #UNIUSDT #Uniswap #CryptoAnalysis #TechnicalAnalysis #DeFi #SupportZone #WeeklyChart #TrendReversal #BreakdownAlert #SwingTrading #CryptoMarket #ChartAnalysis #CryptoOutlook
UNIUSDTPERP

#UNI/USDT Forming Bullish Continuation#UNI
The price is moving within a descending channel on the 1-hour frame, adhering well to it, and is heading for a strong breakout and retest.
We have a bearish trend on the RSI indicator that is about to be broken and retested, supporting the upside.
There is a major support area (marked in green) at 9.50, which represents a strong basis for the upside.
For inquiries, please leave a comment.
We are in a consolidation trend above the 100 Moving Average.
Entry price: 10.40
First target: 11.08
Second target: 11.89
Third target: 13.03
Don't forget a simple matter: capital management.
When you reach the first target, save some money and then change your stop-loss order to an entry order.
For inquiries, please leave a comment.
Thank you.
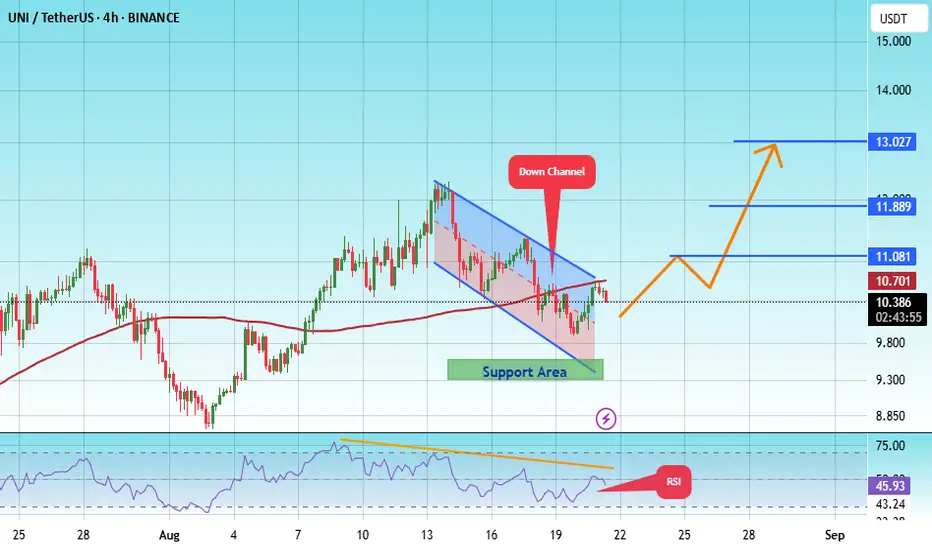
Important range: 10.626-12.130
Hello, traders!
Follow us to get the latest information quickly.
Have a great day!
-------------------------------------
Uniswap (UNI) is used on DEX exchanges.
This makes it connected to many ecosystems.
However, it's worth considering whether this coin (token) is worth holding in the medium to long term.
This is because if the DEX exchange fails to activate and fails, it could disappear completely.
Therefore, to trade this coin (token), I recommend holding it by gradually increasing the amount of coins (tokens) that represent profits.
-
(UNIUSDT 1M chart)
The key is whether it can break above the formed channel.
-
(1W chart)
The key is whether it can find support around 10.626 and rise above 14.233-17.073.
If it declines below 10.626, it should check for support around 5.448-6.940.
Therefore, if it falls below the M-Signal indicator on the 1M chart, trading should be halted and the situation should be assessed.
-
(1D Chart)
The key is whether the price can maintain support above 14.233, with support found around 10.626-12.130.
If the price fails to rise, we should check for support around 9.080.
If not, a decline to 6.940 is possible.
Since a short-term upward channel has formed, we should examine whether the price can rise along this channel.
--------------------------------------------------
Increasing the number of coins (tokens) for profit involves selling the original purchase price (+ transaction fees) to retain the coins (tokens) corresponding to the profit.
This increases the number of coins (tokens) with an average purchase price of 0, making it possible to hold them for the medium to long term.
This strategy is more effective in a downtrend than in an uptrend.
-
Thank you for reading to the end.
I wish you successful trading.
--------------------------------------------------
- Here's an explanation of the big picture.
(3-year bull market, 1-year bear market pattern)
I'll explain more in detail when the bear market begins.
------------------------------------------------------

#UNI/USDT#UNI
The price is moving within a descending channel on the 1-hour frame, adhering well to it, and is heading toward a strong breakout and retest.
We are experiencing a rebound from the lower boundary of the descending channel, which is support at 7.78.
We are experiencing a downtrend on the RSI indicator that is about to be broken and retested, supporting the upward trend.
We are looking for stability above the 100 Moving Average.
Entry price: 7.85
First target: 8.19
Second target: 8.53
Third target: 8.85

UNIUSDT 1D Analysis UNI ~ 1D Analysis
#UNI Buy gradually after successfully breaking through this resistance line with a short-term target of at least 10%++
UNIUSDT 1WUNI ~ 1W Analysis
#UNI If you still have a Conviction on this coin, maybe this support you can consider to start buying back with a minimum target of 20%+.

#UNI/USDT#UNI
The price is moving within a descending channel on the 1-hour frame, adhering well to it, and is heading for a strong breakout and retest.
We are experiencing a rebound from the lower boundary of the descending channel, which is support at 5.50.
We are experiencing a downtrend on the RSI indicator, which is about to break and retest, supporting the upward trend.
We are looking for stability above the 100 Moving Average.
Entry price: 6.20
First target: 6.75
Second target: 7.28
Third target: 7.92

UNIUSDT 1WUNI ~ 1W Analysis
#UNI Buy gradually from here if you still have a Conviction on this Coin with a minimum target of 20%+.
UNIUSDT Perpetual Swap Contract (4H - OKX) AnalysisUNIUSDT Perpetual Swap Contract (4H - OKX) Analysis
1. Trend Analysis
Overall Bearish Trend:
UNI has been in a strong downtrend, forming lower highs and lower lows.
The price is still below EMA 50, EMA 100, and EMA 200, confirming bearish momentum.
A Break of Structure (BOS) occurred earlier, reinforcing the downtrend.
Potential Reversal Signals:
The price bounced off the demand zone (around 10.22 USDT) and is attempting a recovery.
It is now testing EMA 20, and if it can break above EMA 50, a short-term reversal may be confirmed.
A successful break of 12.158 USDT (TP1) could push price higher towards EMA 50 and 100.
2. Key Resistance & Support Levels
Resistance Levels:
12.510 USDT (EMA 50 & local resistance) → Immediate resistance that UNI must break to continue higher.
13.302 - 13.590 USDT (EMA 100 & Fib 0.618) → If price reaches here, expect stronger resistance.
14.680 - 15.037 USDT (Fib 0.786 & EMA 200) → A major resistance zone. If broken, UNI could enter a bullish trend reversal.
Support Levels:
11.098 - 10.922 USDT (Demand Zone & Previous Bounce Area) → Strong support where buyers stepped in.
10.22 USDT (Entry Level from Demand Zone) → If price retests this level, it must hold to prevent further downside.
9.066 USDT (SL Level) → If UNI breaks below this level, further downside is expected.
3. Risks & Concerns
Low Volume on Bounce:
The price has bounced, but volume remains weak, meaning this could be a short-lived recovery.
UNI needs a strong volume breakout above EMA 50 to confirm a bullish reversal.
Bearish Market Structure Still in Play:
Even if UNI moves higher, it remains in a downtrend unless it clears 13.590 USDT (EMA 100).
A rejection at 12.510 USDT could lead to another move downward.
EMA Resistance Overhead:
UNI is facing multiple moving average resistances (EMA 50, EMA 100, EMA 200).
If price struggles to break EMA 50 at 12.510 USDT, selling pressure may return.
4. Trading Strategy
✅ Long Scenario (If Bullish Breakout Occurs):
Entry: If price holds above 12.158 USDT (TP1 level).
Target 1: 12.510 USDT (EMA 50 Resistance)
Target 2: 13.302 - 13.590 USDT (EMA 100 & Fib 0.618)
Target 3: 14.680 - 15.037 USDT (EMA 200 & Fib 0.786)
Stop-Loss: Below 10.922 USDT (Demand Zone)
✅ Short Scenario (If Price Rejects at Resistance):
Entry: If UNI fails to break 12.510 USDT (EMA 50 Resistance)
Target 1: 11.707 - 11.098 USDT (Local Support Zone)
Target 2: 10.922 - 10.220 USDT (Demand Zone Retest)
Target 3: 9.066 USDT (Extended Downside)
Stop-Loss: Above 12.750 USDT to prevent being stopped out on a breakout.
5. Summary & Outlook
📌 UNI has bounced from a demand zone but still faces strong resistance at 12.510 USDT.
📌 A breakout above 12.510 USDT could signal a short-term bullish move towards EMA 100 (13.590 USDT).
📌 Failure to break resistance may lead to another drop towards 10.922 USDT or lower.
🔎 Recommendation:
Watch price action near 12.510 USDT—if it breaks with volume, it could be a long setup.
If rejection occurs, look for short opportunities back to 10.922 USDT.
Let me know if you need further adjustments! 🚀📊

#UNI/USDT Ready to launch upwards#UNI
The price is moving in a descending channel on the 4-hour frame and is adhering to it well and is heading to break it strongly upwards
We have a bounce from the lower limit of the descending channel, this support is at a price of 10.23
We have a downtrend on the RSI indicator that is about to be broken, which supports the rise
We have a trend to stabilize above the moving average 100
Entry price 11.80
First target 12.78
Second target 14.11
Third target 15.75

UNIUSDT | Accuracy is What We DeliverAccuracy is what we deliver. Check out my earlier Uniswap analyses for reference—this one is no different. Let’s keep winning! 🚀
🟣 UNIUSDT.P: Long-Term Trade
Uniswap (UNI) Analysis
Hourly and Main Support Blue Boxes
I know many of you love hourly charts and want me to share them, but let’s face it—hourly reactions often lack strength. Still, I’ve shared the first blue box on the hourly chart that could deliver a modest 5-6% reaction.
Highlights:
Hourly Blue Box: A potential zone for a short-term reaction, offering a quick 5-6% opportunity.
Main Support Box: The real deal is the blue box below, a high-probability area for strong reactions.
Track Record: My previous Uniswap analyses have proven their accuracy, and this one follows the same disciplined approach.
Key Observations:
"The blue boxes are carefully selected using volume footprint, volume profile, cumulative delta volume, and liquidity heatmap. When trading these zones, I will look for buyer activity and upward market structure breaks in lower time frames for confirmation."
Let me tell you, this is something special. These insights, these setups—they’re not just good; they’re game-changers. I've spent years refining my approach, and the results speak for themselves. People are always asking, "How do you spot these opportunities?" It’s simple: experience, clarity, and a focus on high-probability moves.
Want to know how I use heatmaps, cumulative volume delta, and volume footprint techniques to find demand zones with precision? I’m happy to share—just send me a message. No cost, no catch. I believe in helping people make smarter decisions.
Here are some of my recent analyses. Each one highlights key opportunities:
🚀 RENDERUSDT: Strategic Support Zones at the Blue Boxes +%45 Reaction
🎯 PUNDIXUSDT: Huge Opportunity | 250% Volume Spike - %60 Reaction Sniper Entry
🌐 CryptoMarkets TOTAL2: Support Zone
🚀 GMTUSDT: %35 FAST REJECTION FROM THE RED BOX
🎯 ZENUSDT.P: Patience & Profitability | %230 Reaction from the Sniper Entry
🎯 DEXEUSDT %180 Reaction with %9 Stop
🐶 DOGEUSDT.P: Next Move
🎨 RENDERUSDT.P: Opportunity of the Month
💎 ETHUSDT.P: Where to Retrace
🟢 BNBUSDT.P: Potential Surge
📊 BTC Dominance: Reaction Zone
🌊 WAVESUSDT.P: Demand Zone Potential
🟣 UNIUSDT.P: Long-Term Trade
🔵 XRPUSDT.P: Entry Zones
🔗 LINKUSDT.P: Follow The River
📈 BTCUSDT.P: Two Key Demand Zones
🟩 POLUSDT: Bullish Momentum
🌟 PENDLEUSDT.P: Where Opportunity Meets Precision
🔥 BTCUSDT.P: Liquidation of Highly Leveraged Longs
🌊 SOLUSDT.P: SOL's Dip - Your Opportunity
🐸 1000PEPEUSDT.P: Prime Bounce Zone Unlocked
🚀 ETHUSDT.P: Set to Explode - Don't Miss This Game Changer
🤖 IQUSDT: Smart Plan
⚡️ PONDUSDT: A Trade Not Taken Is Better Than a Losing One
💼 STMXUSDT: 2 Buying Areas
🐢 TURBOUSDT: Buy Zones and Buyer Presence
🌍 ICPUSDT.P: Massive Upside Potential | Check the Trade Update For Seeing Results
🟠 IDEXUSDT: Spot Buy Area | %26 Profit if You Trade with MSB
📌 USUALUSDT: Buyers Are Active + %70 Profit in Total
🌟 FORTHUSDT: Sniper Entry +%26 Reaction
🐳 QKCUSDT: Sniper Entry +%57 Reaction
📊 BTC.D: Retest of Key Area Highly Likely
This list? It’s just a small piece of what I’ve been working on. There’s so much more. Go check my profile, see the results for yourself. My goal is simple: provide value and help you win. If you’ve got questions, I’ve got answers. Let’s get to work!

#UNI/USDT Ready to go higher#UNI
The price is moving in a descending channel on the 1-hour frame and sticking to it well
We have a bounce from the lower limit of the descending channel, this support is at 14.00
We have a downtrend on the RSI indicator that is about to be broken, which supports the rise
We have a trend to stabilize above the 100 moving average
Entry price 14.50
First target 15.00
Second target 15.61
Third target 16.35

UNIUSDT 1WUNI Update ~ 1W
#UNI If you still have Conviction on this coin,. Buy gradually within this support block,. With a short term target of at least 20%++. This coin is still in a bullish trend

#UNI/USDT#UNI
The price is moving in an ascending channel on the 1-day frame and is sticking to it very well and is about to break higher
We have a bounce from the lower limit of the channel at 6.37
We have an ascending trend on the RSI indicator that is about to break, which supports the rise
We have a trend to stabilize above the 100 moving average
Entry price 7.16
First target 8.90
Second target 10.00
Third target 11.62

UNIUSDT.P | Long Term TradeI will only leave the entries I caught here at $4 and hold them until $40, which means a 1000% chance of gain against a 60% chance of loss. Good luck to everyone.
My Previous Ideas
DOGEUSDT.P | 4 Reward for 1 Risk much more if you hold it.
RENDERUSDT.P | HTF Accuracy
ETHUSDT.P | Accurate Buyer Zone Identification | High Risk Reward if you hold it.
BNBUSDT.P | Accurate Buyer Zone Identification | High Risk Reward if you hold it.
Bitcoin Dominance | Great Characteristic Detection and Accurate Analysis

Uniswap UNI price "wake up"💰 The city falls asleep - the unicorn CRYPTOCAP:UNI wakes up
Now OKX:UNIUSDT price has "hit" from down the local trend line, so:
if you are a happy holder of the #Uniswap token, just keep your fingers crossed that the price will break through and continue to move towards $13
if you want to buy this asset for your crypto portfolio, with the prospect of taking +70% profit by the end of the year, then first wait until the #UNIUSD price breaks through and consolidates above the red trend line.
_____________________
Did you like our analysis? Leave a comment, like, and follow to get more

UNIUSDTUNI ~ 3D ✅
#UNI Make purchases gradually in this pattern. it is only a matter of time until this resistance line is successfully broken.

UNI Perpetual Futures Contract - SHOOORTUniswap hasn't been performing well for a while; the price has been bearish. After TP4 is reached, we can start looking for a recovery. Expect high volatility soon and a strong bounce once TP4 is hit.
BINANCE:UNIUSDT.P
SL & TP Indicated in chart
Manage your leverage responsibly

UNI trade ideaUni has taken upside and did'nt make clear breakout. Now I am looking for Re-long in Previous FVGs as mentioned on the chart.

Uniswap and UNI price under "SEC pressure"💥Yesterday, the SEC announced "another victim of regulation" and sued Uniswap.
Today Uniswap commented on the event and in short, they are ready to fight. And no matter how much the SEC looks for "securities," the reality is that tokens traded on secondary markets like Uniswap are not investment contracts, but just digital files.
How do you like these statements from both sides?
Holders of CRYPTOCAP:UNI got scared and started selling sharply, which caused a 20% drop in the price of #UNIUSDT.
😱 But the most interesting is yet to come: large investors, owners, creators, and everyone else interested in #Uniswap need to keep the price in the $6.50-7.80 range
🙅♂️ $6.50 is a critical level for the #UNIUSD price, and fixing the price below this level will break the wave structure.
_____________________
Did you like our analysis? Leave a comment, like, and follow to get more

#UNI/USDT#UNI
We have a bearish channel on a 4-hour frame, the price moves within it and adheres to its borders well at this price.
We have a fundamental support area at $10
We have a higher stability moving average of 100
We have a downtrend on the RSI that is about to break higher
Entry price is 11.16
The first goal is 11.96
Second goal 14.16
Third goal 16.00

Cryptolean Uniswap UNI Update
Uniswap is trying to reverse from the key daily support level at $11.25.
A bullish reversal from $11.25 will result in a move to $12.63 and, possibly, higher to $14.28-$15.45.
A bearish break-out of $11.25 will push #UNI price lower towards $8.68.
Intraday Chart
The UNIUSDT 4-Hour chart is bearish and teasing $11.97.
A bearish breakout of $11.97 or a bearish rejection of $13.11 will push Uniswap price towards the key intraday support zone at $9.63-$10.60 and, possibly, lower towards $7.33, to close the gap formed on February, 23.
A bullish break-out of $13.11 will push price to re-test $15.24, however the price action may be slow and choppy.
Support once read!
Thank you

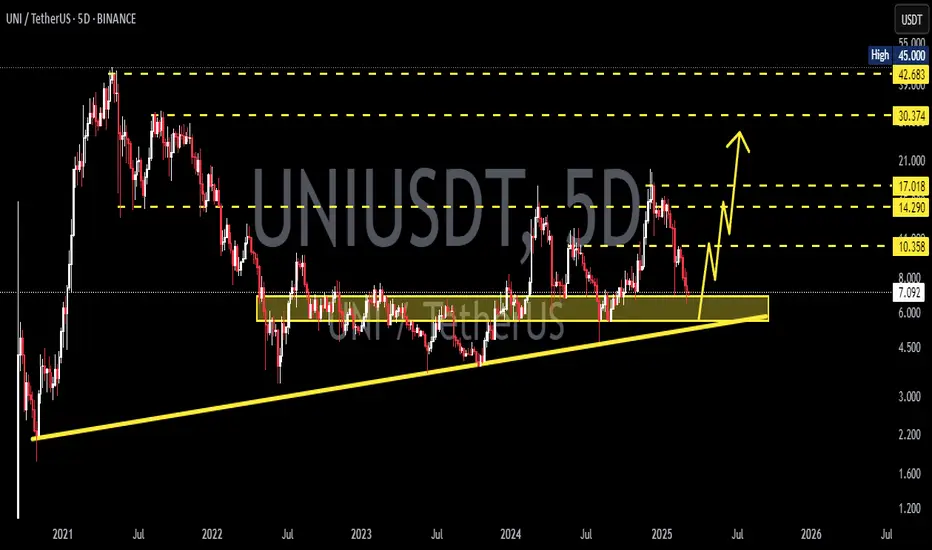
Is UNI's next target $26?Hello everyone!
I suggest paying attention to the #UNI token on the UNISWAP DEX.
On the chart, it is clear that after the last bullish market, a correction has started, forming a 3-wave Elliott correction structure.
Currently, according to the plan, we are in the first impulsive wave of growth. The asset has already successfully held above strong Fibonacci levels and even reached the target level of 0.618, from which the correction began.
You can consider entering a position from the current price values or place buy orders from the 0.5 Fibonacci level.
Target - $25.91
The final profit is over 100%. It depends on where you open the position from.
This is not financial advice, everything you do is at your own risk!
Follow me to get even more trading ideas!
